 (Please click on the iamge above to view our short YouTube video)
Local real estate market experts, Market Watch LLC, have just released their April 2022 Desert Housing Report. Some highlights:
 COACHELLA VALLEY DETACHED HOME MEDIAN PRICE: Market Watch noted that Coachella Valley home prices continued to surge in April, with the Coachella Valley detached home median price reaching $670,500 (up 19.8% year-over-year from $559,750 in April 2021 and up 52.3% from $440,000 in April 2020). While Market Watch felt that seasonal factors should begin to slow things down staring in June, they also felt that the forces that have been driving prices higher, i.e., low inventory and high demand, will continue to dominate the market.
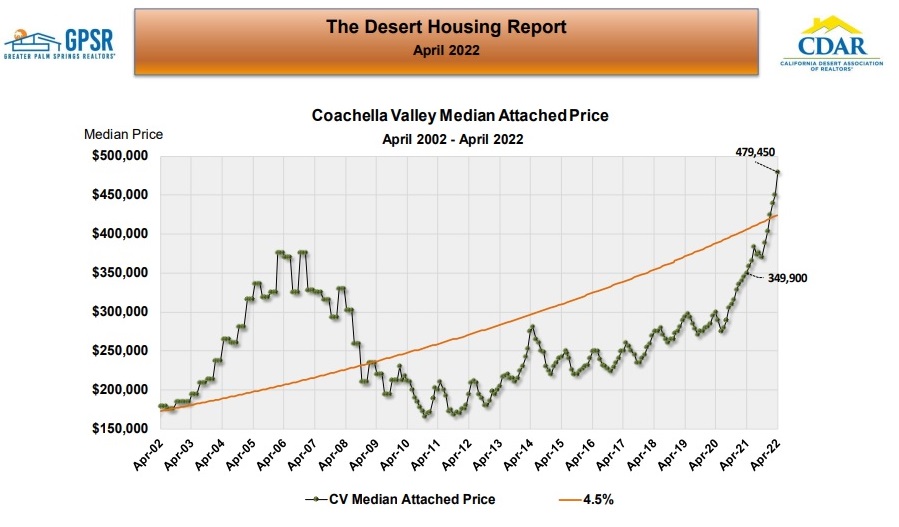 COACHELLA VALLEY ATTACHED HOME MEDIAN PRICE: The Coachella Valley attached home median price in April was $479,450 (up 37% year-over-year from $349,900 in April 2021 and up 60.4% from $299,000 in April 2020). Market Watch felt that if the past pre-pandemic historical seasonal pattern were to hold, attached home prices should peak sometime in the next two months and then settle down.
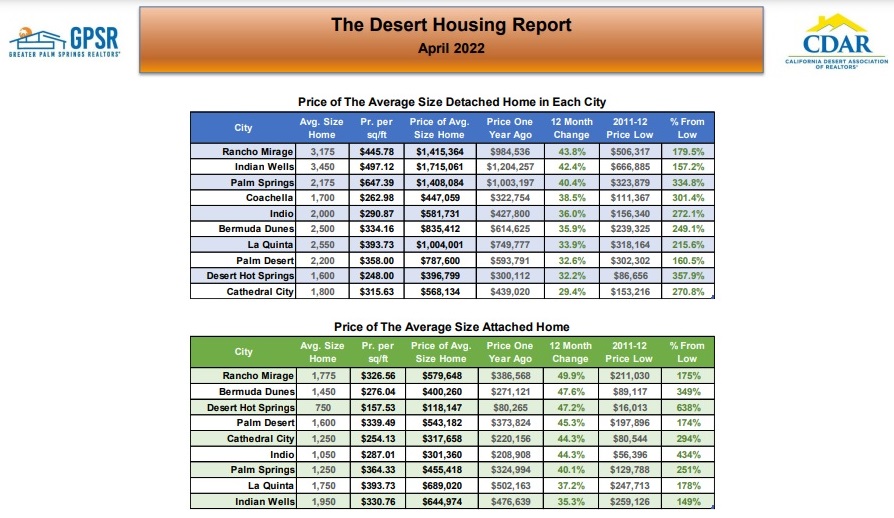 TWELVE MONTH CHANGE IN THE PRICE OF THE AVERAGE SIZE HOME BY CITY: The detached home median price for the average size home by city increased by more than 40% year-over-year in Rancho Mirage (up 43.8% for the average 3,175 sq ft detached home in that city), Indian Wells (up 42.4% year-over-year for the average 3,450 sq ft detached home in that city) and Palm Springs (up 40.4% for the average 2,175 sq ft detached home in that city). The attached home median price for the average size home by city increased by over 40% year-over-year in Rancho Mirage (up 49.9% year-over-year for the average size 1,775 sq ft attached home in that city), Bermuda Dunes (up 47.6% year-over-year for the average size 1,450 sq ft attached home in that city), Desert Hot Springs (up 47.2% year-over-year for the average size 750 sq ft attached home in that city), Palm Desert (up 45.3% year-over-year for the average size 1,600 sq ft attached home in that city), Cathedral City (up 44.3% year-over-year for the average size 1,250 sq ft attached home in that city), Indio (up 44.3% year-over-year for the average size 1,050 sq ft attached home in that city) and Palm Springs (up 40.1% year-over-year for the average size 1,250 sq ft attached home in that city).
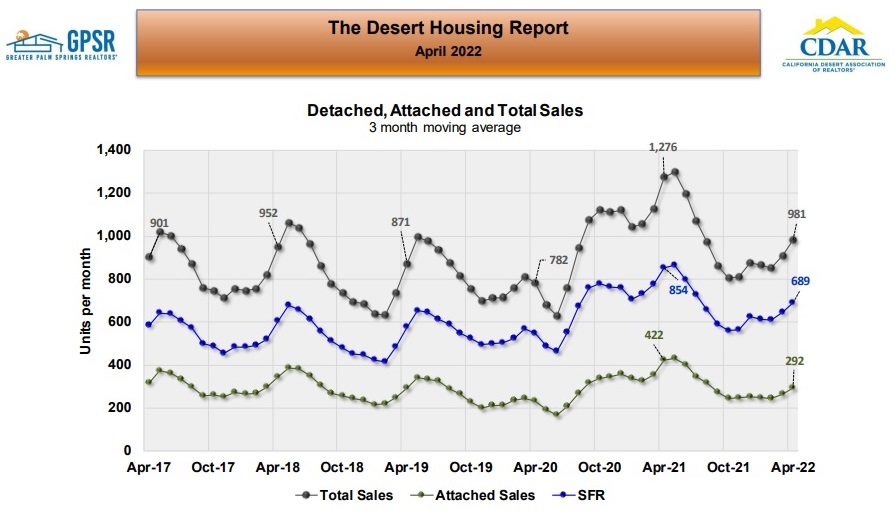 MONTHLY COACHELLA VALLEY HOME SALES (THREE-MONTH TRAILING AVERAGE): Total Coachella Valley home sales in April averaged 981 home sales per month (down 23% from the 1,276 average total home sales per month in April 2021, but slightly above pre-pandemic April home sales averages). Market Watch did point out that the expansion in sales that has historically occurred at this time of year is much less than past years, indicating a continuing decrease in home sales.
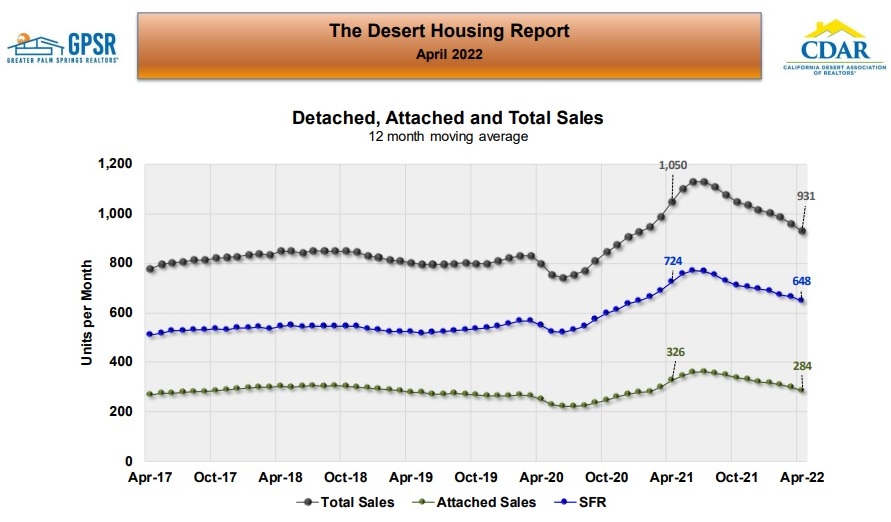 MONTHLY COACHELLA VALLEY HOME SALES (TWELVE-MONTH TRAILING AVERAGE): The 12-month average of home sales removes all seasonality from the date and revealed total April Coachella Valley home sales averaged 931 home sales per month (down 31 home sales per month from March and down 11% year-over-year). Sales of detached homes were down 10.5% year-over-year, while sales of attached homes were down 13% year-over-year. Market Watch expects the trend of long-term home sales continuing to decrease to continue due to supply restrictions from low inventory.
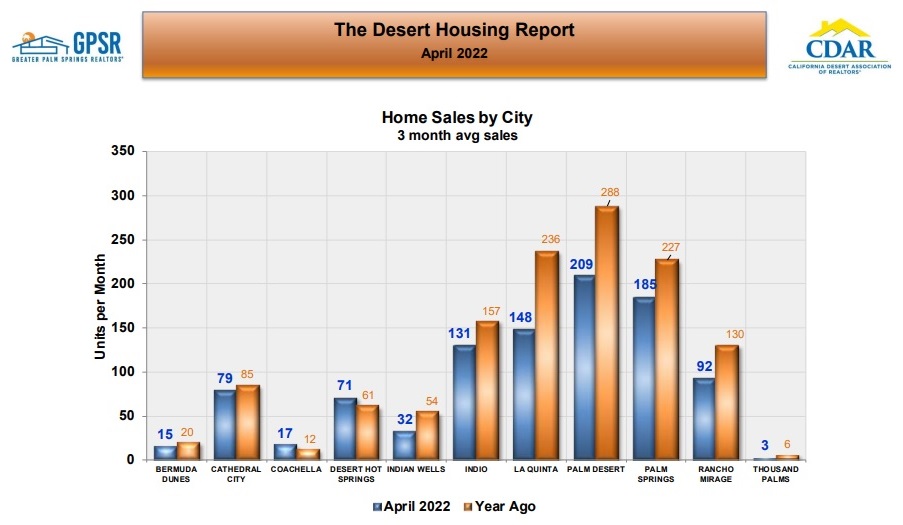 COACHELLA VALLEY HOME SALES BY CITY: Total home sales decreased year-over-year by 40.7% in Indian Wells, 37.3% in La Quinta, 29.2% in Rancho Mirage, 27.4% in Palm Desert and 18.5% in Palm Springs. Home sales in the cities that are classified primarily as “work force” cities, i.e., Coachella, Cathedral City, Desert Hot Springs and Indio, continued to show comparable home sales numbers to last year.
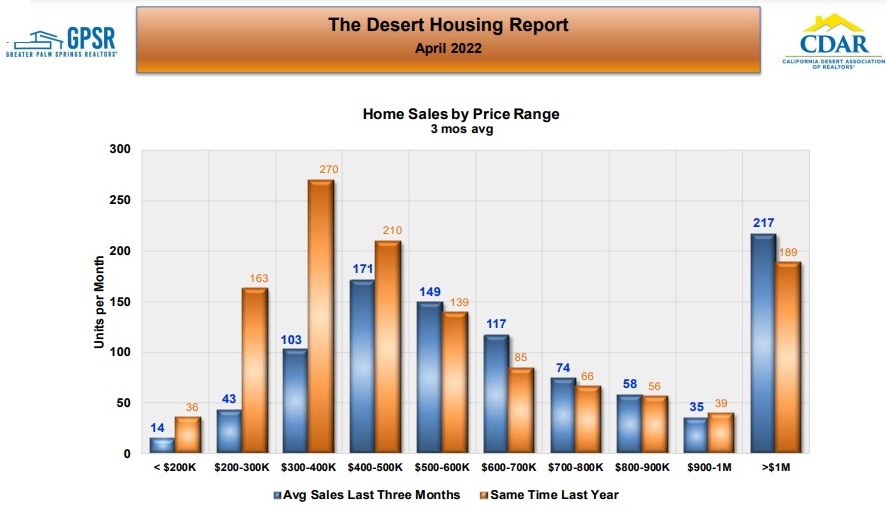 COACHELLA VALLEY HOME SALES BY PRICE RANGE: There was a large decline in sales of homes priced under $400,000 and a mild increase in sales of homes priced over $500,000. Market Watch pointed out that 217 sales of homes priced over one million dollars (compared to 189 sales of homes priced over one million dollars in April 2021). Market Watch noted that most of this increase is simply due to more homes now being in higher price brackets.
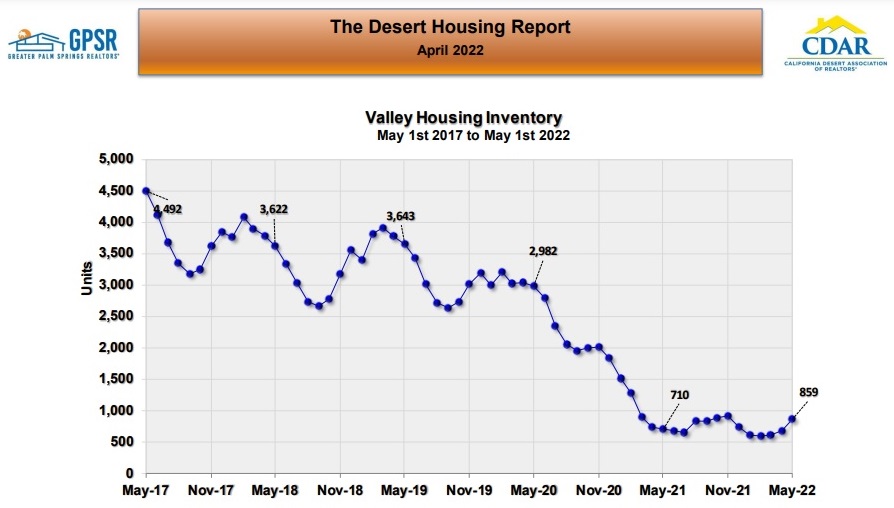 COACHELLA VALLEY HOME INVENTORY: On May 1st, the total Coachella Valley home inventory was 859 units (up 149 homes or 21% from May 1st 2021). Market Watch was somewhat encouraged by the increase in home inventory over the last two months at a time when historically home inventory has fallen due to seasonal factors. In order for inventory to increase, a surge in new listings is required. With only 1,240 new listings in April, which is just a normal April level of new listings, Market Watch does not see it happening yet.
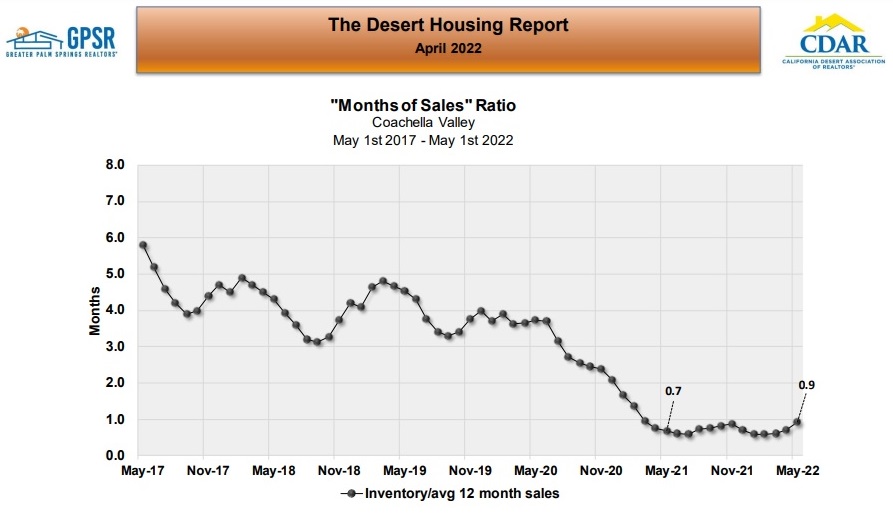 COACHELLA VALLEY MONTHS OF SALES RATIO: On May 1st, the months of sales ratio for the Coachella Valley was 0.9 months, up 0.2 months from May 1st, 2021. Market Watch explained that this slight increase was due to lower sales and higher inventory compared one year ago. They further explained that normal months of sales ratios would be between three and four months and that the current low months of sales ratio indicate continued upward pressure on home prices.
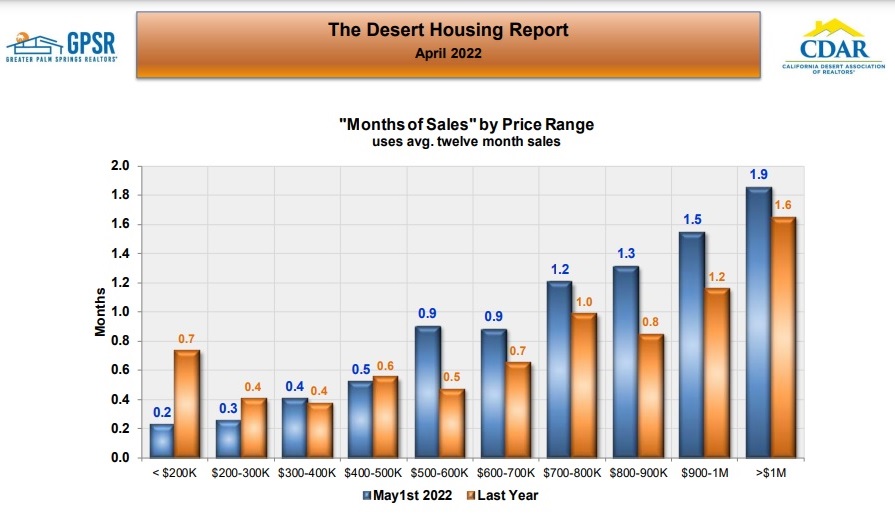 MONTHS OF SALE RATIOS BY PRICE RANGE: The May 1st months of sales ratios increased year-over-year in every price range over $500,000. In the price ranges below $500,000, the ratios were comparable or less than one year ago. Market Watch pointed out that the months of sales ratio for homes priced over one million dollars was 1.9 months, compared to historical norms of between 8 to 10 months. They felt that this showed that the upward pressure on home prices exists in every price range.
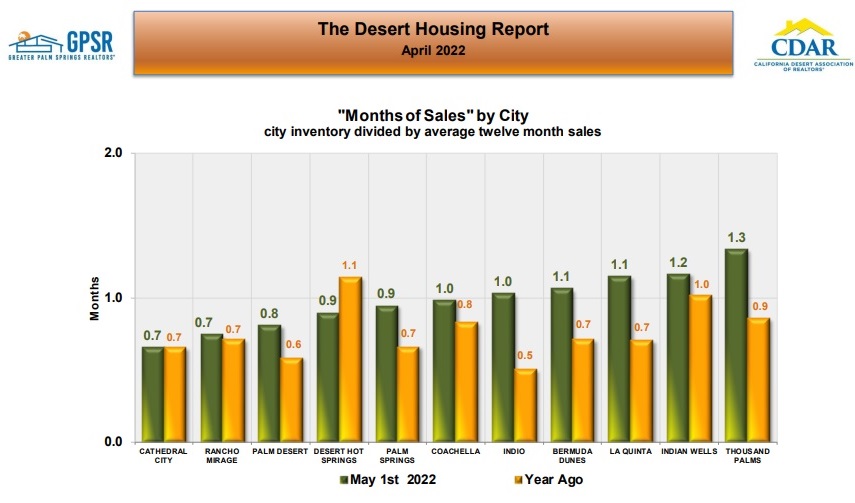 MONTHS OF SALES RATIOS BY CITY: Months of sales rations were under one month in Cathedral City, Rancho Mirage, Palm Desert, Desert Hot Springs and Palm Springs and close to one month in the other Coachella Valley cities.
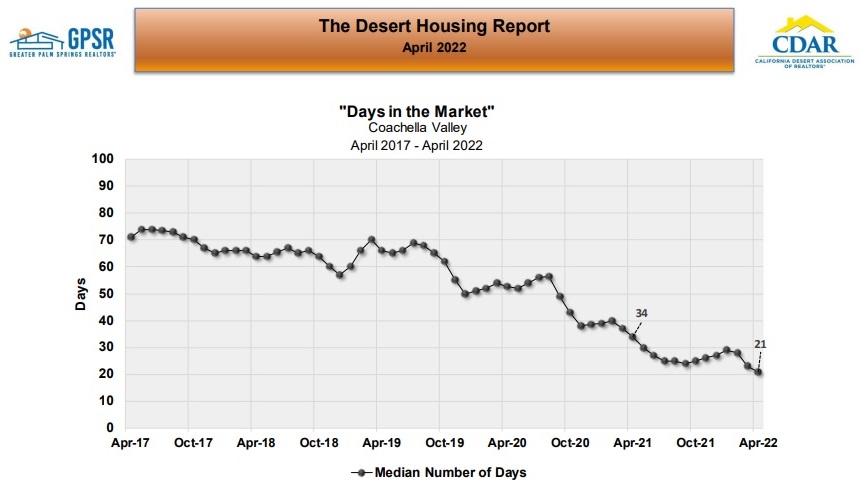 COACHELLA VALLEY DAYS IN THE MARKET: At the end of April, the median number of days in the market throughout the Coachella Valley was 21 days (down from 34 days at the end of April 2021 and compared to pre-pandemic median number of days in the market of between 60 to 70 days). Market Watch felt that with the current low home inventory, selling times should stay near the current, low levels.
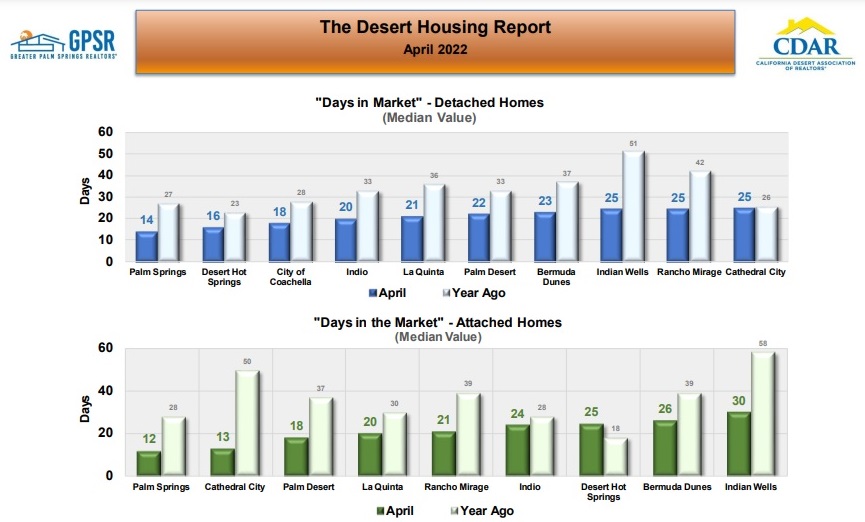 DAYS IN THE MARKET BY CITY: Palm Springs had the shortest median selling time for detached homes at just 14 days, followed by Desert Hot Springs at 16 days. Palm Springs also has the shortest median selling time for attached homes at just 12 days, followed by Cathedral City at 13 days.
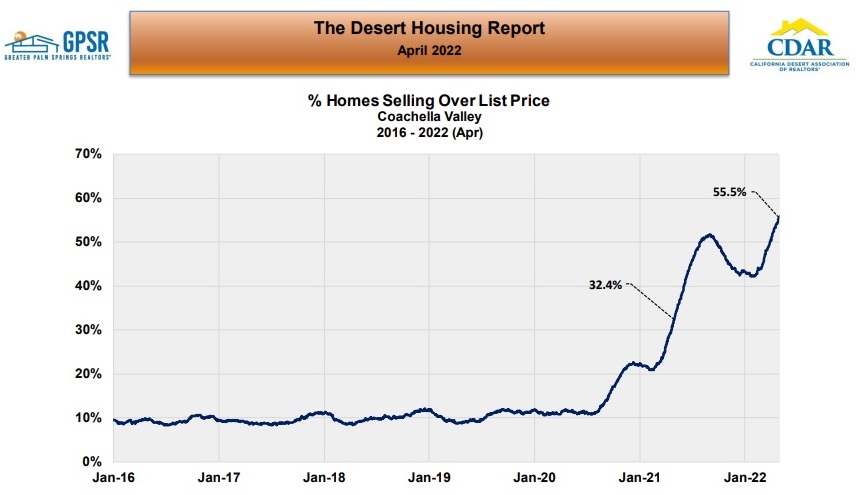 PERCENT OF HOMES SELLING ABOVE LIST PRICE: Market Watch just introduced this new metric showing the percentage of Coachella Valley homes that sold above list price during the last three months. At the end of April, 55.5% of Coachella Valley homes sold above list (the highest percentage in history and compared to 32.4% at the end of April 2021). Market Watch explained that in more normal times the percentage of homes selling above list price is around 10%.
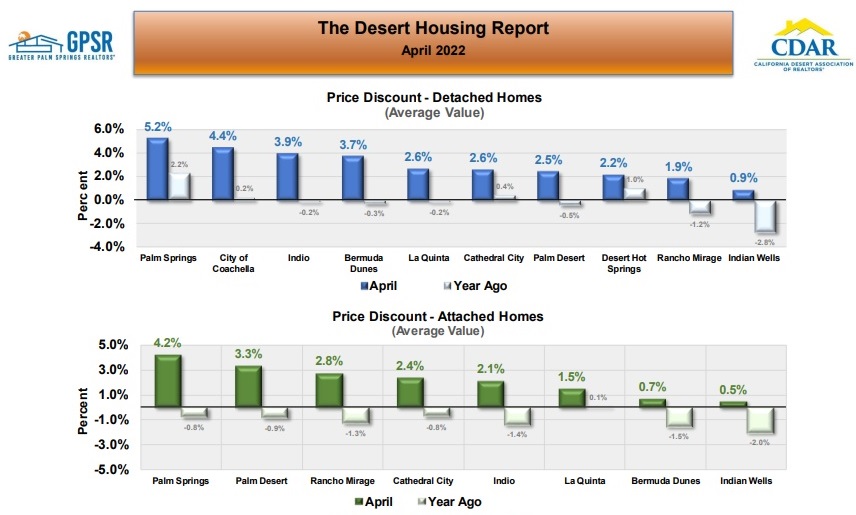 AVERAGE PRICE DISCOUNTS BY CITY: In April, Palm Springs continued to have the highest average selling premium for detached homes at 5.2%, followed by Coachella at 4.1%. Palm Springs also had the highest average selling premium for attached homes at 4.2%, followed by Palm Desert at 3.3%.
 CalDRE# 01898254 | 01896117 | 01991628