Our local real estate market experts, Market Watch LLC, just released their February 2026 GPSR Desert Housing Report. Some highlights, courtesy of the Greater Palm Springs Realtors®:
COACHELLA VALLEY FEBRUARY SALES RECOVERY
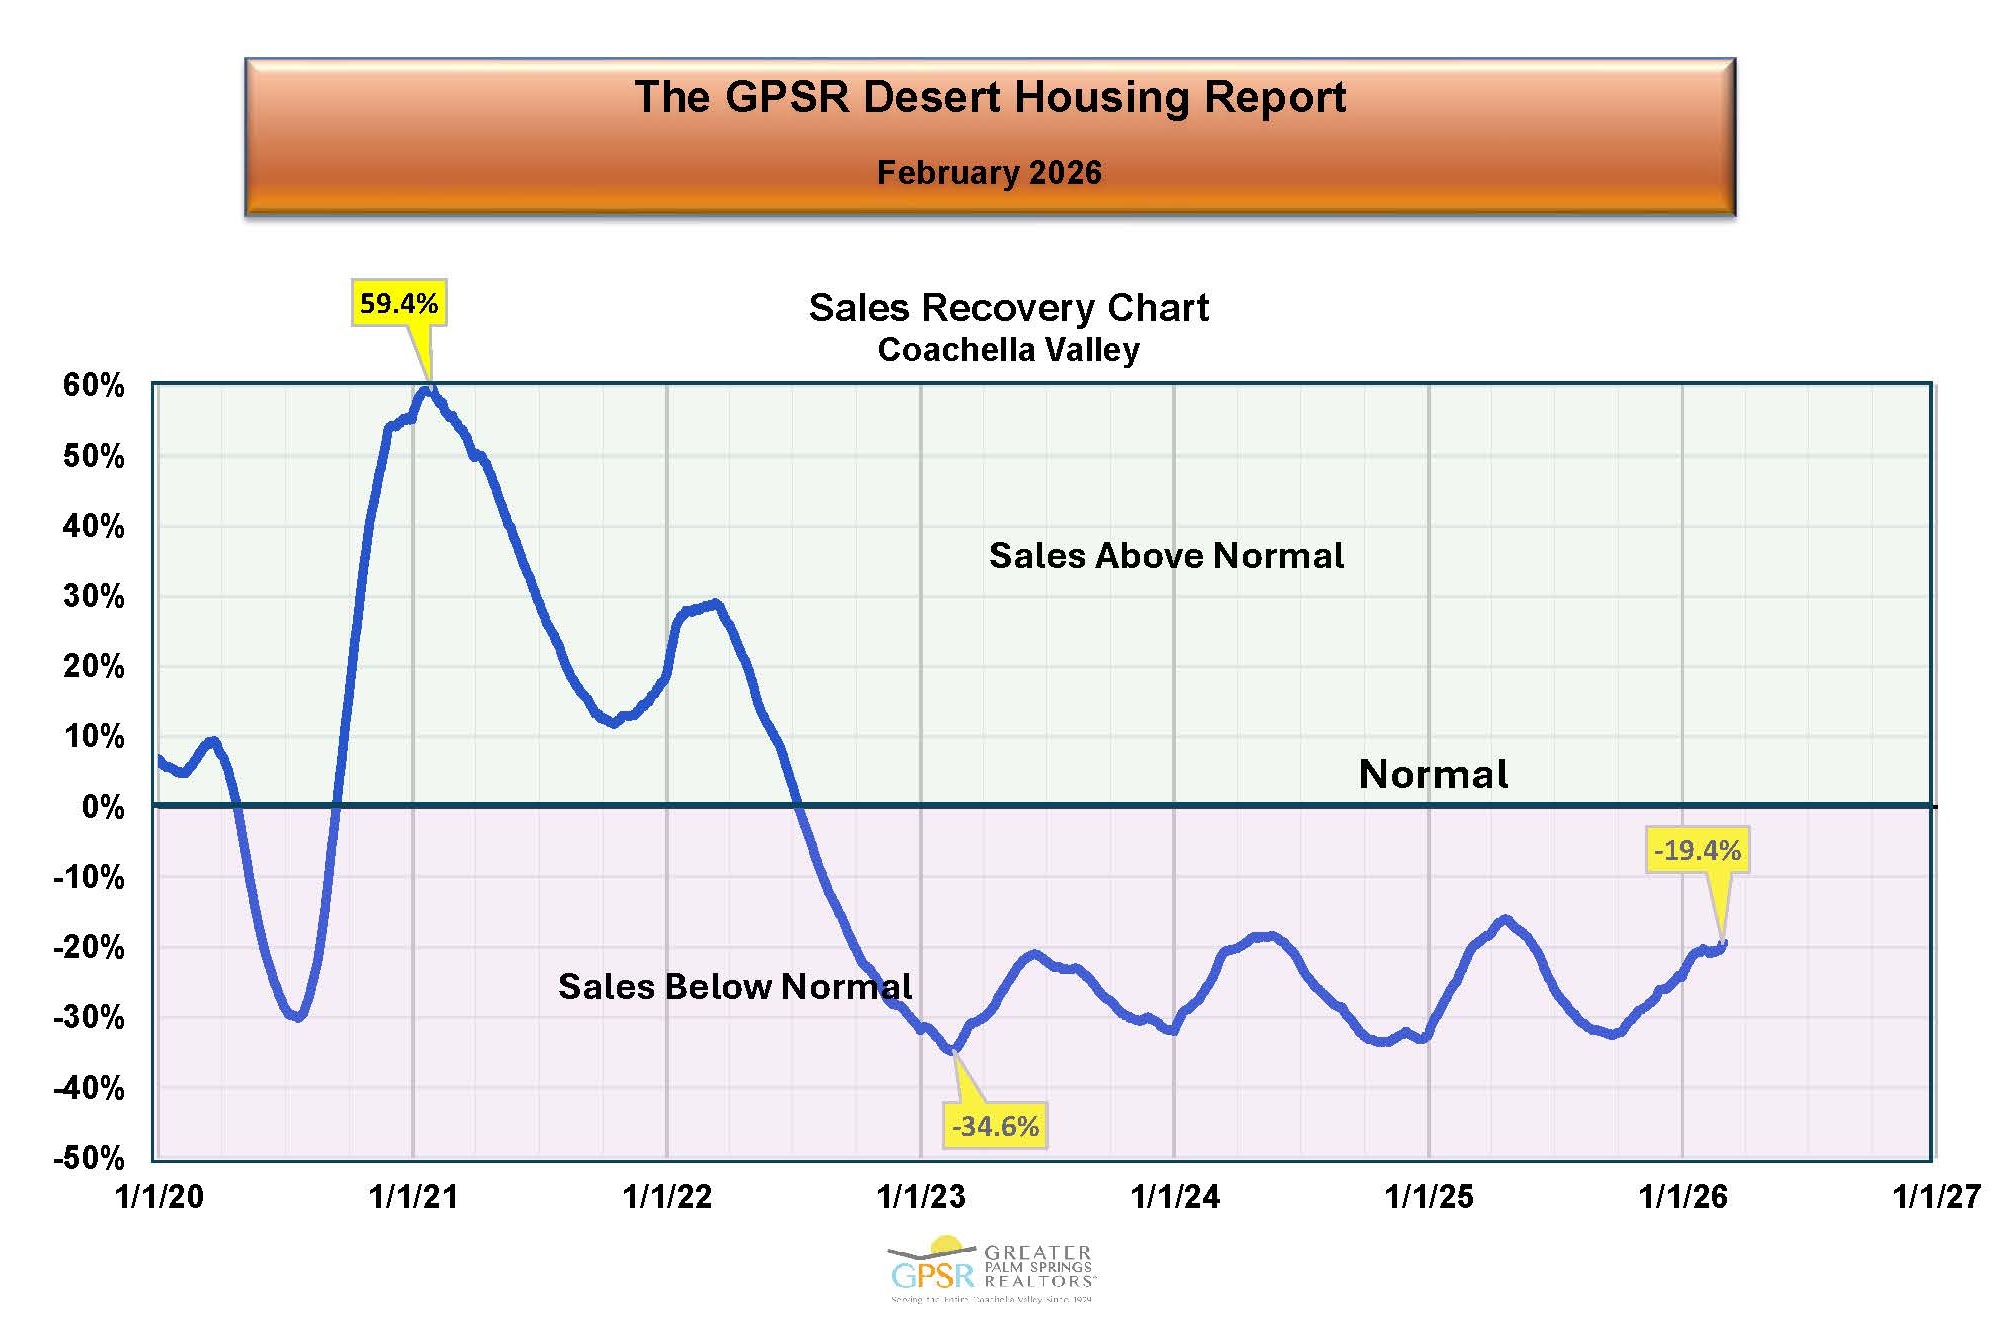 The seasonally adjusted sales recovery curve shows where current home sales stand as a percentage of historic norms (calculated from the pre-pandemic years 2016 through 2019). During the height of the pandemic in February 2021, Coachella Valley home sales were 59.4% above normal. In February, Coachella Valley home sales were 19.4% below average levels (compared to home sales 20.8% below normal in February 2025).
COACHELLA VALLEY FEBRUARY DETACHED HOME MEDIAN PRICE
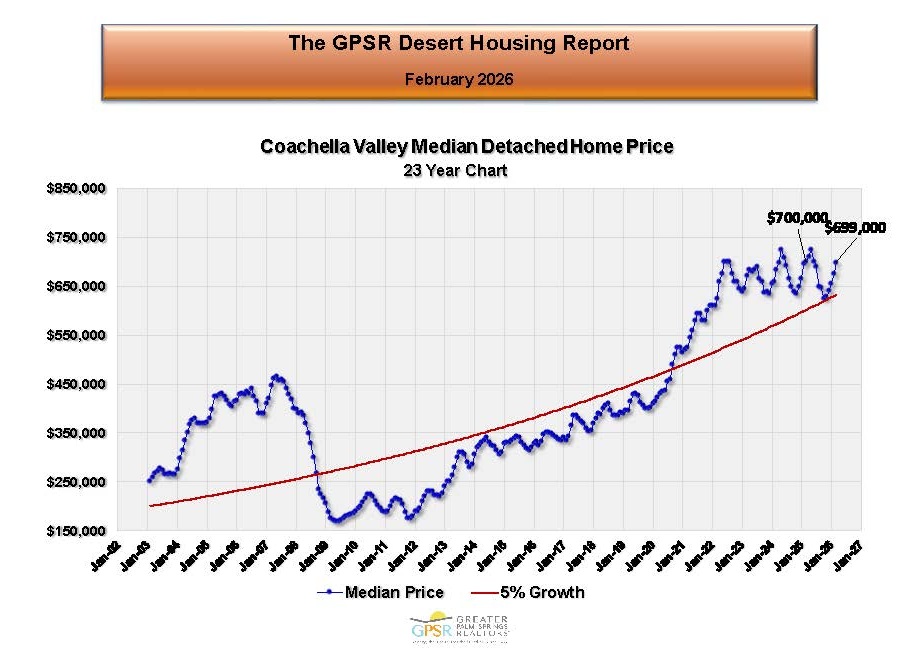 The Coachella Valley detached home median price in February was $699,000 (down 0.1% from $700,000 in February 2025). Market Watch noted that detached home prices typically reach seasonal lows in Autumn and seasonal highs in Spring. They also noted that detached homes in the Coachella Valley have generally maintained the increased prices observed during the pandemic.
COACHELLA VALLEY FEBRUARY ATTACHED HOME MEDIAN PRICE
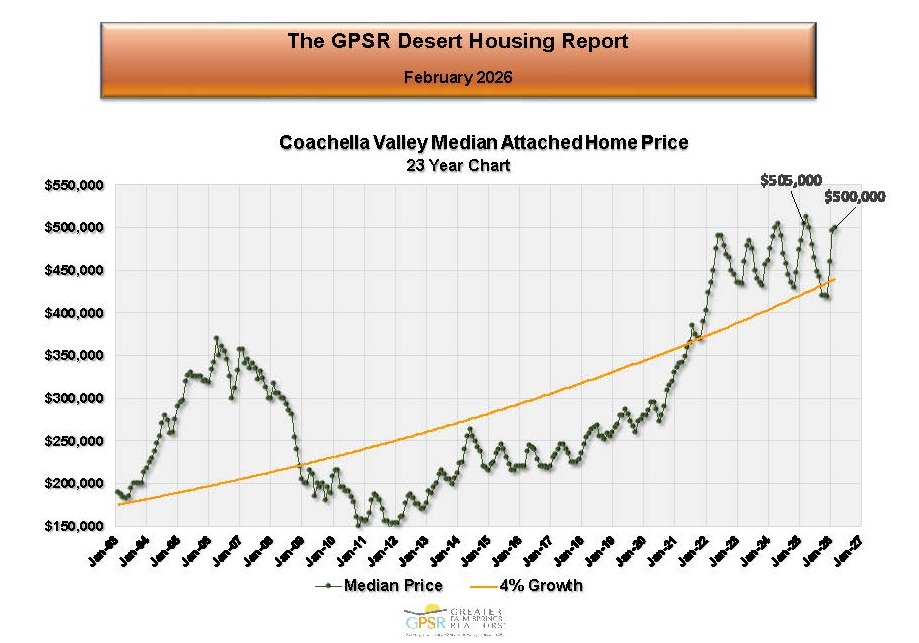 The Coachella Valley attached home median price in February was $500,000 (down 1.0% from $505,000 in February 2025). Market Watch noted that while attached home prices tend to fluctuate more than detached homes, they continue to follow a similar seasonal pattern to the price of detached homes.
COACHELLA VALLEY FEBRUARY ANNUAL CHANGE IN PRICE OF AVERAGE SIZE HOMES BY CITY
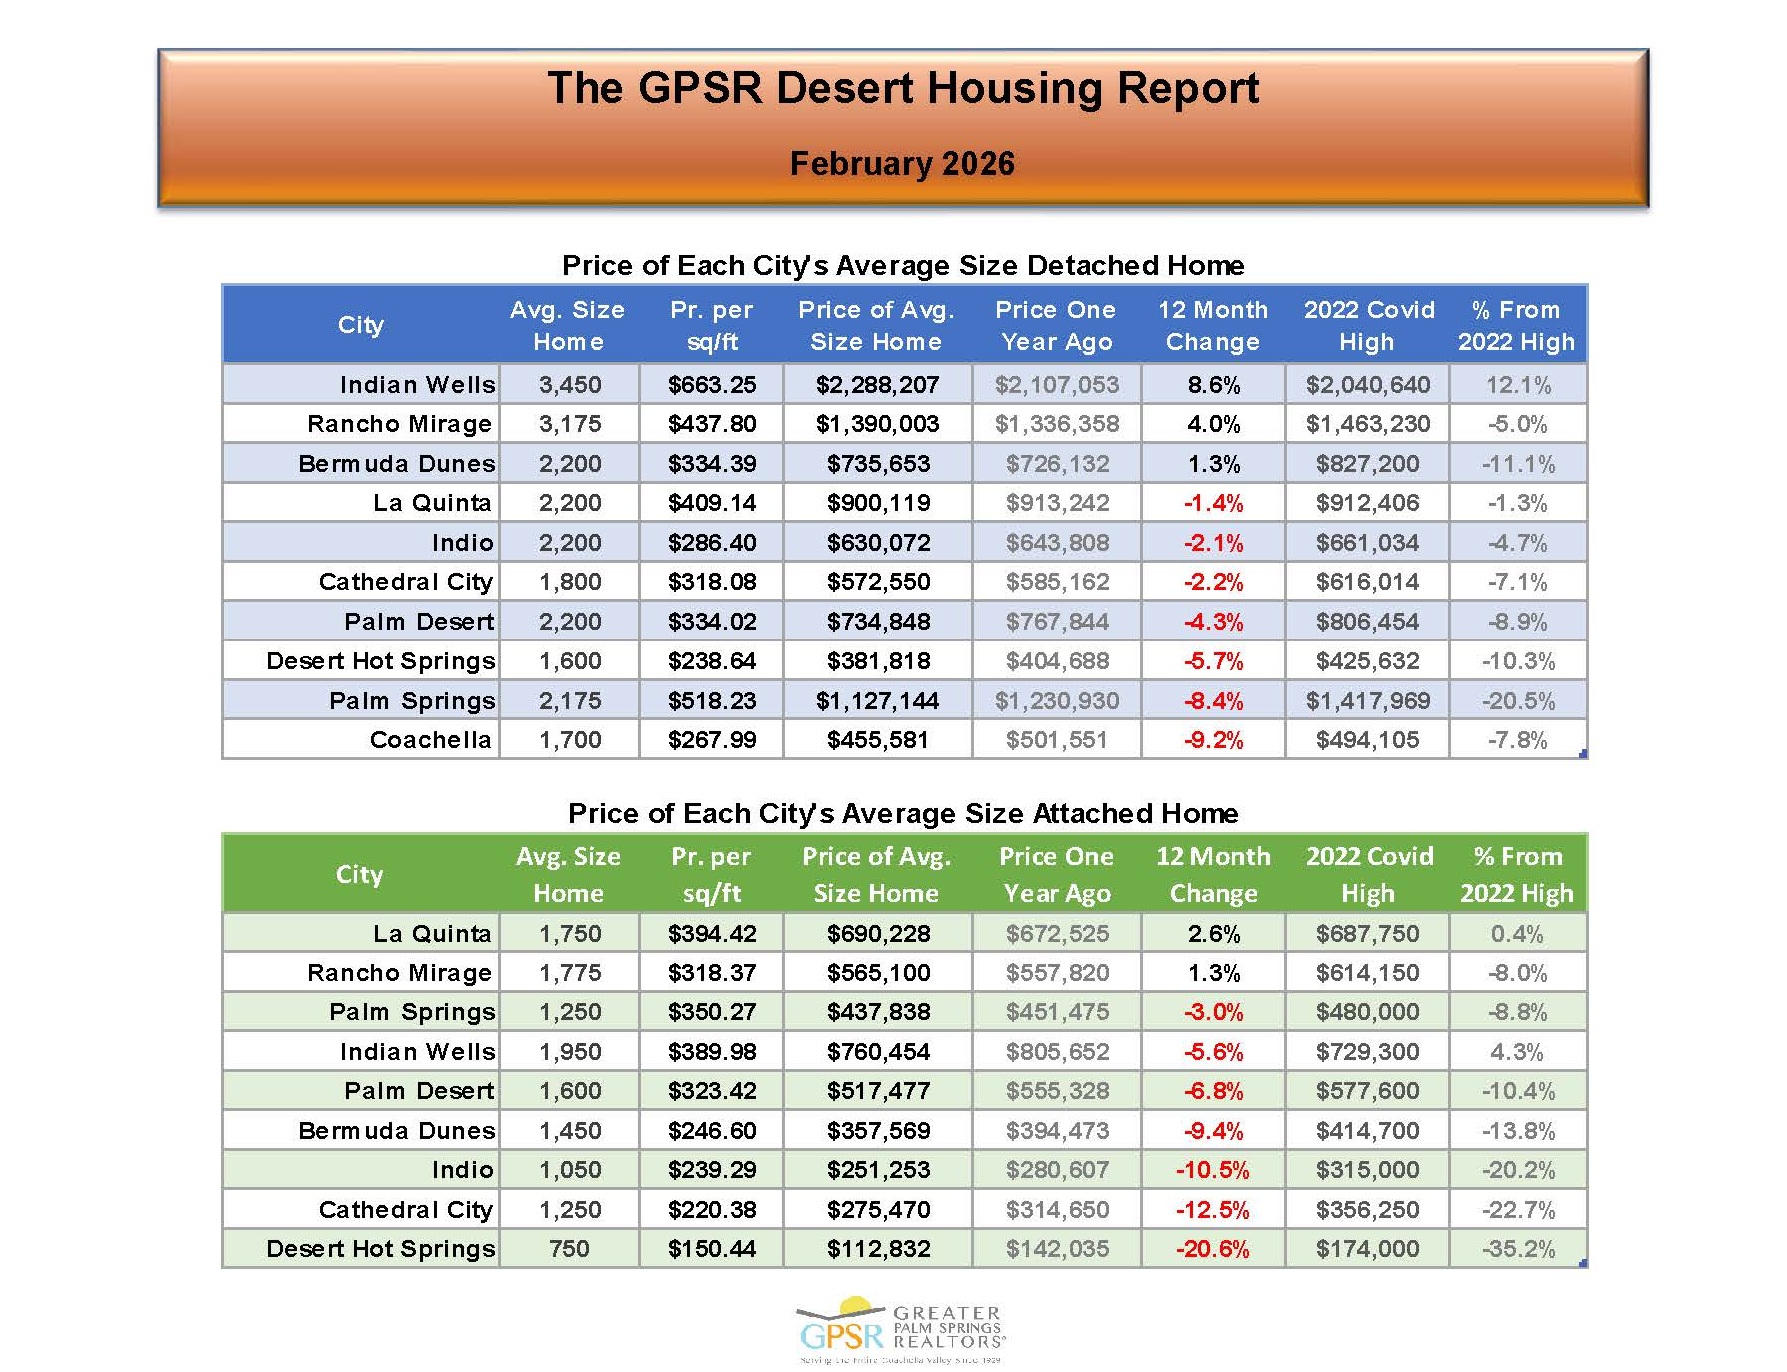 Annual price changes for average-size detached homes ranged from an increase of 8.6% for the 3,450 sq ft average size detached home in Indian Wells (up to a $2,288,207 median price from $2,040,640 in February 2025) to a decrease of 9.2% for the average size 1,700 sq ft detached home in Coachella (down to a median price of $455,581 from $494,105 in February 2025). For attached homes, price changes ranged from an increase of 2.6% for the average size 1,750 sq ft attached home in La Quinta (up to a median price of $690,2238 from $687,750 in February 2025) to a decrease of 20.6% for the average size 750 sq ft attached home in Desert Hot Springs (down to a median price of $112,832 from $174,000 in February 2025).
COACHELLA VALLEY FEBRUARY AVERAGE MONTHLY HOME SALES (THREE-MONTH AVERAGE)
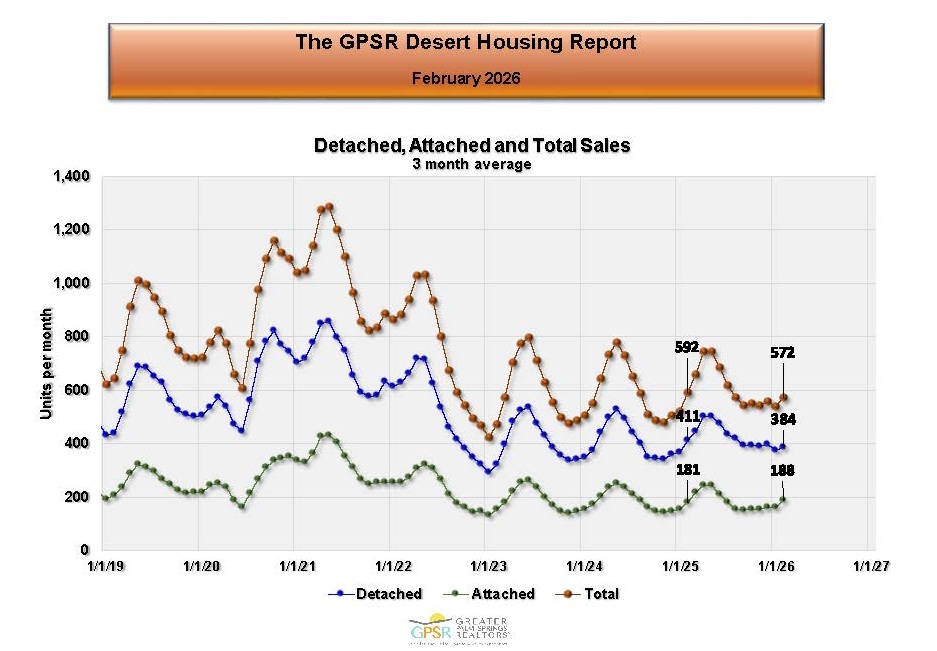 The Coachella Valley’s three-month average of home sales in February was 572 homes (down 3.4% from 592 homes in February 2025). Market Watch noted that because seasonal patterns in Coachella Valley home sales make it difficult to determine where home sales stand on a historic basis, the sales recovery data presented earlier was developed.
COACHELLA VALLEY FEBRUARY AVERAGE MONTHLY HOME SALES (TWELVE-MONTH AVERAGE)
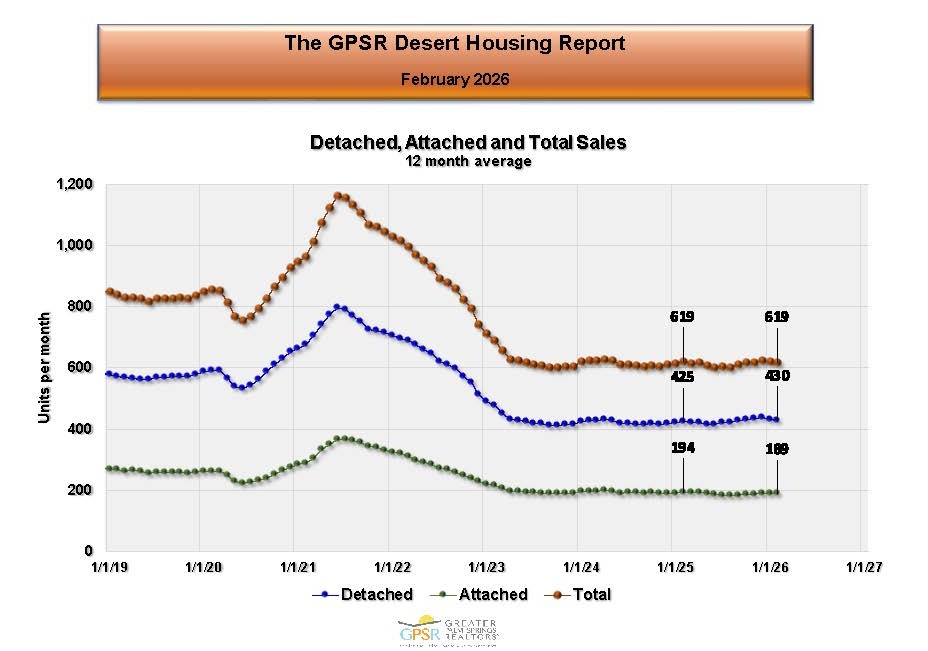 The twelve-month average of Coachella Valley home sales, which removes seasonal fluctuations, was 619 homes per month in February (the same as in February 2025). Market Watch noted that the housing market would benefit from lower mortgage rates. They added that although inflation remained low, the Federal Reserve Board had paused lowering short-term rates while evaluating the effects of the administration’s new economic policies.
COACHELLA VALLEY FEBRUARY AVERAGE MONTHLY HOME SALES BY CITY
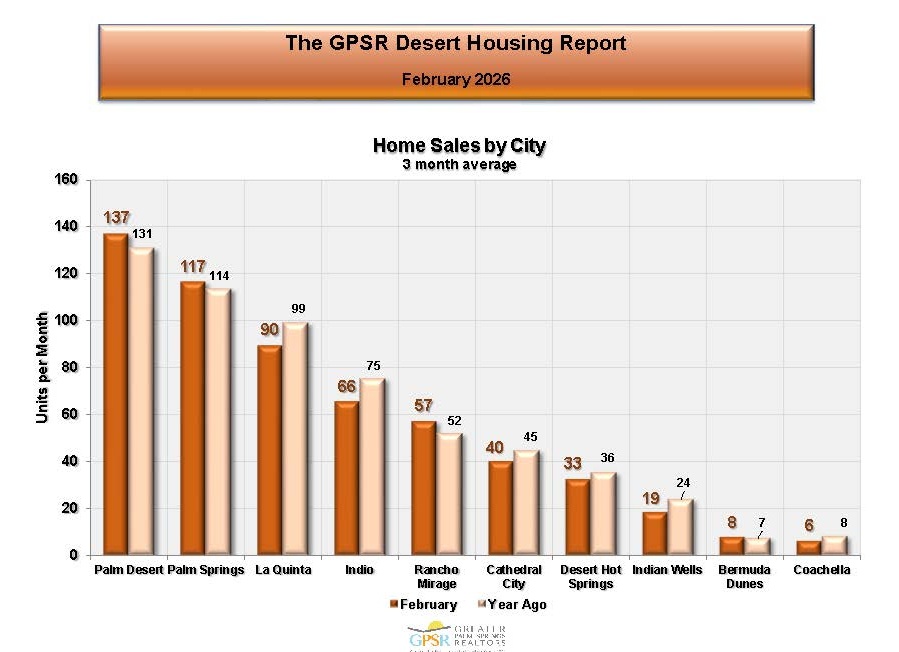 In February, Palm Desert had the highest average monthly home sales at 137 homes (up 4.6% from 131 home sales in February 2025), followed by Palm Springs with 117 home sales (up 2.6% from 114 homes sales in February 2025) and La Quinta with 90 home sales (down 9.1% from 99 home sales in February 2025). Coachella had the lowest average monthly home sales at 6 homes (down 25% from 8 homes in February 2025).
COACHELLA VALLEY FEBRUARY AVERAGE MONTHLY HOME SALES BY PRICE RANGE
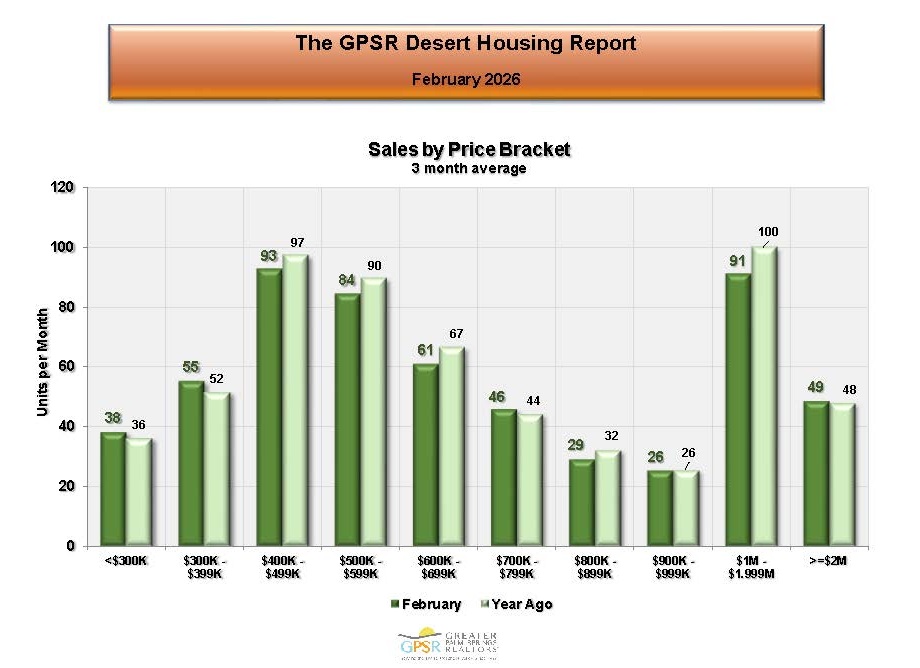 The highest monthly home sales in the Coachella Valley in February was for homes priced between $400 thousand and $499 thousand at 93 homes (down 4.1% from 97 home sales in February 2025) followed closely by sales for homes priced between $1 million and $1.999 million at 91 homes (down 9% from 100 home sales in February 2025)
COACHELLA VALLEY FEBRUARY AVERAGE MONTHLY HOME SALES IN DOLLARS
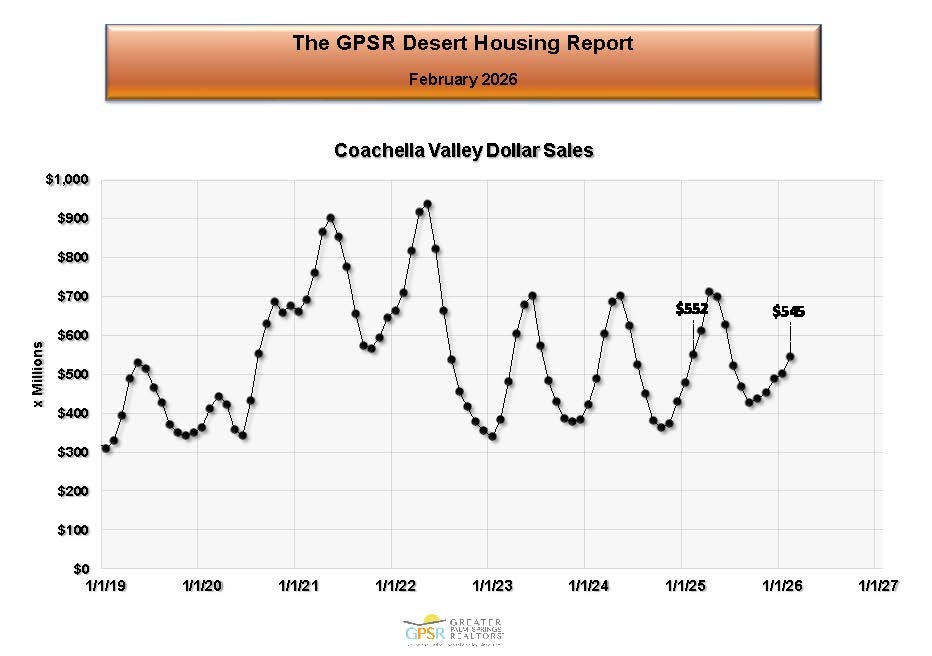 Average monthly Coachella Valley home sales in February totaled $545 million (down $7 million or 1.3% from $552 million in February 2025.
COACHELLA VALLEY FEBRUARY AVERAGE MONTHLY HOME SALES IN DOLLARS BY CITY
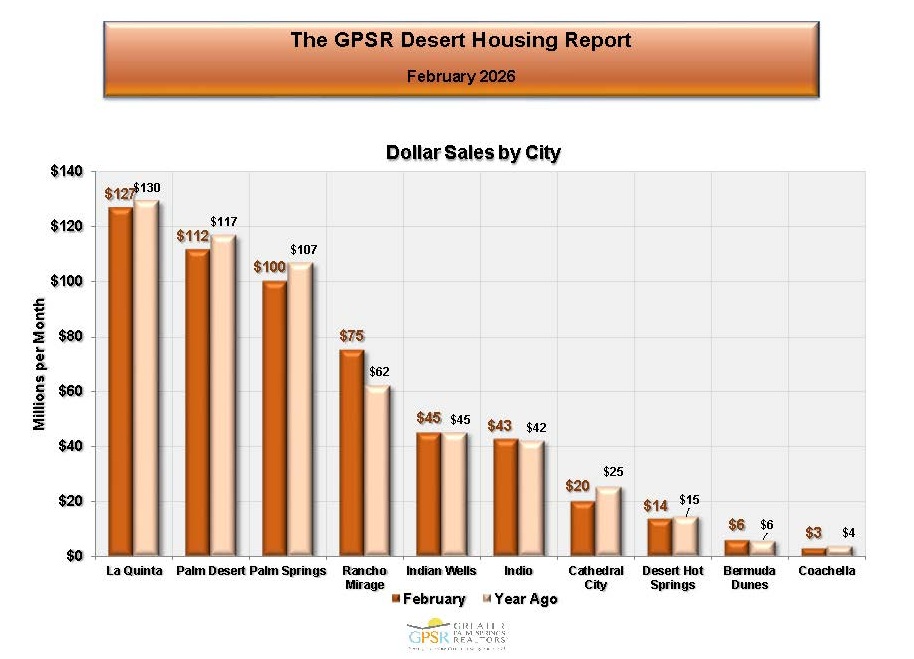 In February, La Quinta led the Coachella Valley with average monthly home sales of $127 million (down 2.3% from $130 million in February 2025), followed by Palm Desert with average monthly home sales of $112 million (down 4.3% from $117 million in February 2025) and Palm Springs with average monthly home sales of $100 million (down 6.5% from $107 million in February 2025). The lowest average monthly home sales were in Coachella at $3 million (down 25% from $4 million in February 2025).
COACHELLA VALLEY FEBRUARY AVERAGE MONTHLY HOME SALES IN DOLLARS BY PRICE RANGE
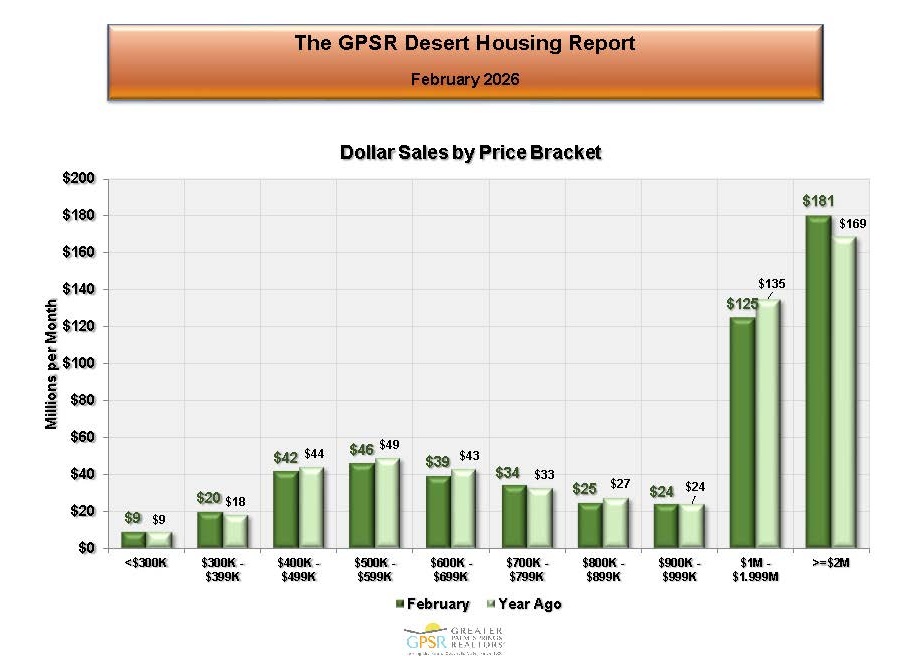 Market Watch noted that home sales in dollars by price range showed a different pattern than number of home sales by price range. The highest average monthly home sales were for homes priced over $2 million at $181 million (up 7.1% from $169 million in February 2025), followed by home sales for homes priced between $1 million and $1.999 million at $125 million (down 6.4% from $135 million in February 2025). Market Watch noted that homes priced above $1 million accounted for 56.1% of total Coachella Valley home dollar sales in February.
COACHELLA VALLEY MARCH 1ST TOTAL HOUSING INVENTORY
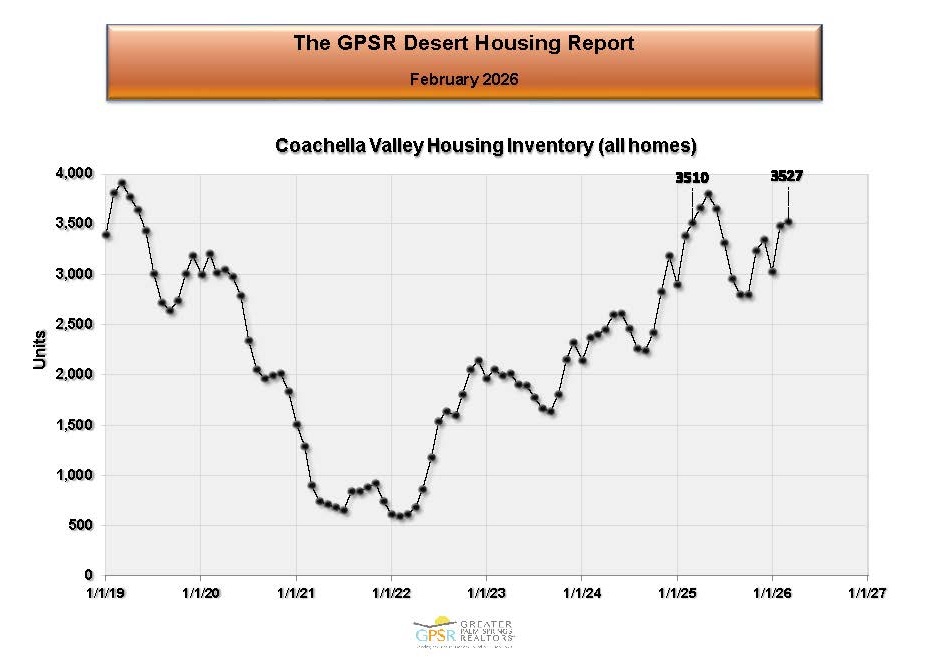 On March 1st, total housing inventory in the Coachella Valley stood at 3,527 homes (up 0.5% from 3,510 homes on March 1st 2025). Market Watch made two observations: 1. inventory levels continued improving and were comparable to pre-pandemic levels, and 2. the seasonal Coachella Valley inventory pattern typically peaks early in the year and declines toward late Summer.
COACHELLA VALLEY MARCH 1ST INVENTORY BY CITY
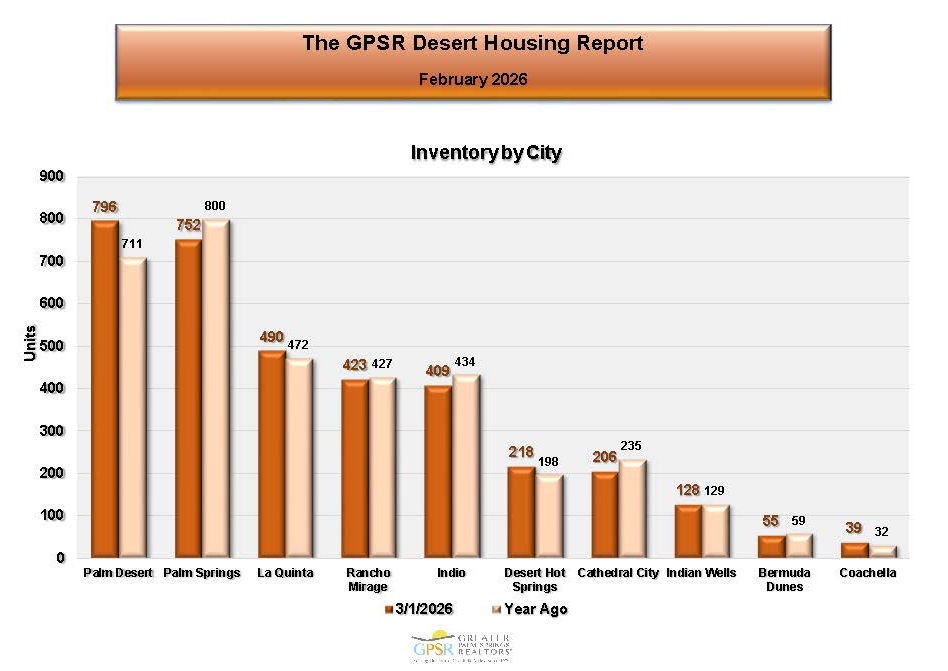 On March 1st, Palm Desert had the largest housing inventory with 796 homes for sale (up 12% from 711 homes for sale on March 1st, 2025), followed by Palm Springs with 752 homes for sale (down 6% from 800 homes for sale on March 1st, 2025). The smallest housing inventory on March 1st was in Coachella with 39 homes for sale (up 21.9% from 32 homes for sale on March 1st, 2025). Market Watch commented that this information could help identify which cities currently have the greatest number of homes available and the strongest selling interest.
COACHELLA VALLEY MARCH 1ST INVENTORY BY PRICE RANGE
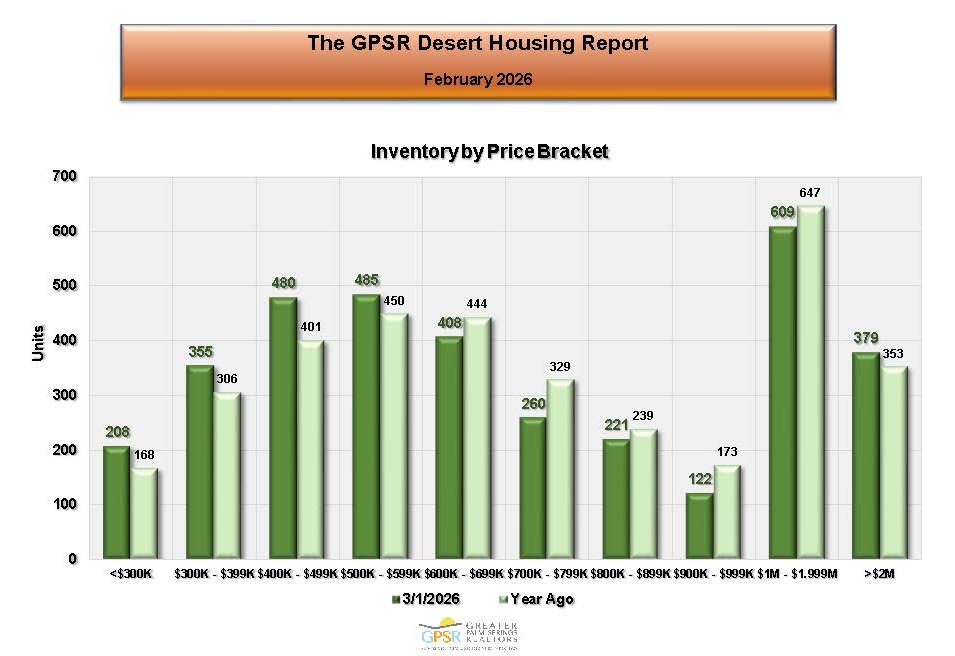 The largest housing inventory on March 1st was for homes priced between $1 million and $1.999 million at 609 homes for sale (down 5.9% from 647 homes for sale on March 1st, 2025). The smallest housing inventory was for homes priced between $900 thousand and $999 thousand at 122 homes for sale (down 29.5% from 173 homes for sale on March 1st 2025). Market Watch noted that this information could help identify which price segments were contributing to changes in overall inventory levels.
COACHELLA VALLEY MARCH 1ST MONTHS-OF-SALES RATIO
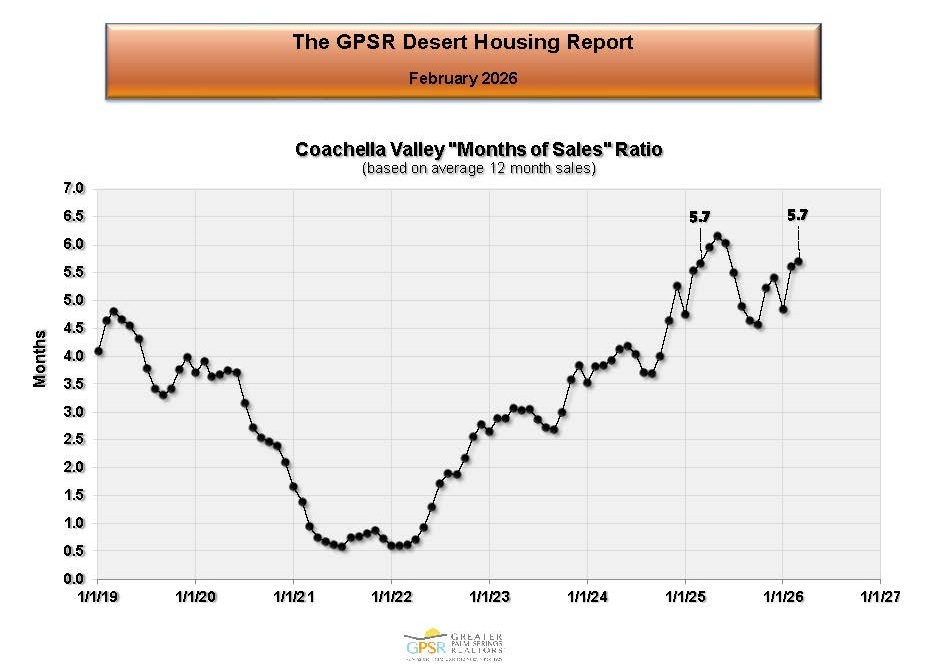 On March 1st, the Coachella Valley’s months-of-sales ratio was 5.7 months (unchanged from 5.7 months on March 1st, 2025). Market Watch stated that this key indicator measures the balance between supply and demand. So while inventory has recovered, lower sales activity meant that supply was beginning to exceed demand (although this had not yet significantly impacted home prices).
COACHELLA VALLEY MARCH 1ST MONTHS-OF-SALES RATIO BY CITY
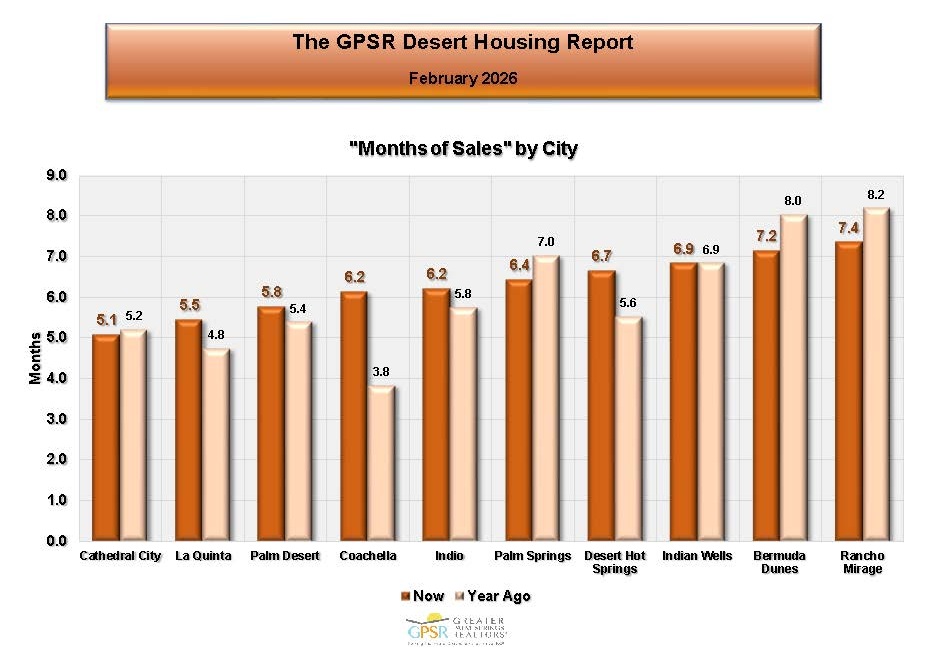 On March 1st, months-of-sales ratios in most Coachella Valley cities ranged between 5.0 and 7.0 months. Rancho Mirage had the highest months-of sales ratio at 7.4 months (but down from 8.2 months on March 1st, 2025), while Cathedral City had the lowest months-of-sales ratio at 5.1 months (down slightly from 5.2 months on March 1st, 2025). Market Watch felt that these figures indicated a housing market that was gradually becoming more supply-heavy.
COACHELLA VALLEY MARCH 1ST MONTHS OF SALES RATIO BY PRICE RANGE
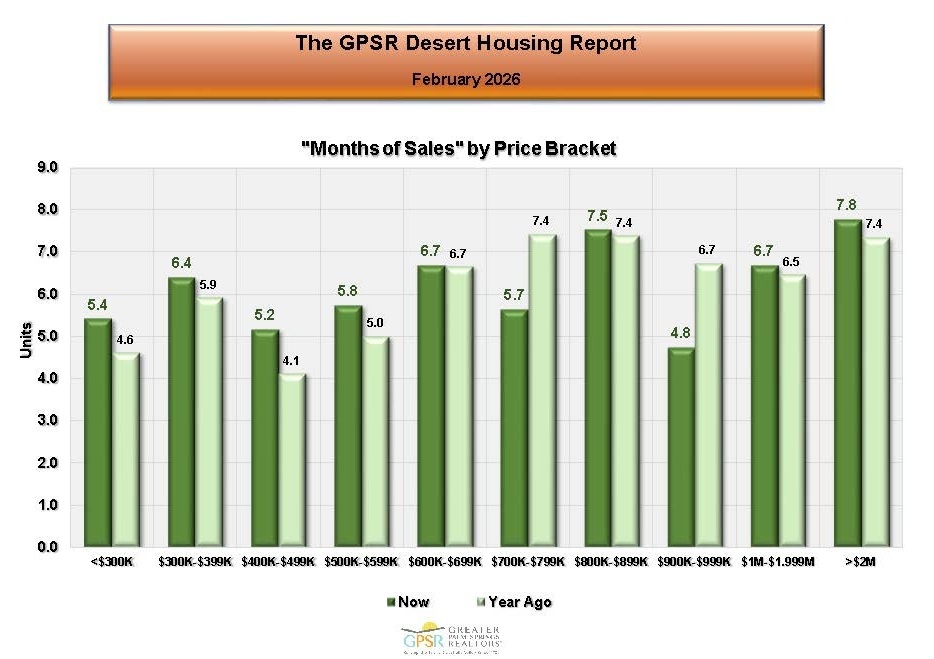 On March 1st, the highest months-of-sales ratio was 7.8 months for homes priced over $2 million (up from 7.4 months on March 1st, 2025). The lowest months-of-sales ratio was 4.8 months for homes priced between $900 thousand to $999 thousand (down from 6.7 months on March 1st, 2025). Market Watch commented that the Coachella Valley months-of-sales ratios by price range showed that supply was beginning to exceed demand across most price ranges. While this increase had not yet affected home prices, it could begin to influence the market if selling times continued to increase.
COACHELLA VALLEY FEBRUARY DAYS IN THE MARKET
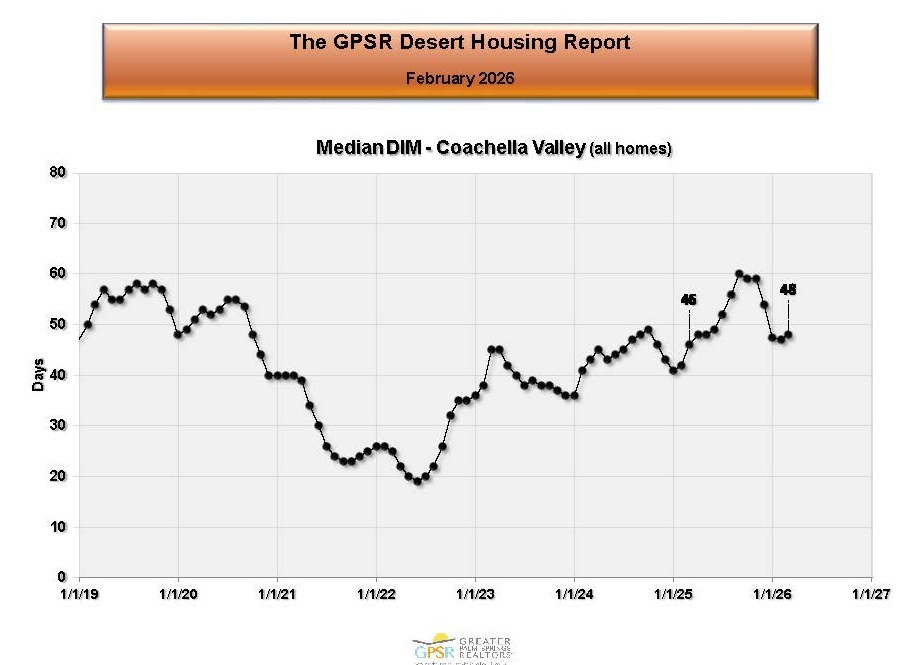 At the end of February, the median number of days on market for homes in the Coachella Valley was 48 days (up 2 days from 46 days in February 2025). Market Watch noted that selling times in the Coachella Valley have remained relatively stable between 40 and 55 days for more than two years.
COACHELLA VALLEY FEBRUARY DAYS IN THE MARKET BY CITY
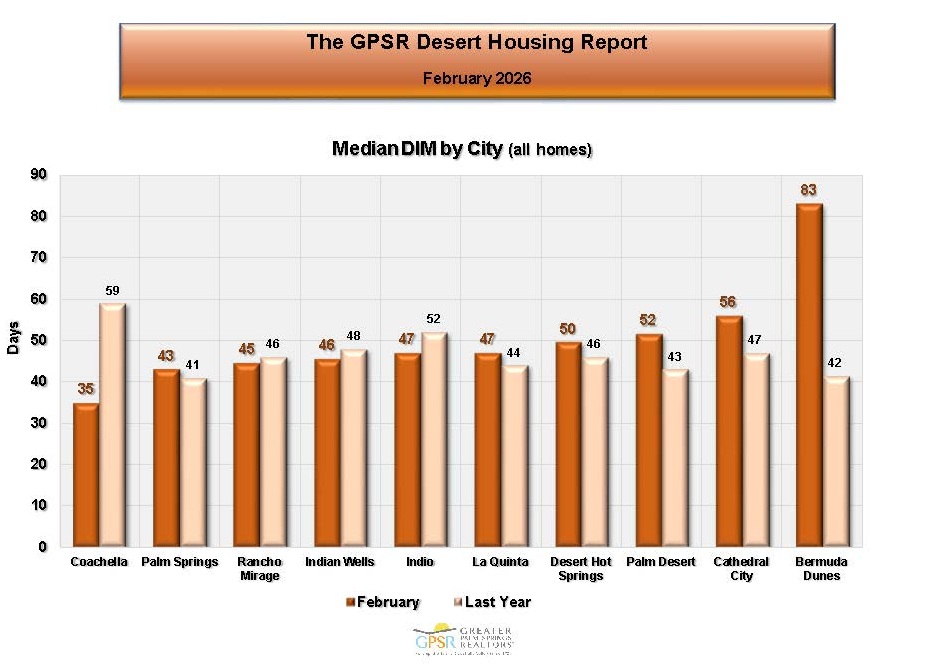 In February, Coachella had the fastest average selling time at 35 days (down from 59 days in February 2025), followed by Palm Springs at 43 days (up from 41 days in February 2025). Bermuda Dunes had the longest median selling time at 83 days (up from 42 days in February 2025).
COACHELLA VALLEY FEBRUARY DAYS IN THE MARKET BY PRICE RANGE
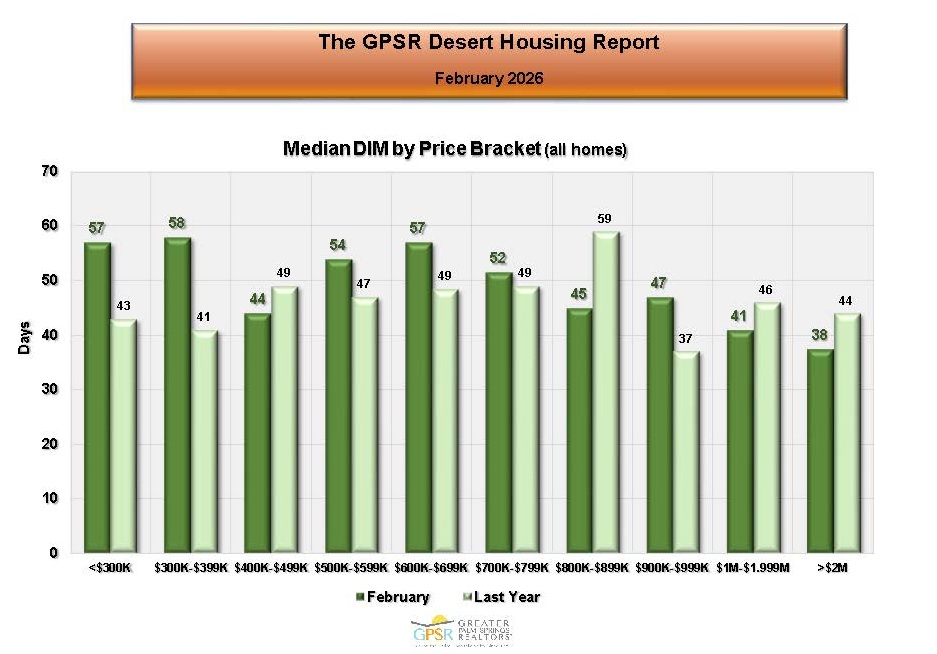 In February, the fastest average selling time was 38 days for homes priced over $2 million (down from 44 days in February 2025). The longest median selling time was 58 days for homes priced between $300 thousand and $399 thousand (up from 41 days in February 2025). Market Watch stated that while higher-priced homes typically take longer to sell, current Coachella Valley market conditions showed no abnormal increases in selling time for higher price brackets, which they felt was a positive sign for our market.
COACHELLA VALLEY FEBRUARY AVERAGE SELLING PREMIUM/DISCOUNT FROM LIST PRICE
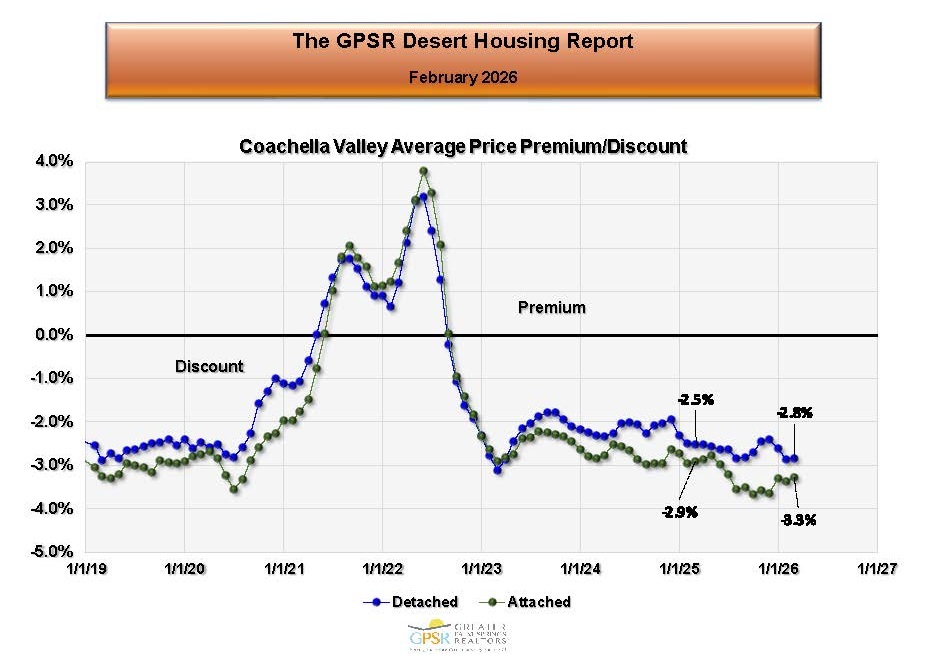 In February, detached homes in the Coachella Valley sold at an average discount of 2.8% from list price (compared to an average discount of 2.5% in February 2025). Attached homes sold at an average discount of 3.3% (compared to an average discount of 2.9% in February 2025). Market Watch noted that these figures have returned to pre-pandemic norms.
COACHELLA VALLEY FEBRUARY AVERAGE SELLING PREMIUM/DISCOUNT FROM LIST PRICE BY CITY
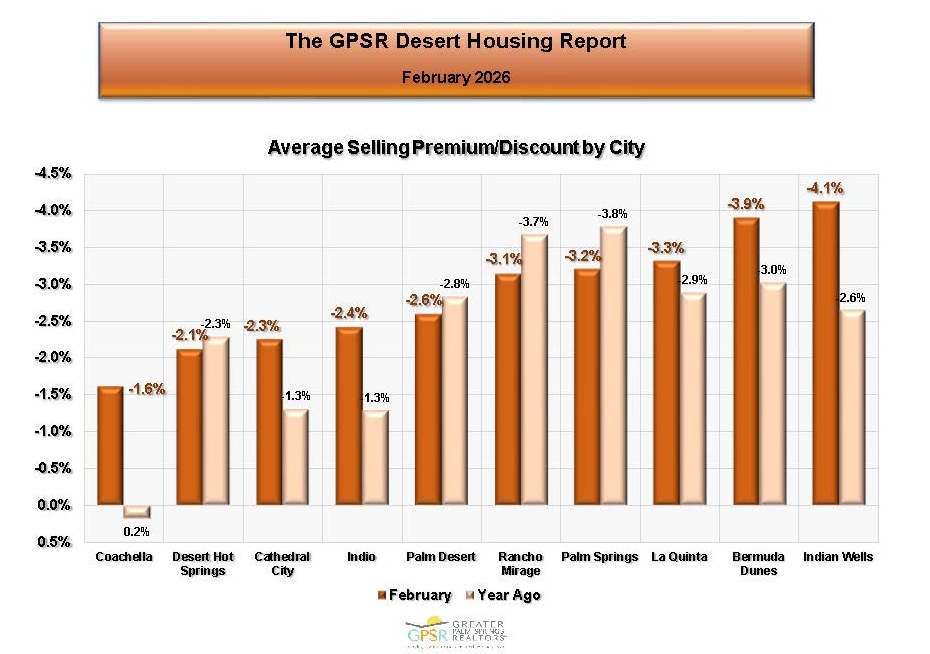 In February, Coachella had the smallest average discount from list price of 1.6% (compared to a premium of 0.2% in February 2025). Indian Wells had the largest average discount from list price of 4.1% (compared to an average discount of 2.6% in February 2025). Market Watch noted that cities with higher-priced homes typically experience larger average selling discounts.
COACHELLA VALLEY FEBRUARY AVERAGE SELLING PREMIUM/DISCOUNT FROM LIST PRICE BY PRICE RANGE
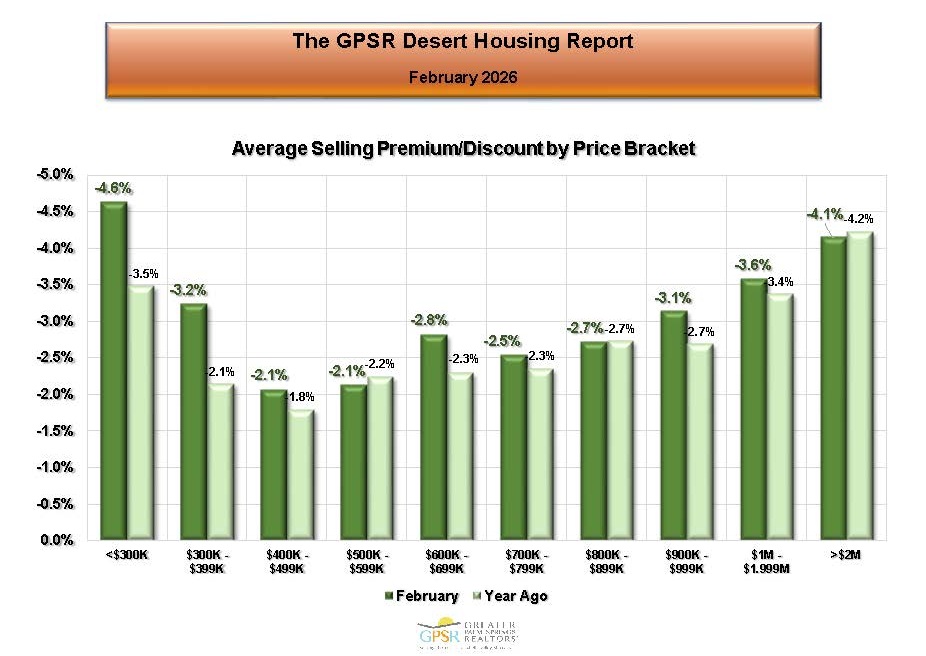 In February, the highest average discount from list price was 4.6% for homes priced under $300 thousand (up from an average discount from list price of 3.5% in February 2025). The lowest average discount from list price was 2.1% for both homes priced between $400 thousand to $499 thousand (up from an average discount from list price of 1.8% in February 2025) and homes priced between $500 thousand and $599 thousand (down slightly from an average discount from list price of 2.2% in February 2025). Market Watch noted that discounts from list price generally increase with higher home prices. However, in the current Coachella Valley market the lowest discounts were seen in the mid-range price ranges.
COACHELLA VALLEY FEBRUARY PERCENTAGE OF HOMES SELLING OVER LIST PRICE
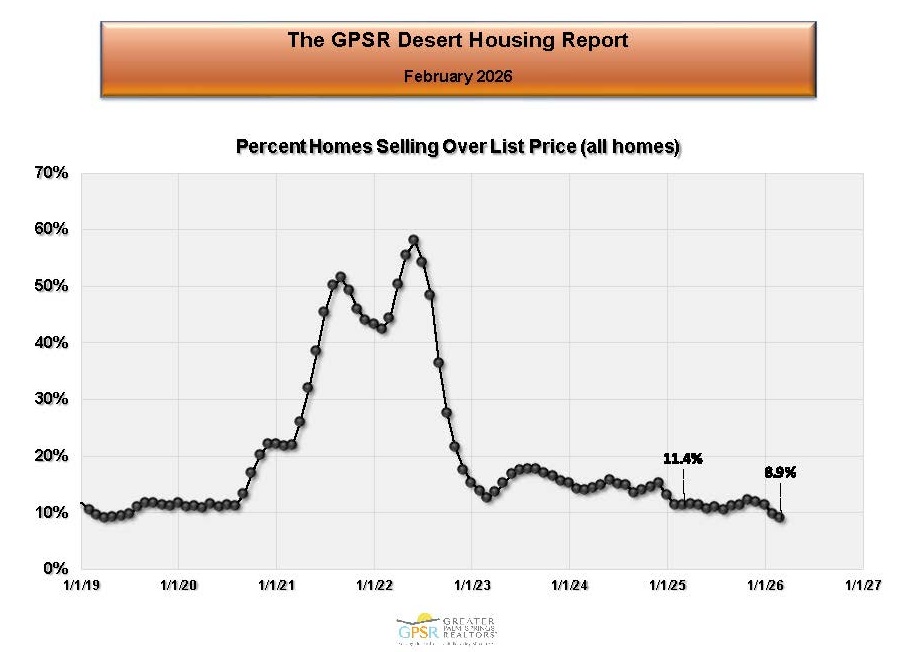 In February, 8.9% of homes sold in the Coachella Valley sold above list price (compared with 11.4% a year ago). Market Watch noted that the percentage of homes selling above list price had now returned to pre-pandemic levels.
THE BRIGGS GROUP | COLDWELL BANKER | Laurie Briggs - DRE# 01896117 | Tim Briggs - DRE# 01898254 | Coldwell Banker Realty - DRE# 00616212