Our local real estate market experts at Market Watch LLC have just released their January 2025 Desert Housing Report. Some highlights:
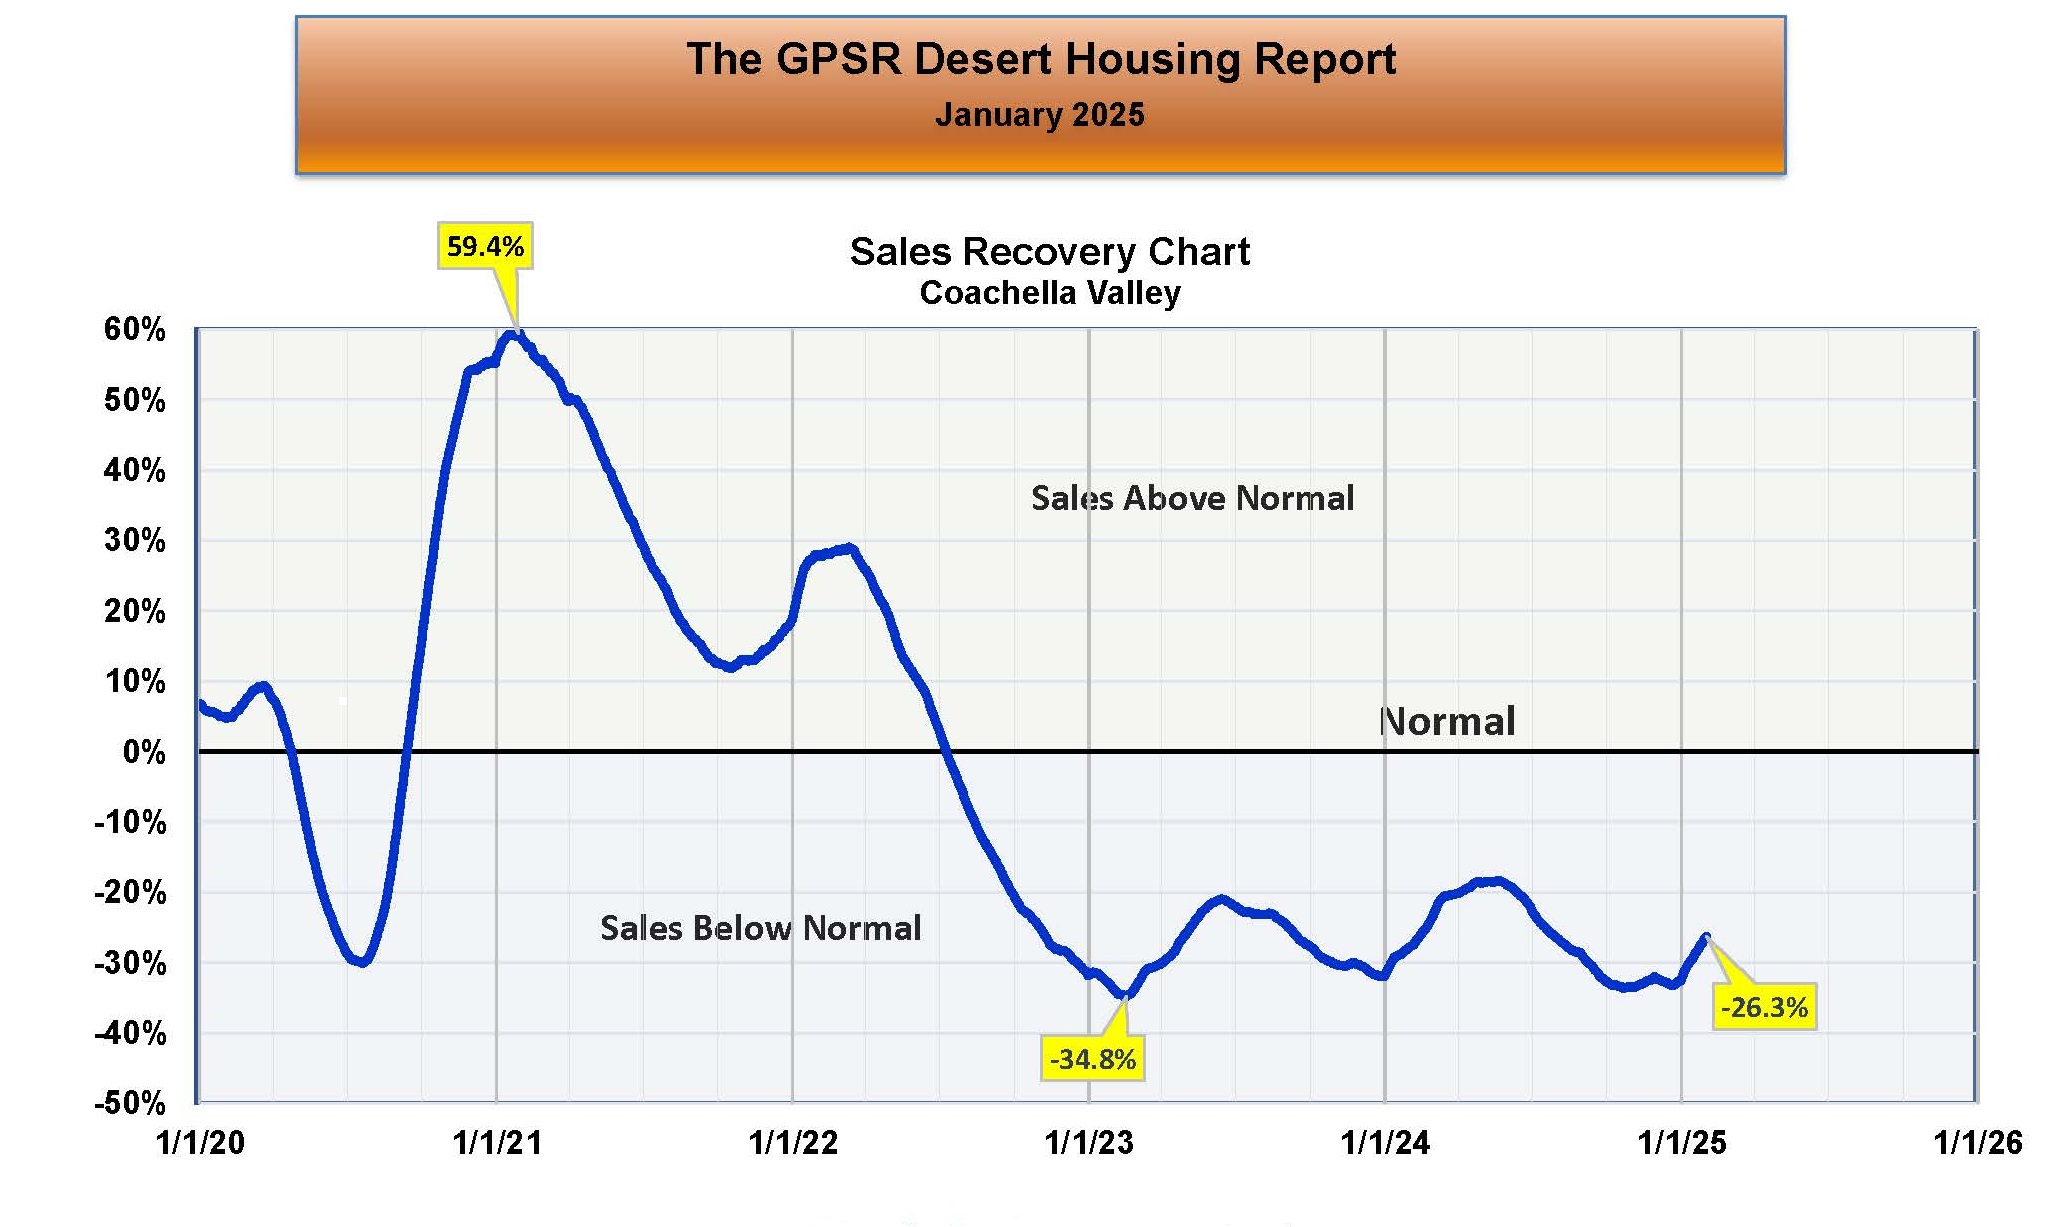 COACHELLA VALLEY JANUARY SALES RECOVERY: Home sales improved in the Coachella Valley in January and were 26.3% below normal (where normal is the average number of home sales in the Coachella Valley in January during the pre-pandemic years 2016, 2017, 2018 and 2018). Home sales in January 2024 were 34.8% below normal and home sales in December 2024 were 32.9% below normal.
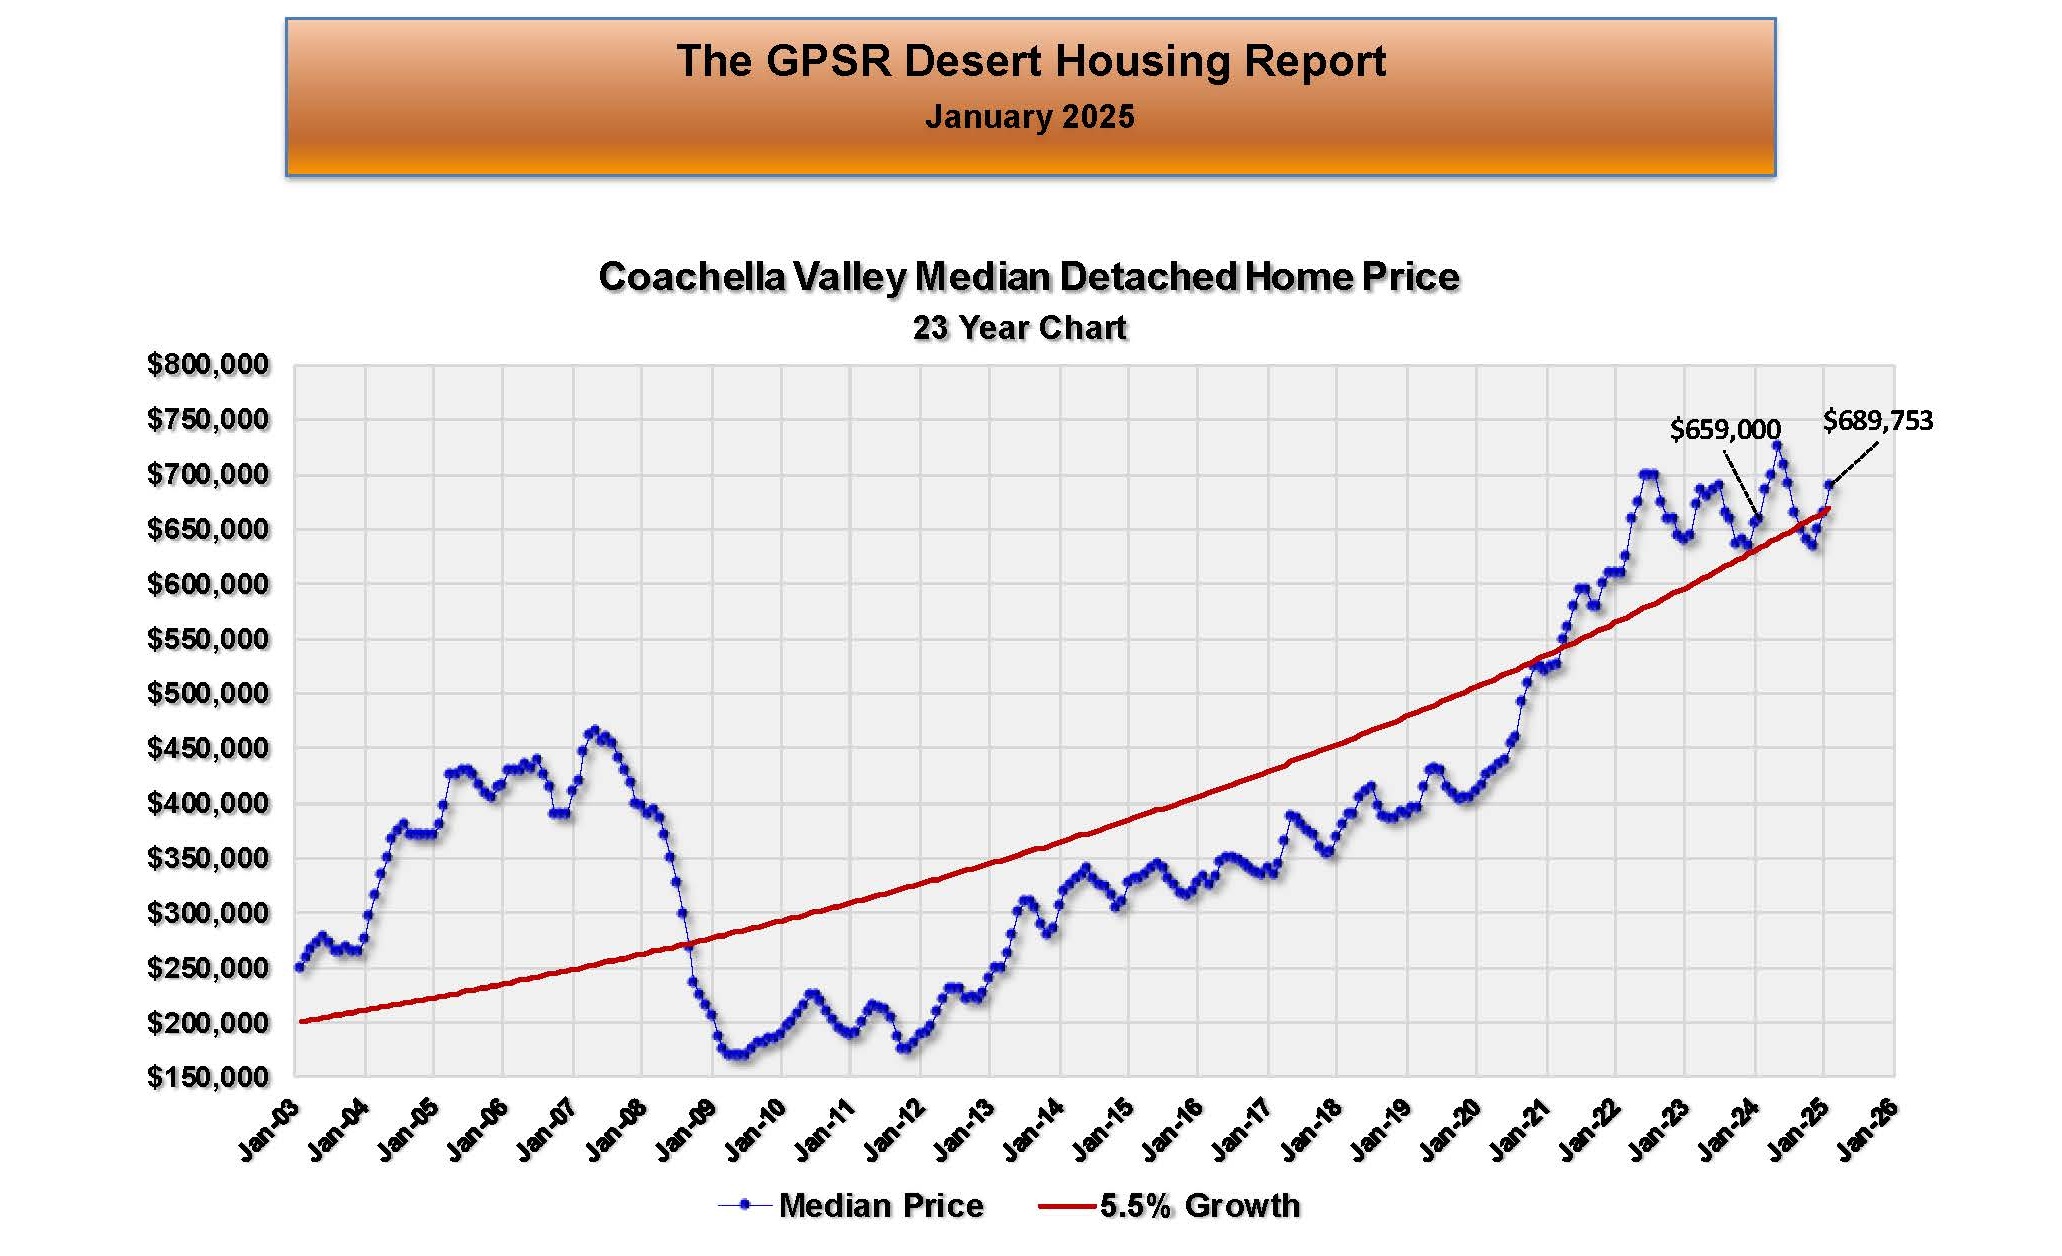 COACHELLA VALLEY JANUARY DETACHED HOME MEDIAN PRICE: In January, the median price of a detached home in the Coachella Valley increased for the third consecutive month to $689,753 (up $30,753 or 4.7% from $659,000 in January 2024 and up $24,753 or 3.7% from $665,000 in December). Market Watch noted that the detached home median price usually hits its seasonal low between September and December, and that trend appeared to be true again this year.
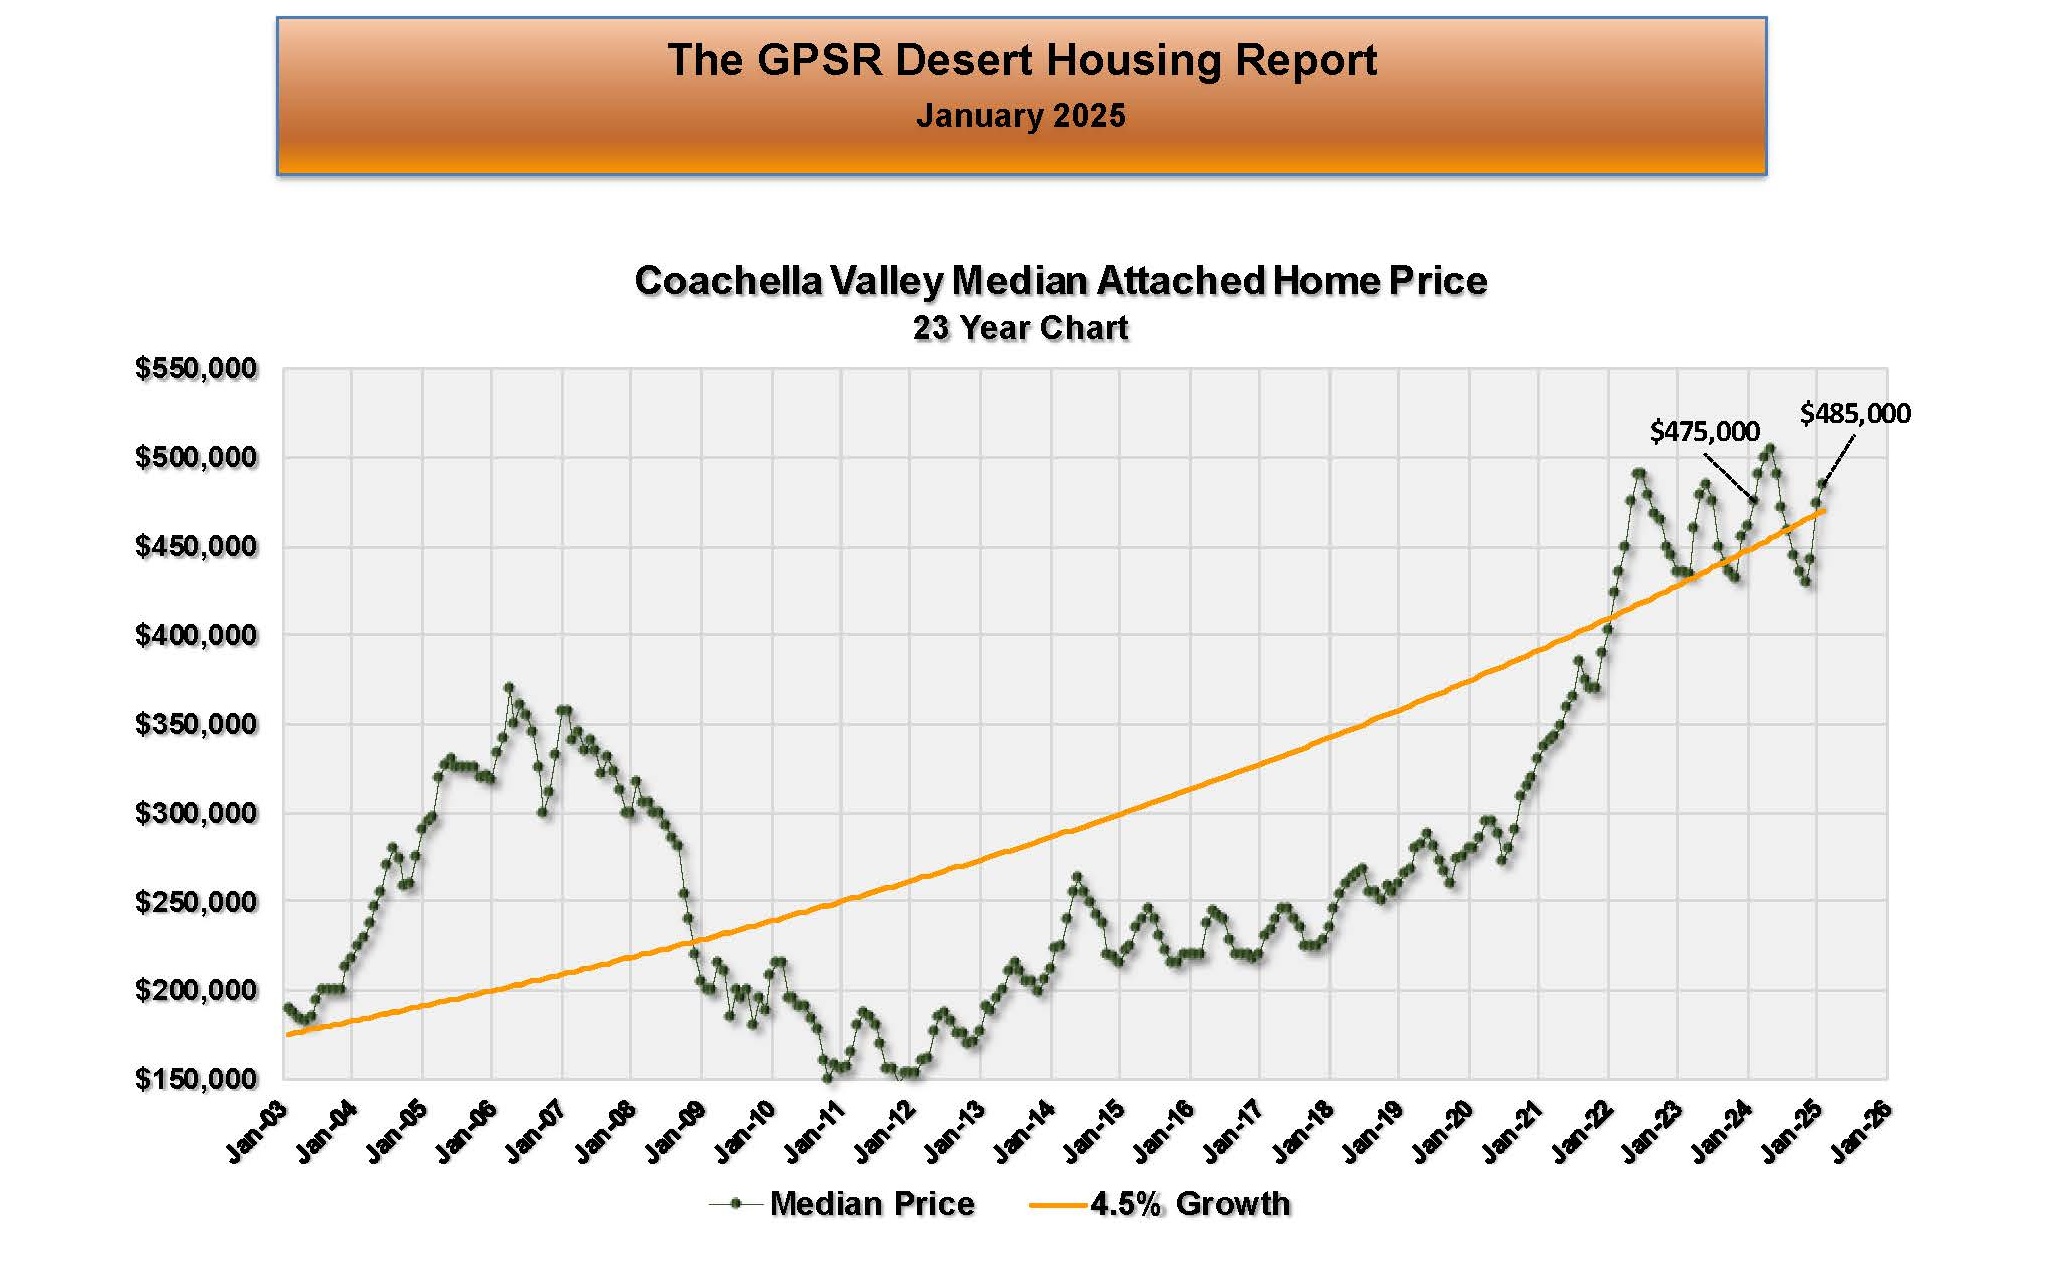 COACHELLA VALLEY JANUARY ATTACHED HOME MEDIAN PRICE: In January, the median price of am attached home in the Coachella Valley was $485,000 (up $10,000 or 2.1% from $475,000 in January 2024 and up $10,500 or 2.2% from $474,500 in December). Market Watch noted that the seasonal variation in price for attached homes was much larger than for detached homes. They also felt that the attached home median price seemed to be following the normal seasonal pattern.
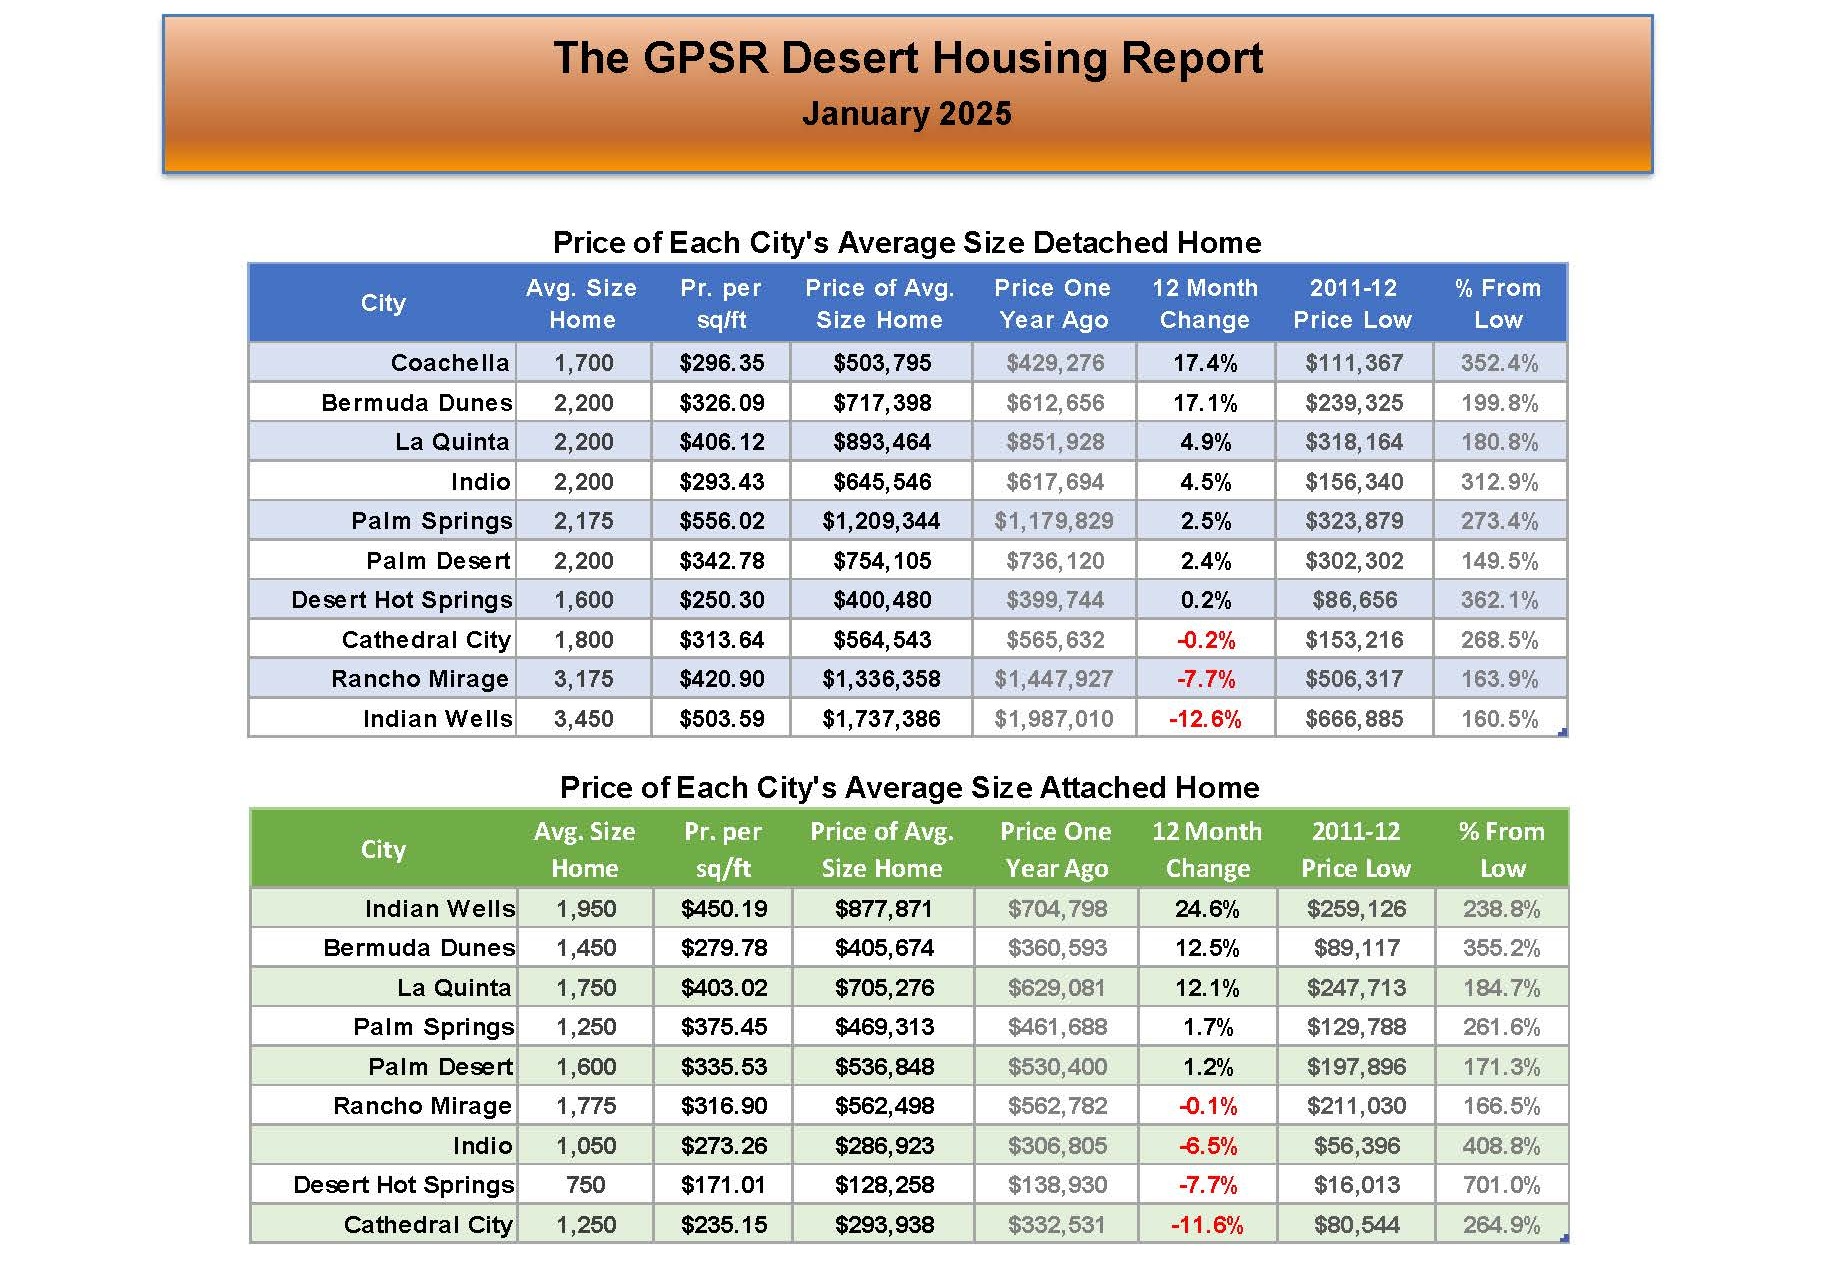 COACHELLA VALLEY JANUARY PRICE CHANGE FOR THE AVERAGE SIZE HOME BY CITY: Year -over-year price changes for detached homes in the Coachella Valley in January ranged from an increase of 17.4% for the average size 1,700 sq ft detached home in Coachella to a decrease of 12.6% for the average size 3,450 sq ft detached home in Indian Wells. Year-over-year price changes for attached homes in the Coachella Valley in January ranged from an increase of 24.6% for the average size 1,950 sq ft attached home in Indian Wells to a decrease of 11.6% for the average size 1,250 sq ft home in Cathedral City.
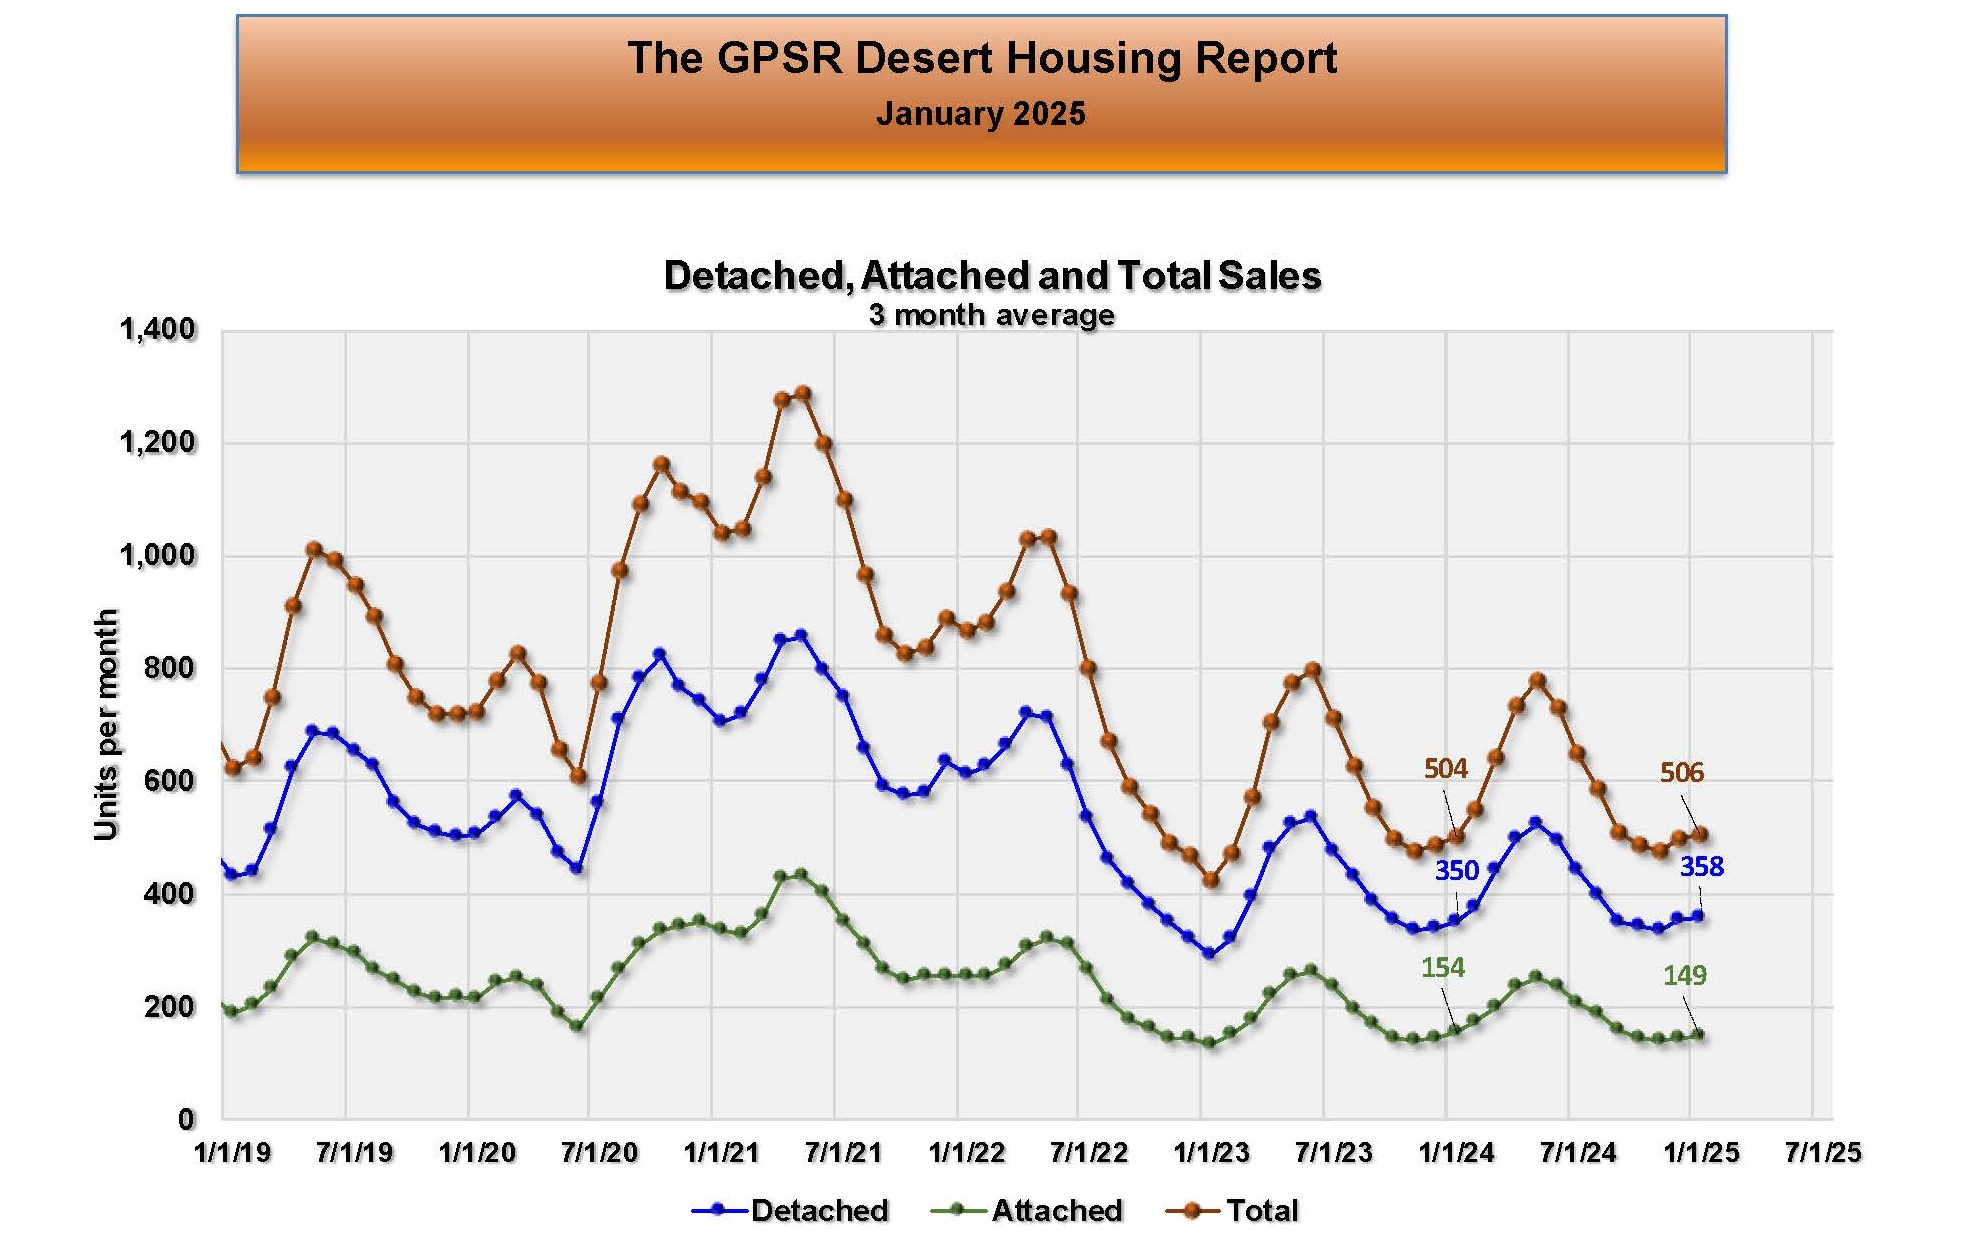 COACHELLA VALLEY JANUARY MONTHLY HOME SALES (THREE-MONTH AVERAGE): The three-month average of home sales in the Coachella Valley in January was 506 homes (roughly unchanged from 504 home sales in January 2024 and up 13 home sales or 2.6% from 493 home sales in December). Market Watch pointed out that because of the seasonality in the Coachella Valley’s home sales data, it was difficult to determine where sales stood on a historical basis. The Sales Recover data showed that in January Coachella Valley home sales were below normal by 26.3%.
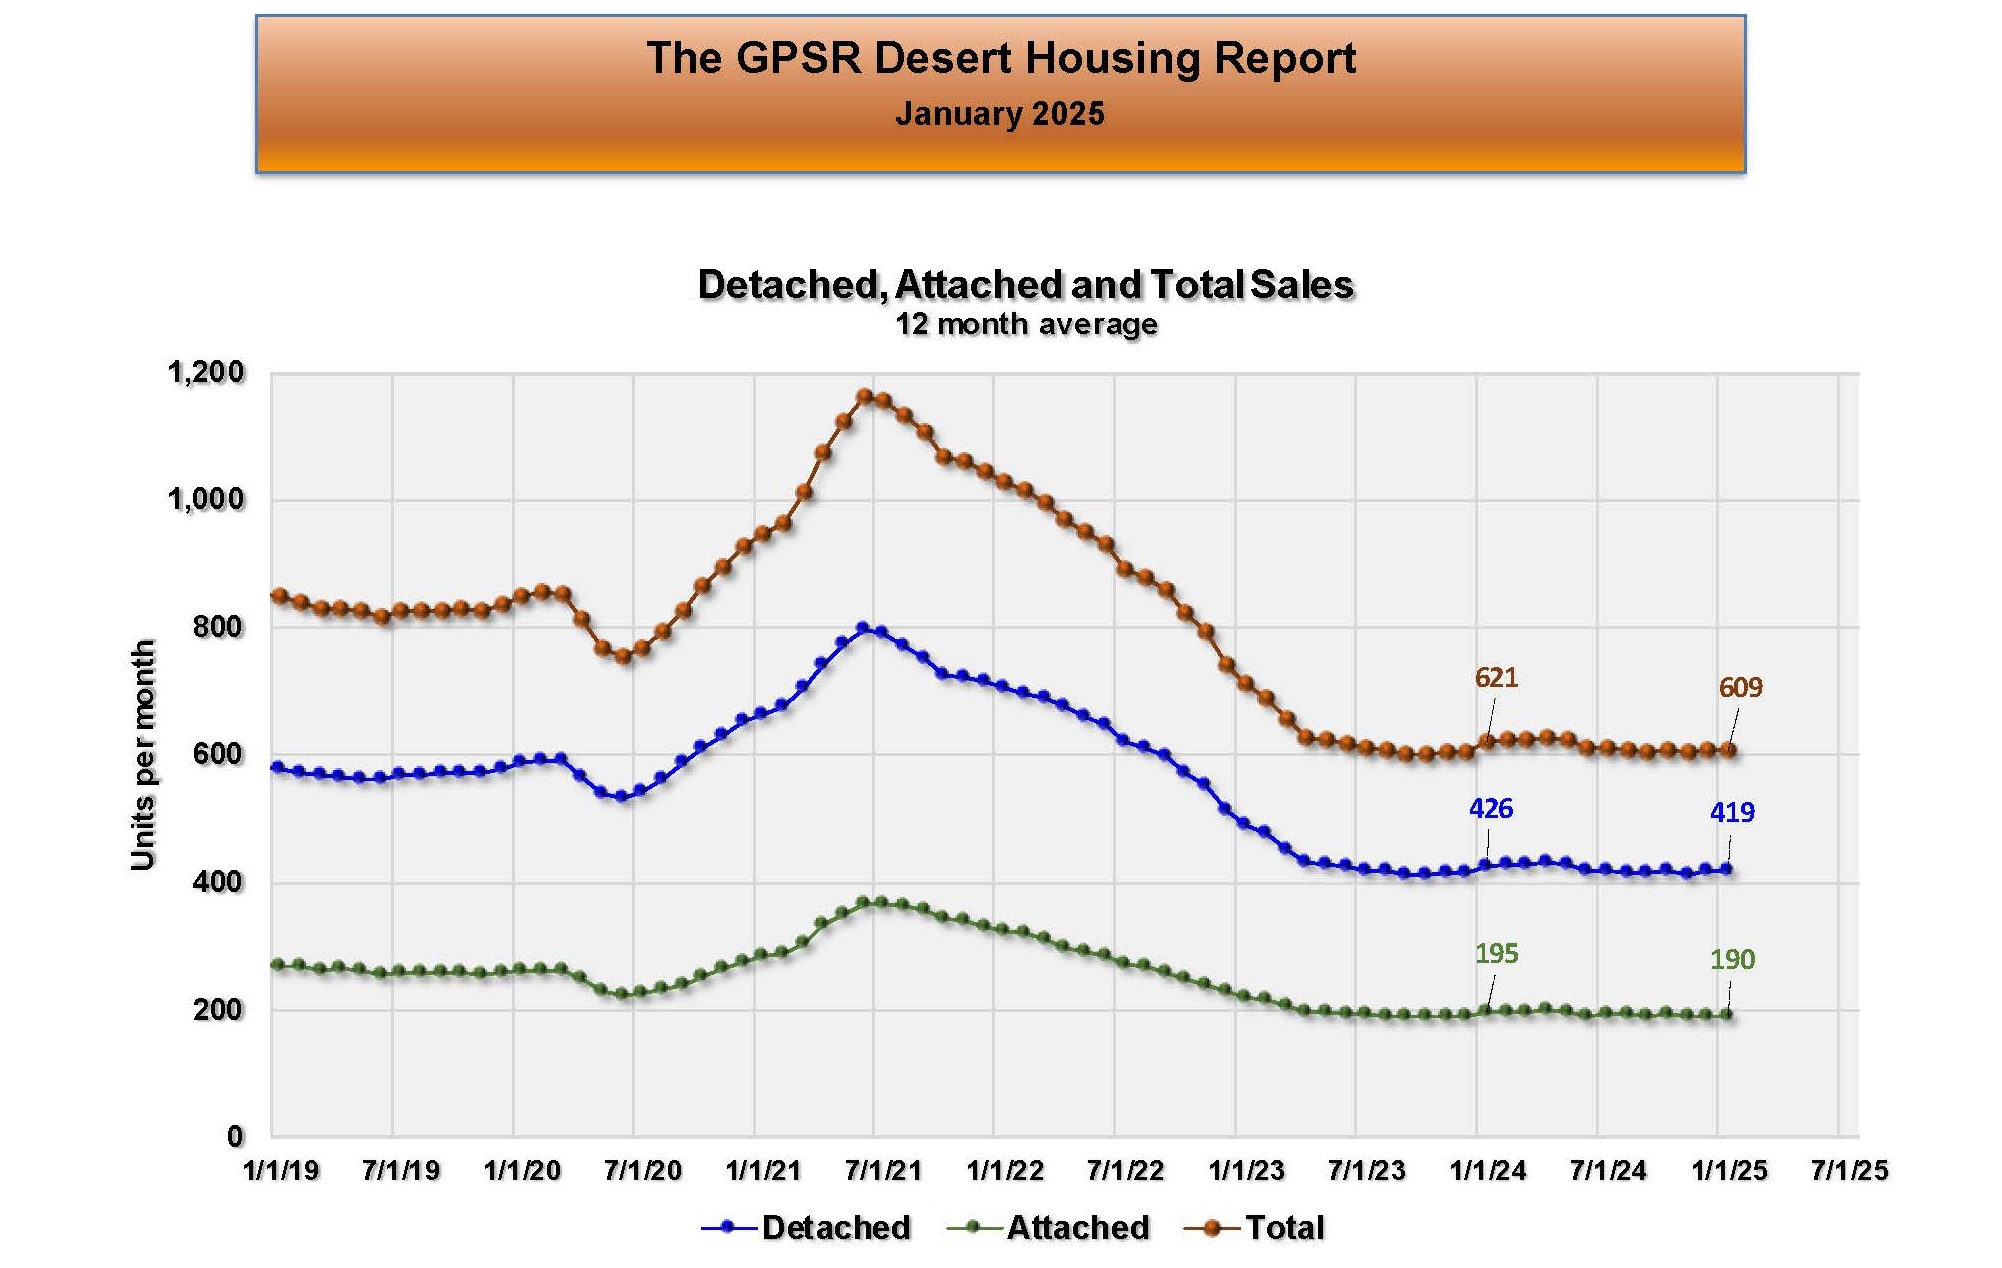 COACHELLA VALLEY JANUARY MONTHLY HOME SALES (TWELVE-MONTH AVERAGE): The twelve-month average of home sales in the Coachella Valley in January was 609 homes (down 12 home sales or 1.9% from 621 home sales in January 2024 and roughly unchanged from 607 home sales in December). Market Watch stated that this long-term average was slightly less than last year and had been hovering around 600 home sales per month for almost two years. They noted that while the Federal Reserve Board has finally begun to lower short term rates, it hasn’t done much to lower fixed mortgage rates, which are longer term.
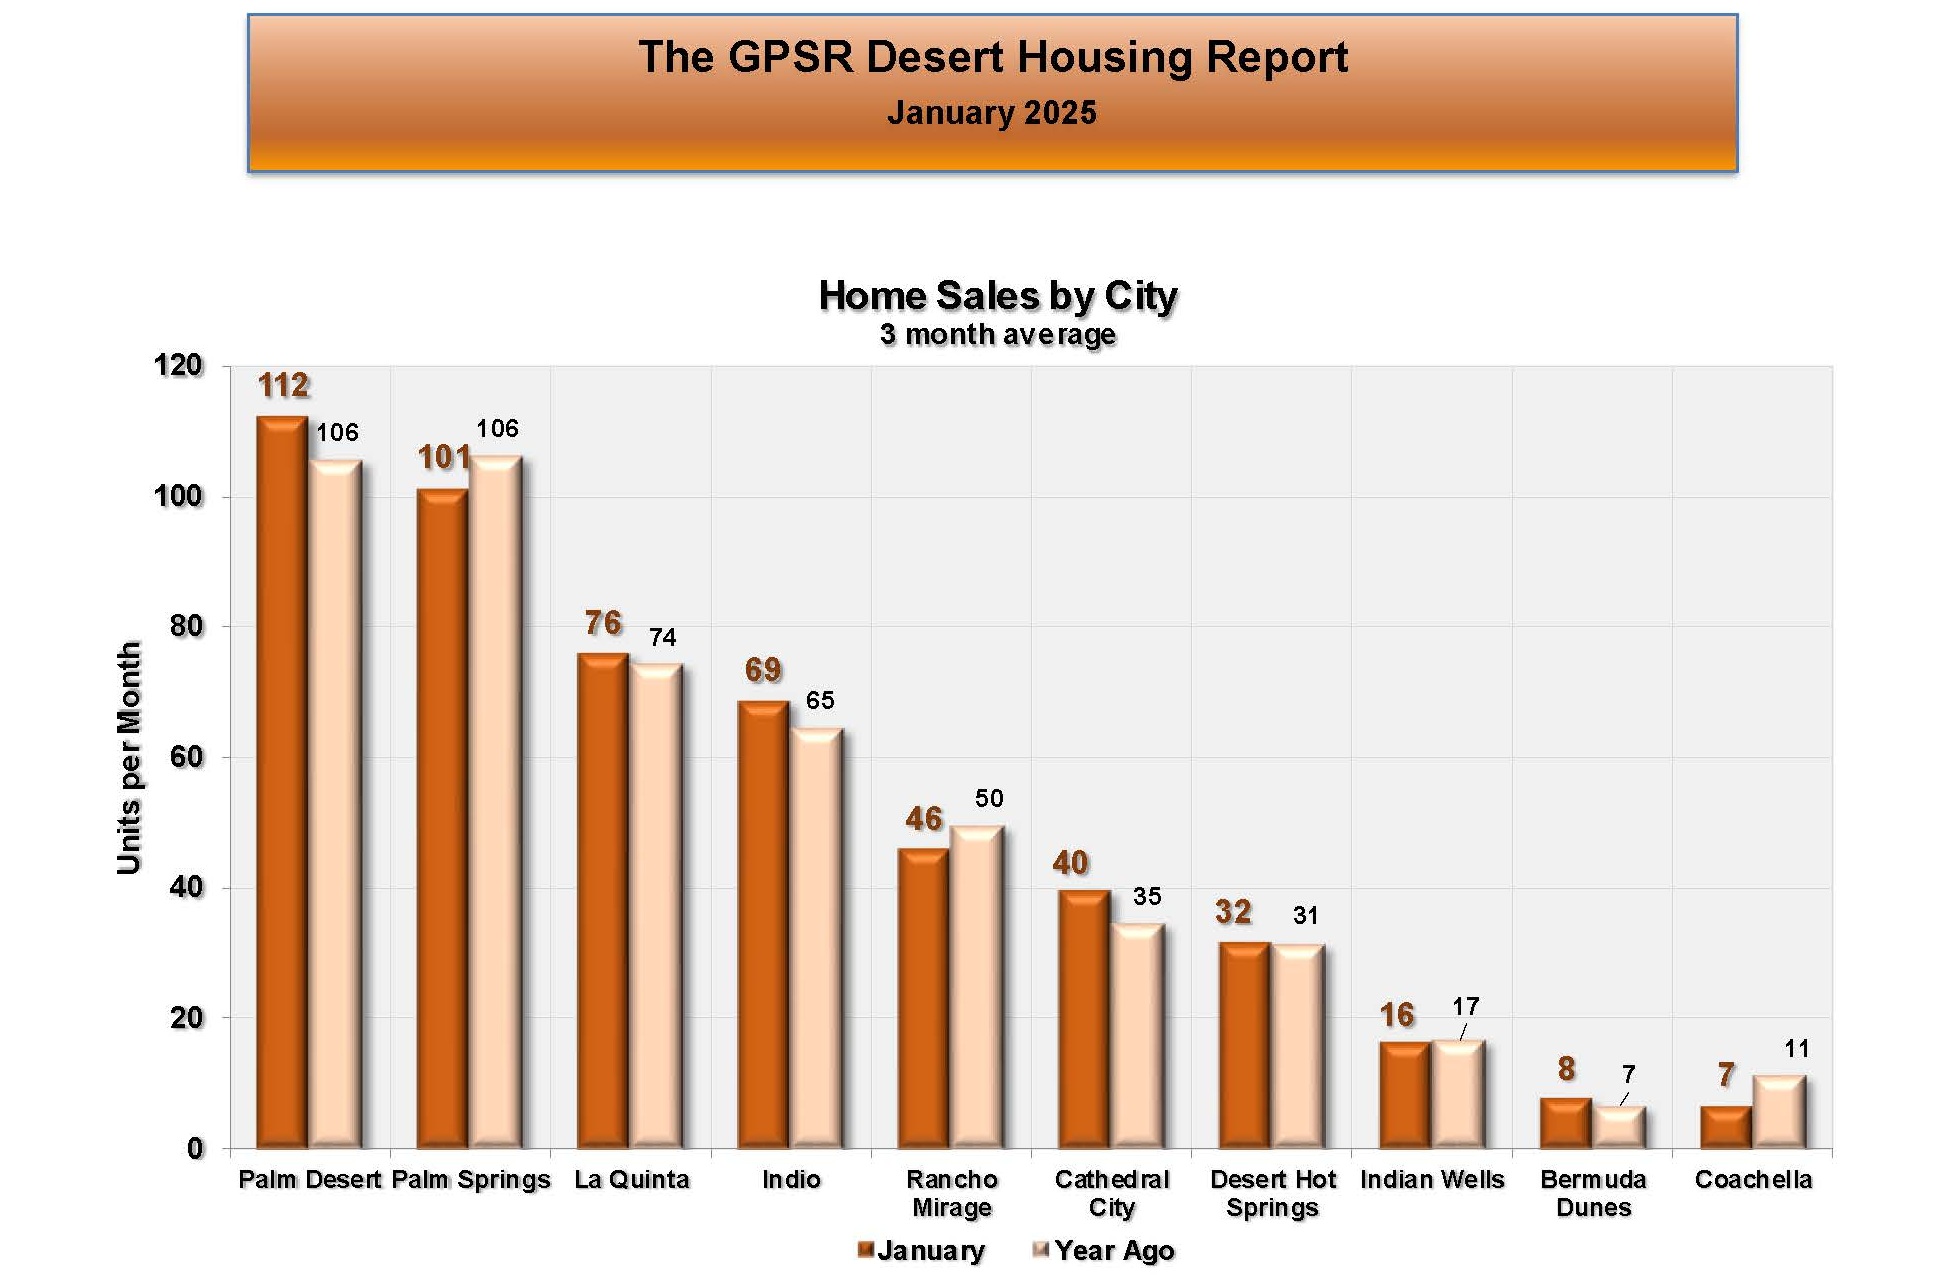 COACHELLA VALLEY JANUARY HOME SALES BY CITY: In January in the Coachella Valley, home sales were highest in Palm Desert at 112 home sales (up 6 home sales or 5.7% from 106 home sales in January 2024 and up 2 home sales from 110 home sales in December). In January in the Coachella Valley, home sales were lowest in Coachella at 7 home sales (down 4 home sales or36.4% from 11 home sales in January 2024 and down 1 home sale from 8 home sales in December).
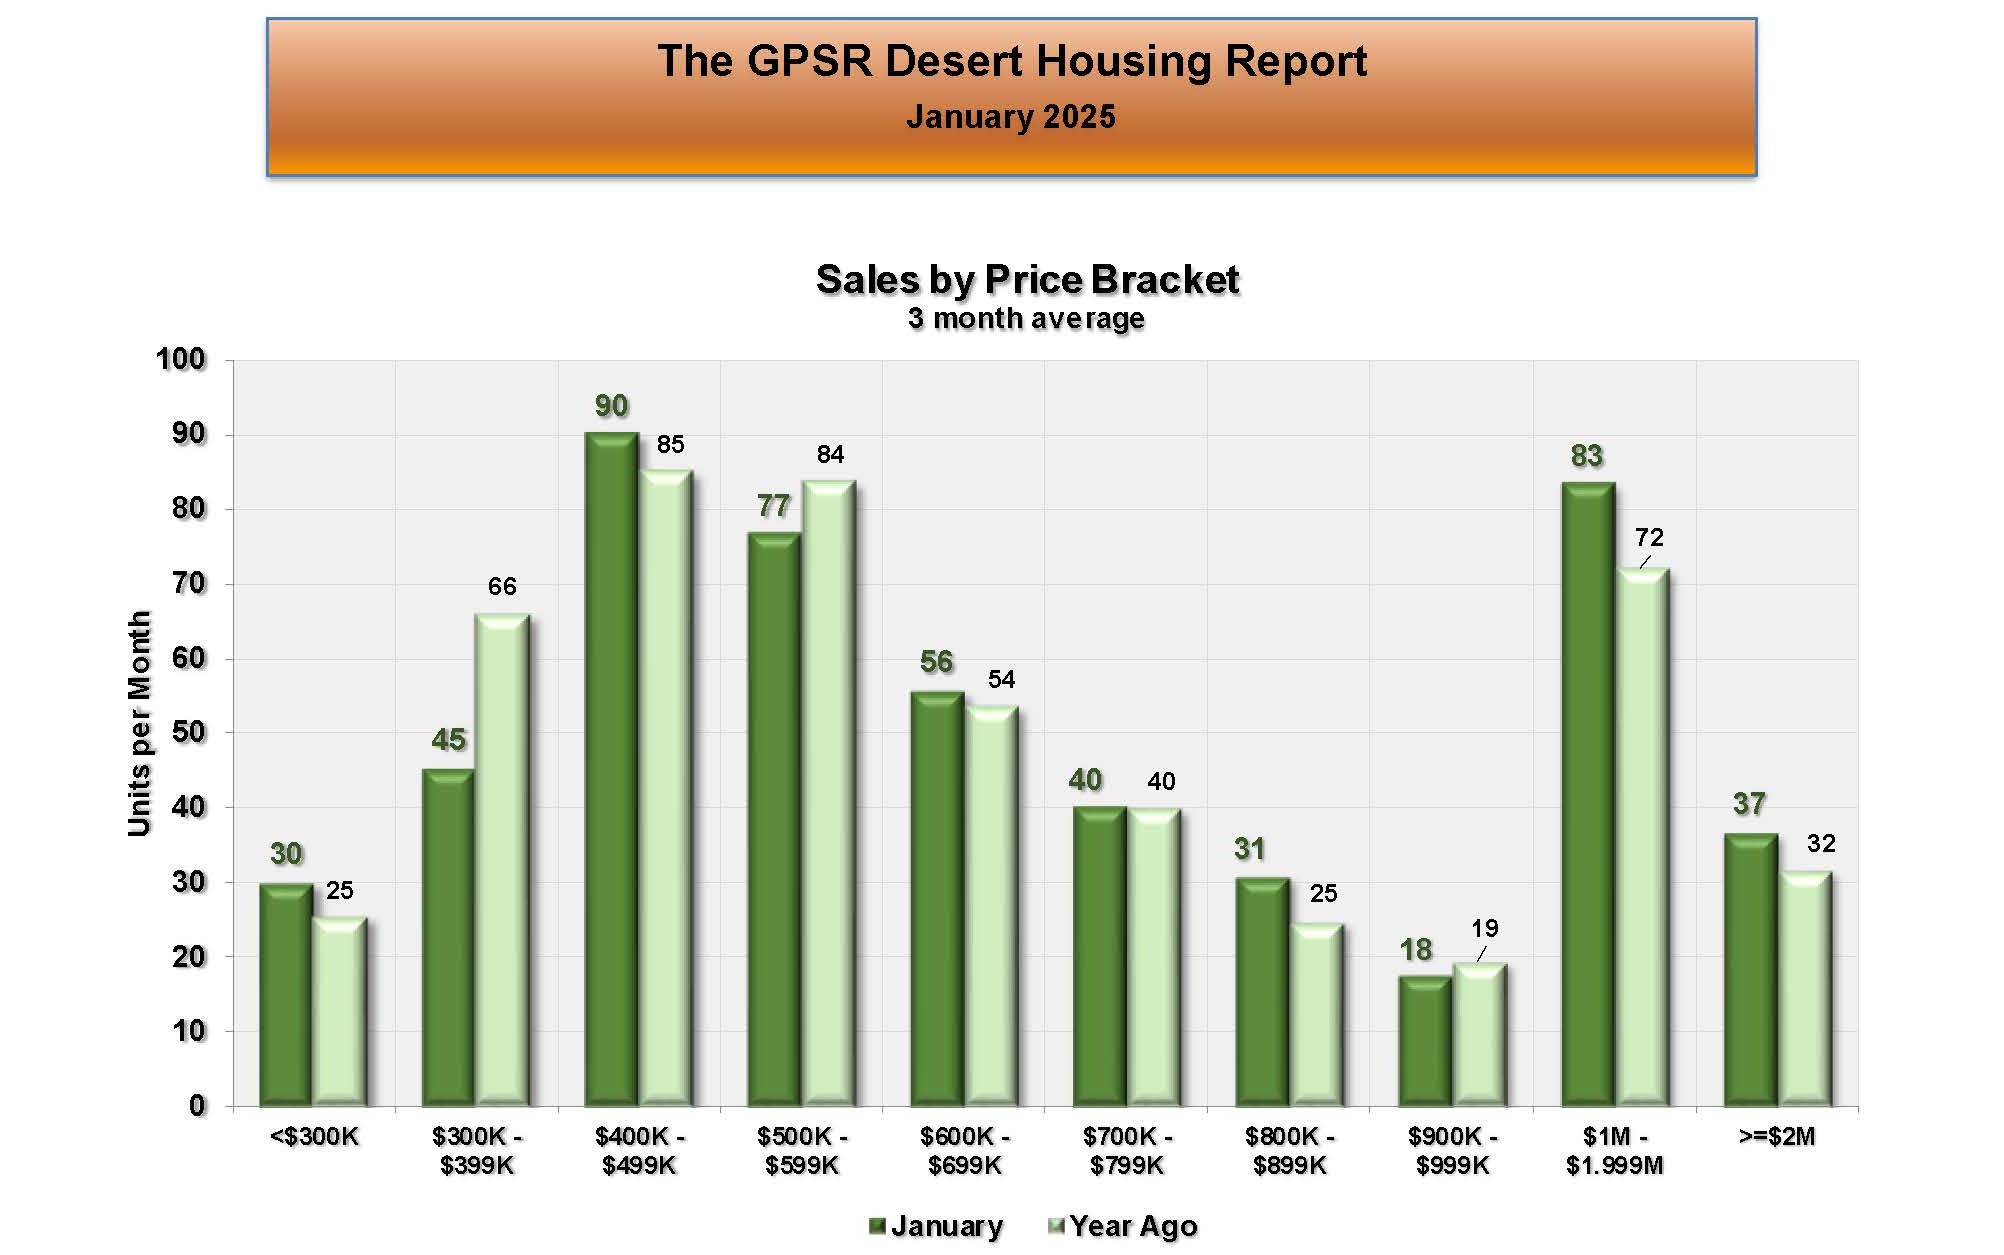 COACHELLA VALLEY JANUARY HOME SALES BY PRICE RANGE: Market Watch noted that the largest home sales decrease in the Coachella Valley in January was for homes priced from $300K to $399K, where home sales decreased to 45 homes (down 21 homes or 31.8% from 66 homes in January 2024). Market Watch felt that home sales were comparable to year ago levels in the other price ranges.
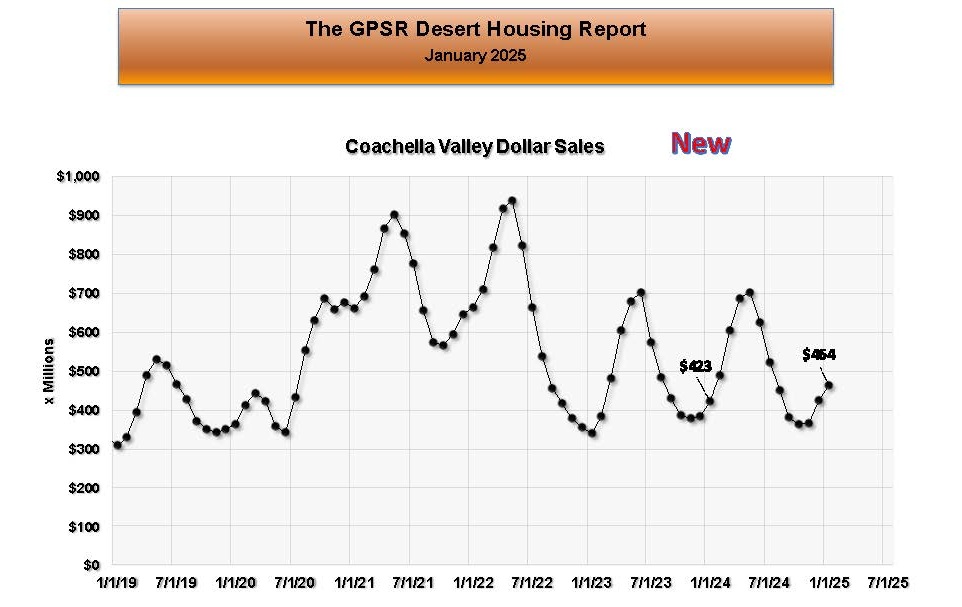 COACHELLA VALLEY JANUARY HOME SALES IN DOLLARS: In January in the Coachella Valley, the three-month average of home sales was $464 million (up $41 million or 9.7% from $423 million in January 2024 and up $43 million or 10.2% from home sales of $421 million in December).
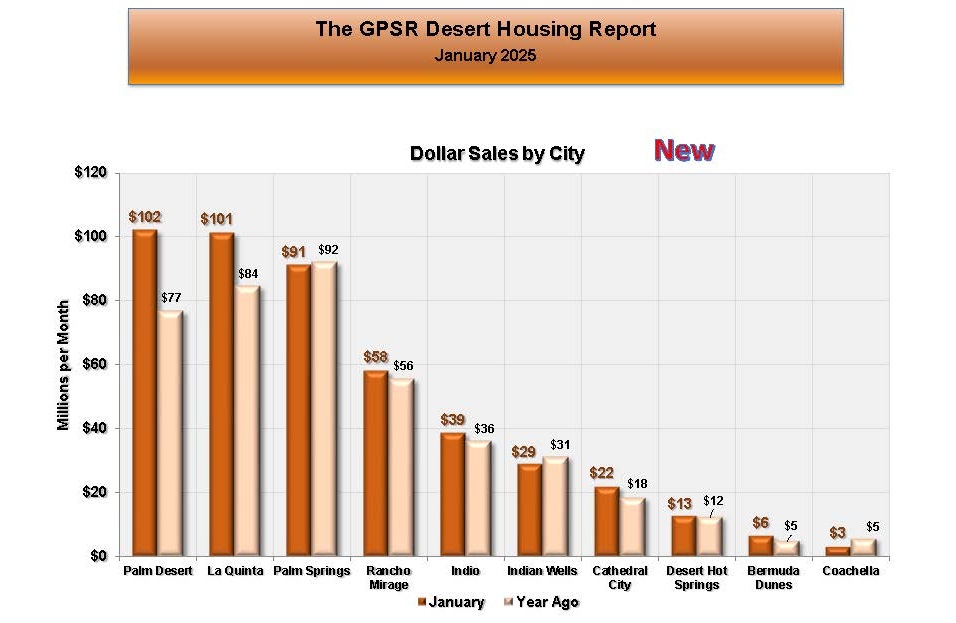 COACHELLA VALLEY JANUARY HOME SALES IN DOLLARS BY CITY: In January in the Coachella Valley, home sales increased to $102 million in Palm Desert (up $25 million or 32.5% from home sales of $77 million in January 2024). Similarly, home sales increased to $101 million in La Quinta (up $17 million or 20.2% from home sales of $84 million in January 2024). Market Watch noted that home sales were comparable to last year in the other Coachella Valley cities in January.
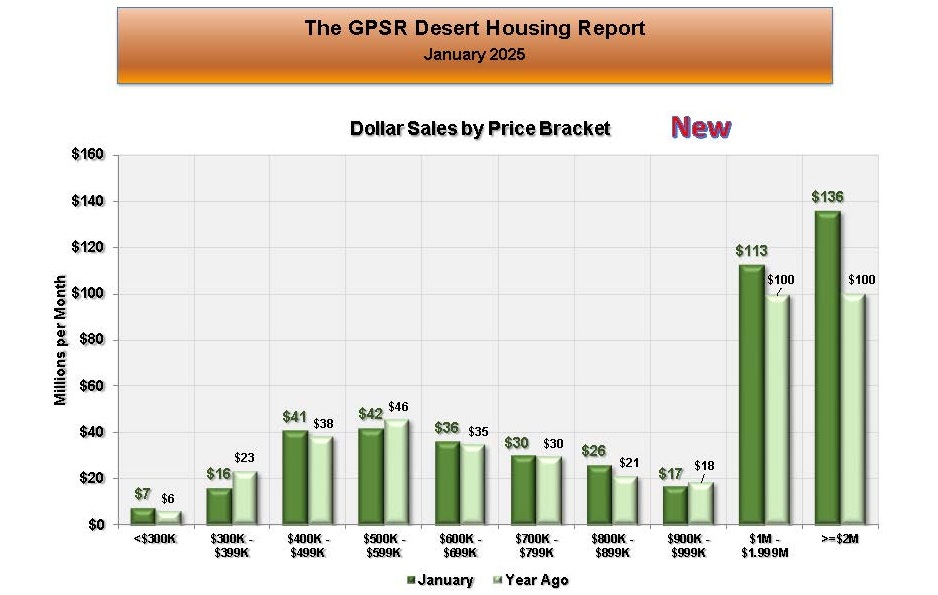 COACHELLA VALLEY JANUARY HOME SALES IN DOLLARS BY PRICE RANGE: In January in the Coachella Valley, sales of homes priced over $2 million increased to $136 million (up $36 million or 36% from home sales of $100 million in January 2024). Sales of homes priced between $1 million and $1.999 million increased to $113 million (up $13 million or 13% from home sales of $100 million in January 2024). Market Watch noted that sales of homes priced over $1 million continued to account for roughly half of all dollar sales in the Coachella Valley.
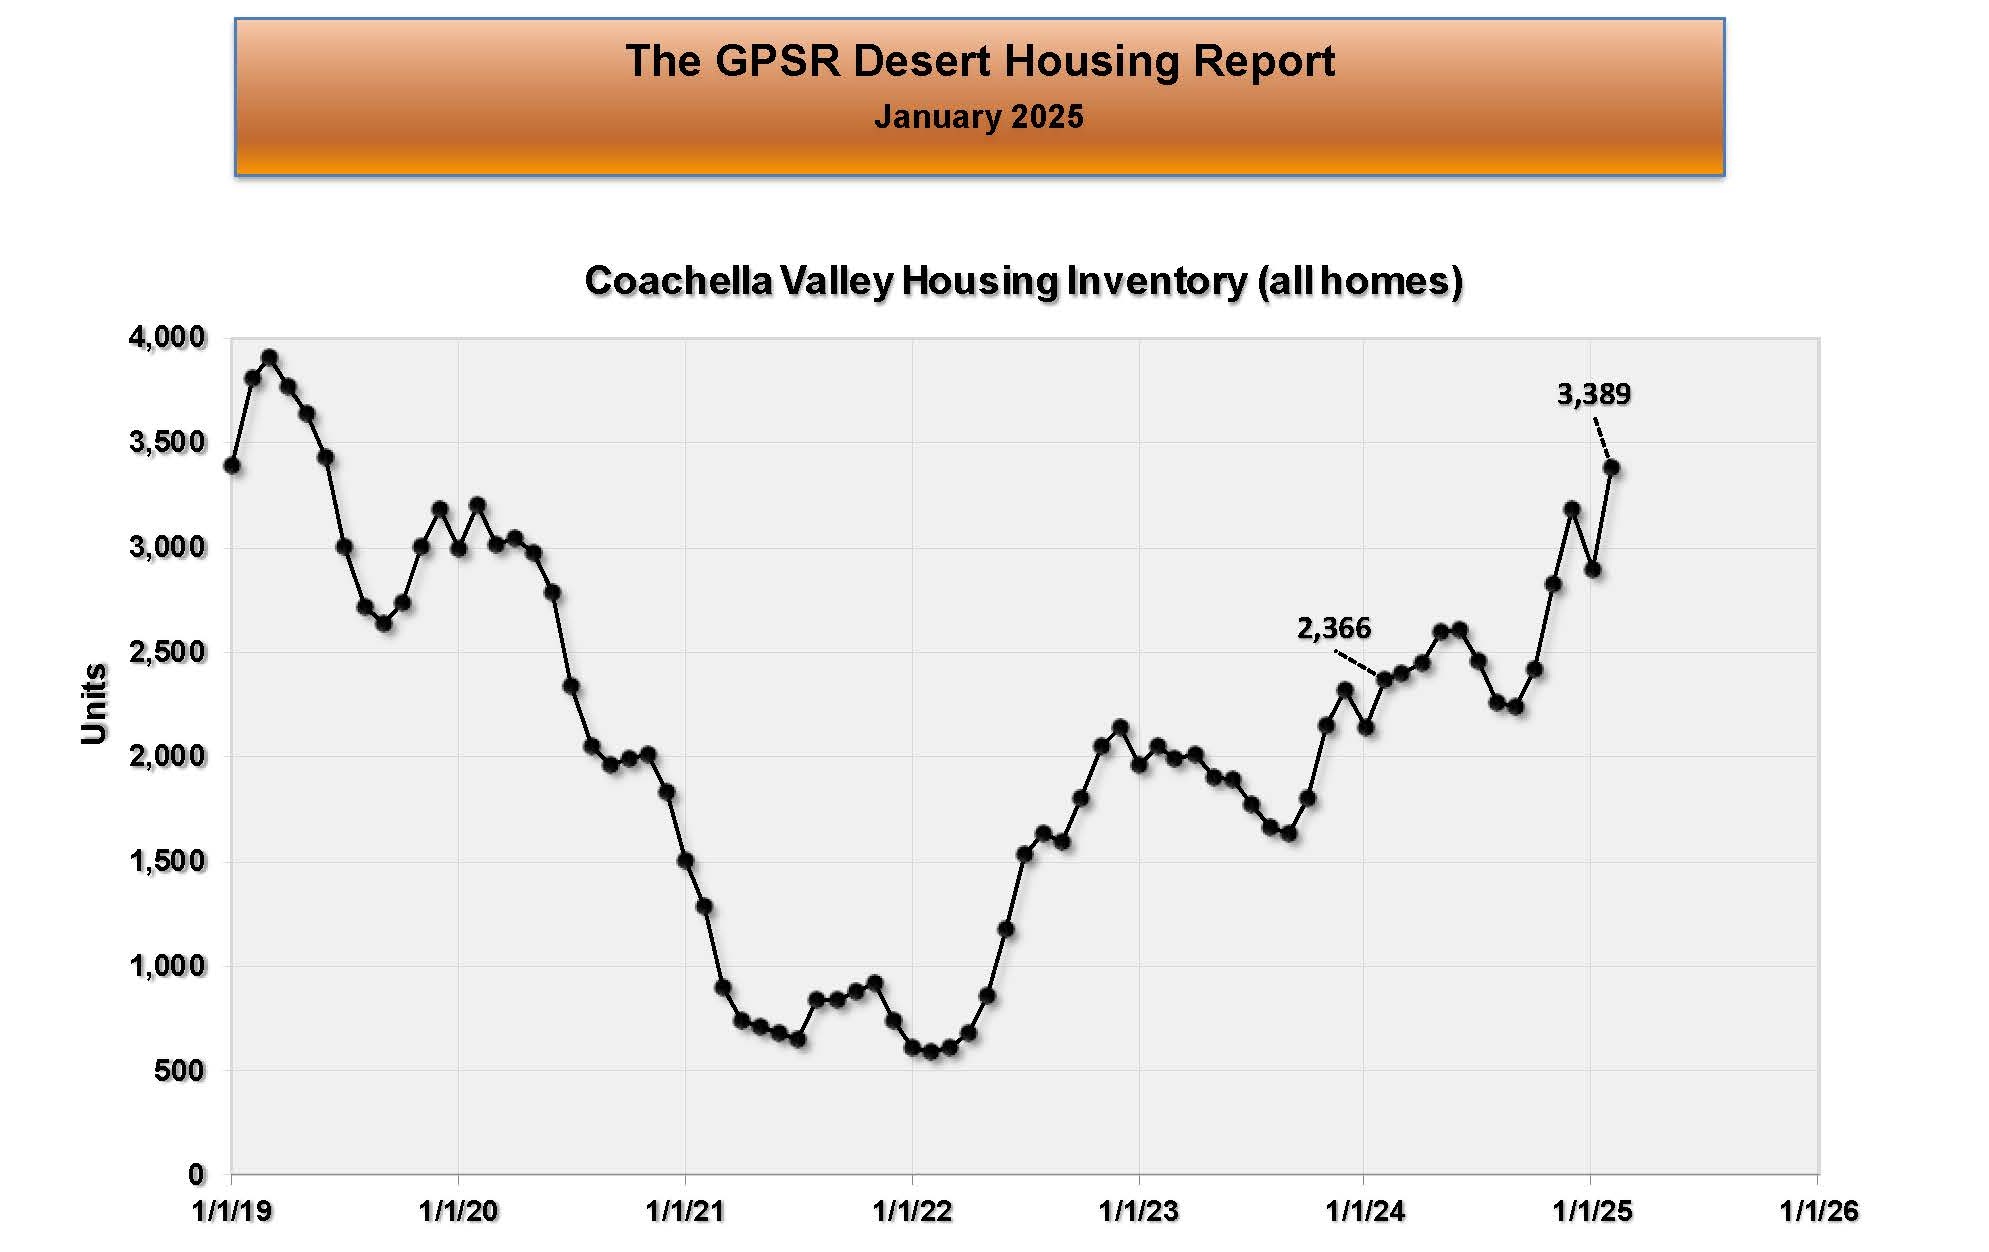 COACHELLA VALLEY FEBRUARY 1ST HOME SALES INVENTORY: On February 1st, the Coachella Valley home sales inventory was 3,389 homes (up 1,023 homes or 43.2% from 2,366 homes on February 1st, 2024 and up 491 homes or 16.9% from 2,898 homes on January 1st of this year). Market Watch noted that the seasonal pattern for Coachella Valley home sales inventory suggested that inventory would increase through February. Market Watch added that the Coachella Valley inventory levels were now comparable to pre-pandemic inventory levels.
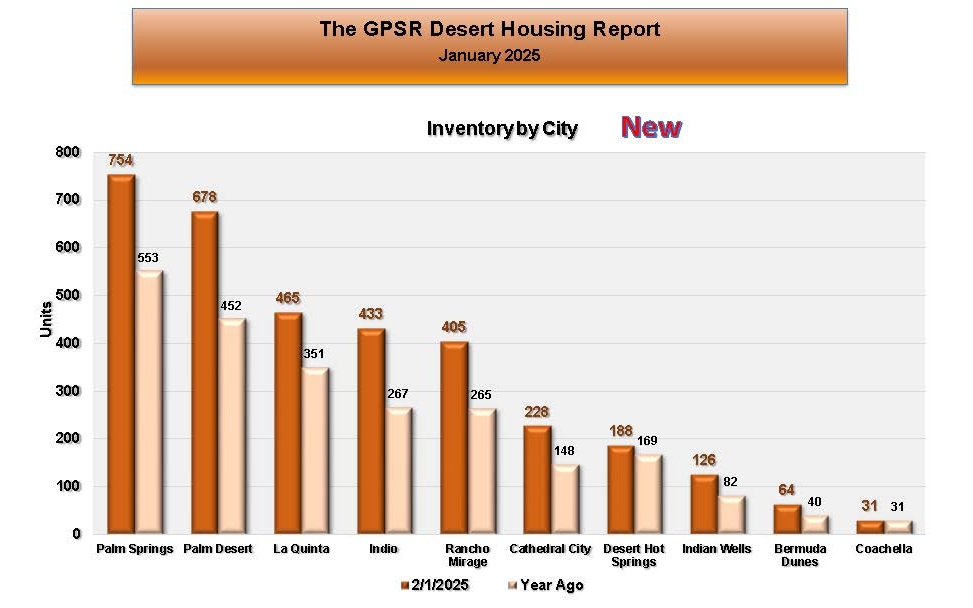 COACHELLA VALLEY FEBRUARY 1ST HOME SALES INVENTORY BY CITY: The highest home sales inventory in the Coachella Valley on February 1st, was in Palm Springs at 754 homes (up 201 homes or 36.3% from 553 homes on February 1st, 2024 and up 131 homes or 21% from 499 homes on January 1st of this year). The lowest home sales inventory in the Coachella Valley on February 1st, was in Coachella at 31 homes (the same as on February 1st, 2024 and up 7 homes or 29.2% from 24 homes on January 1st of this year). Market Watch pointed out that this data could be used to identify those cities that have homeowners with the greatest selling interest and how it compares to last year.
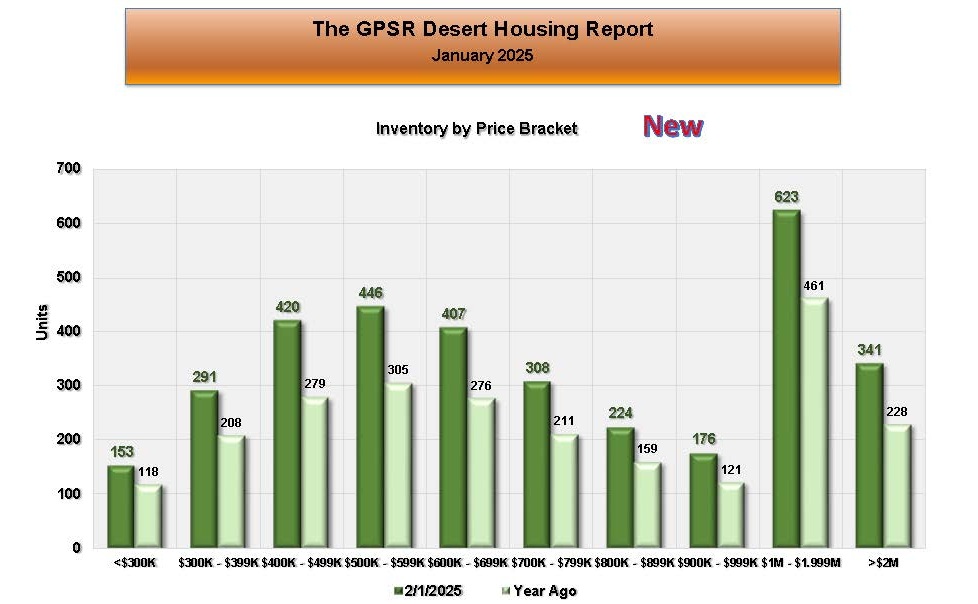
COACHELLA VALLEY FEBRUARY 1ST HOME SALES INVENTORY BY PRICE RANGE: The highest home sales inventory in the Coachella Valley on February 1st, was for homes priced between $1 million and $1.999 million at $623 million (up $162 million or 35.9% from $461 million on February 1st, 2024 and up $104 million or 20% from 519 homes on January 1st of this year). The lowest home sales inventory in the Coachella Valley on February 1st, was for homes priced under $300K at $153 million (up $35 million or 30% from $118 million on February 1st, 2024 and up $18 million or 13.3% from $135 million on January 1st). Market Watch commented that this data could help locate what price brackets might be responsible for the growth or contraction of inventory.
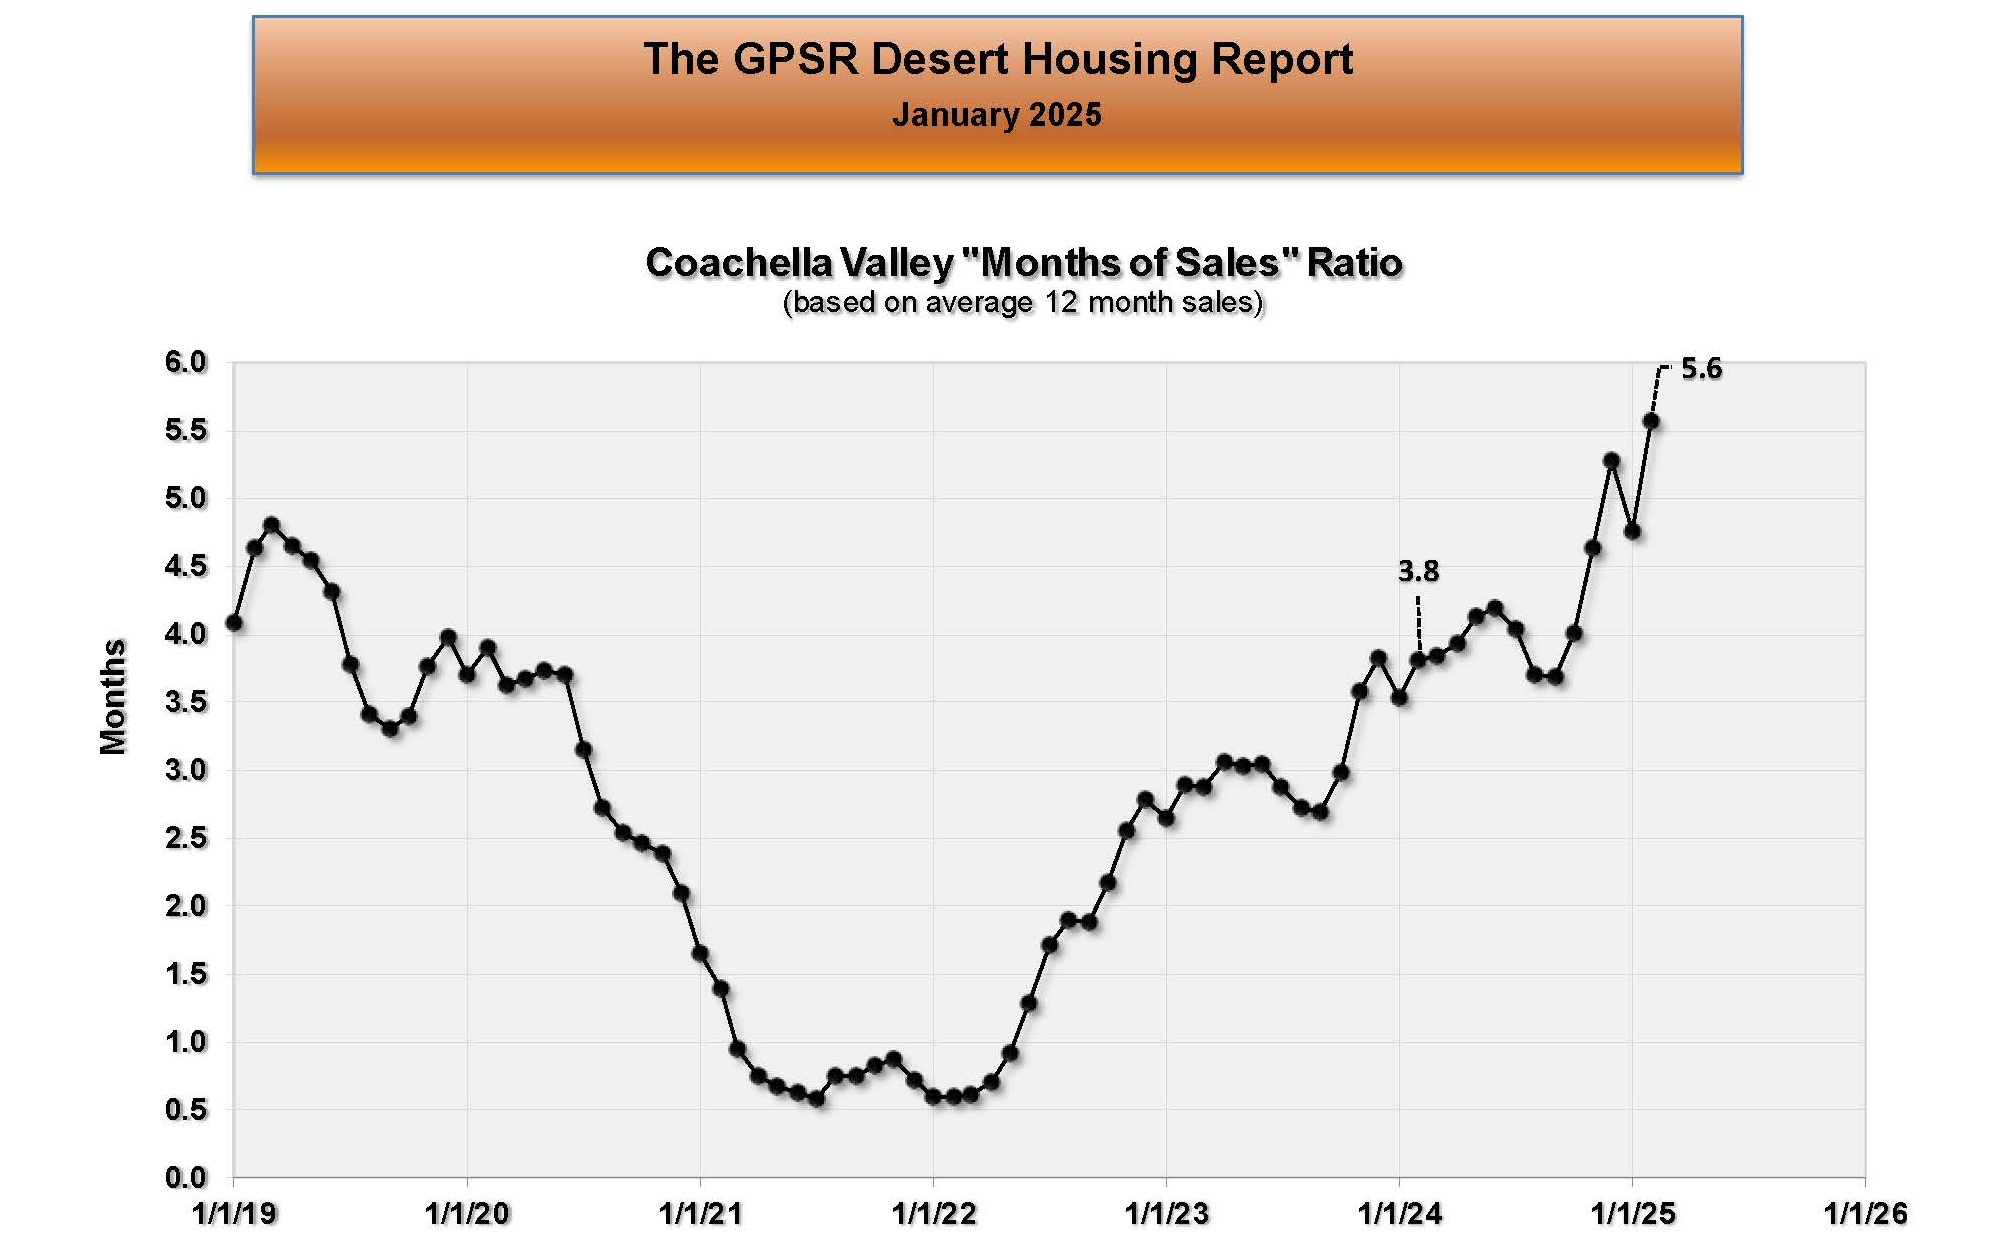 COACHELLA VALLEY FEBRUARY 1ST REGIONAL MONTHS OF SALES RATIO: On February 1st, the Coachella Valley’s months of sales ratio was 5.6 months (up 1.8 months or 47.4% from 3.8 months on February 1st, 2024 and up 0.8 months or 16.7% from 4.8 months on January 1st). Market Watch noted that this fundamental ratio, which measures supply and demand, is now above pre-pandemic levels. They added that while inventory has recovered with low sales, supply is beginning to exceed demand. They felt that this should not cause a problem for home prices unless it begins to extend average selling times.
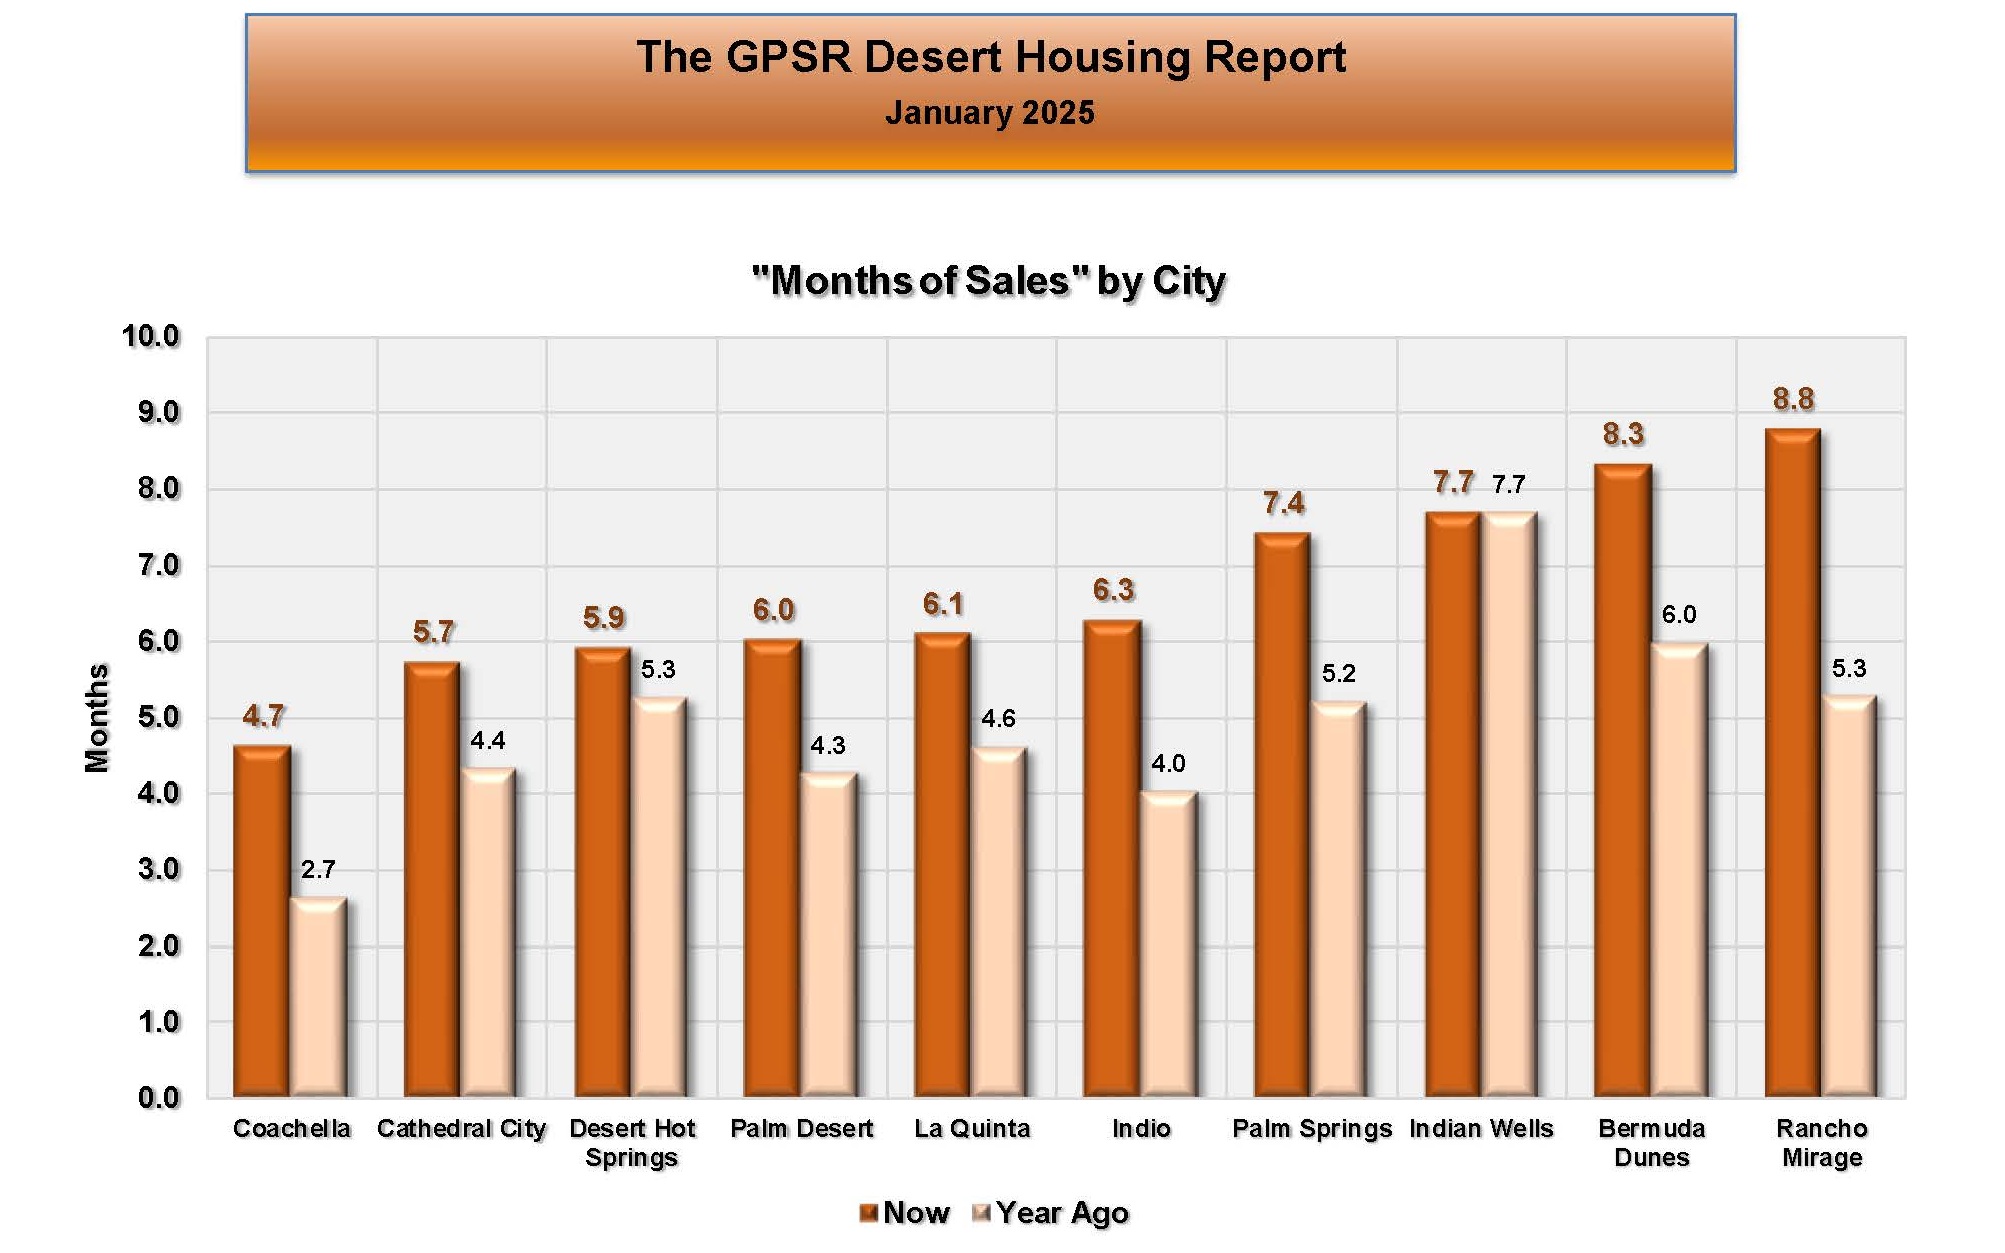
COACHELLA VALLEY FEBRUARY 1ST MONTHS OF SALES RATIO BY CITY: The lowest months of sales ratio on February 1st was in Coachella at 4.7 months (up from 2.7 months on February 1st, 2024 and up from 3.1 months on January 1stof this year). The highest months of sale ratio on February 1st was in Rancho Mirage at 8.8 months (up from 5.3 months on February 1st, 2024 and up from 6.4 months on January 1st of this year). Market Watch noted that most months of sales ratios in the Coachella Valley’s nine cities were between 6.0 and 7.0 months. Market Watch noted that since months of sales was really the supply-demand equation for housing, the months of sales ration data showed that the housing market was becoming supply heavy. If the months of sales ratios move higher, it would begin to increase selling times eventually putting downward pressure on home prices.
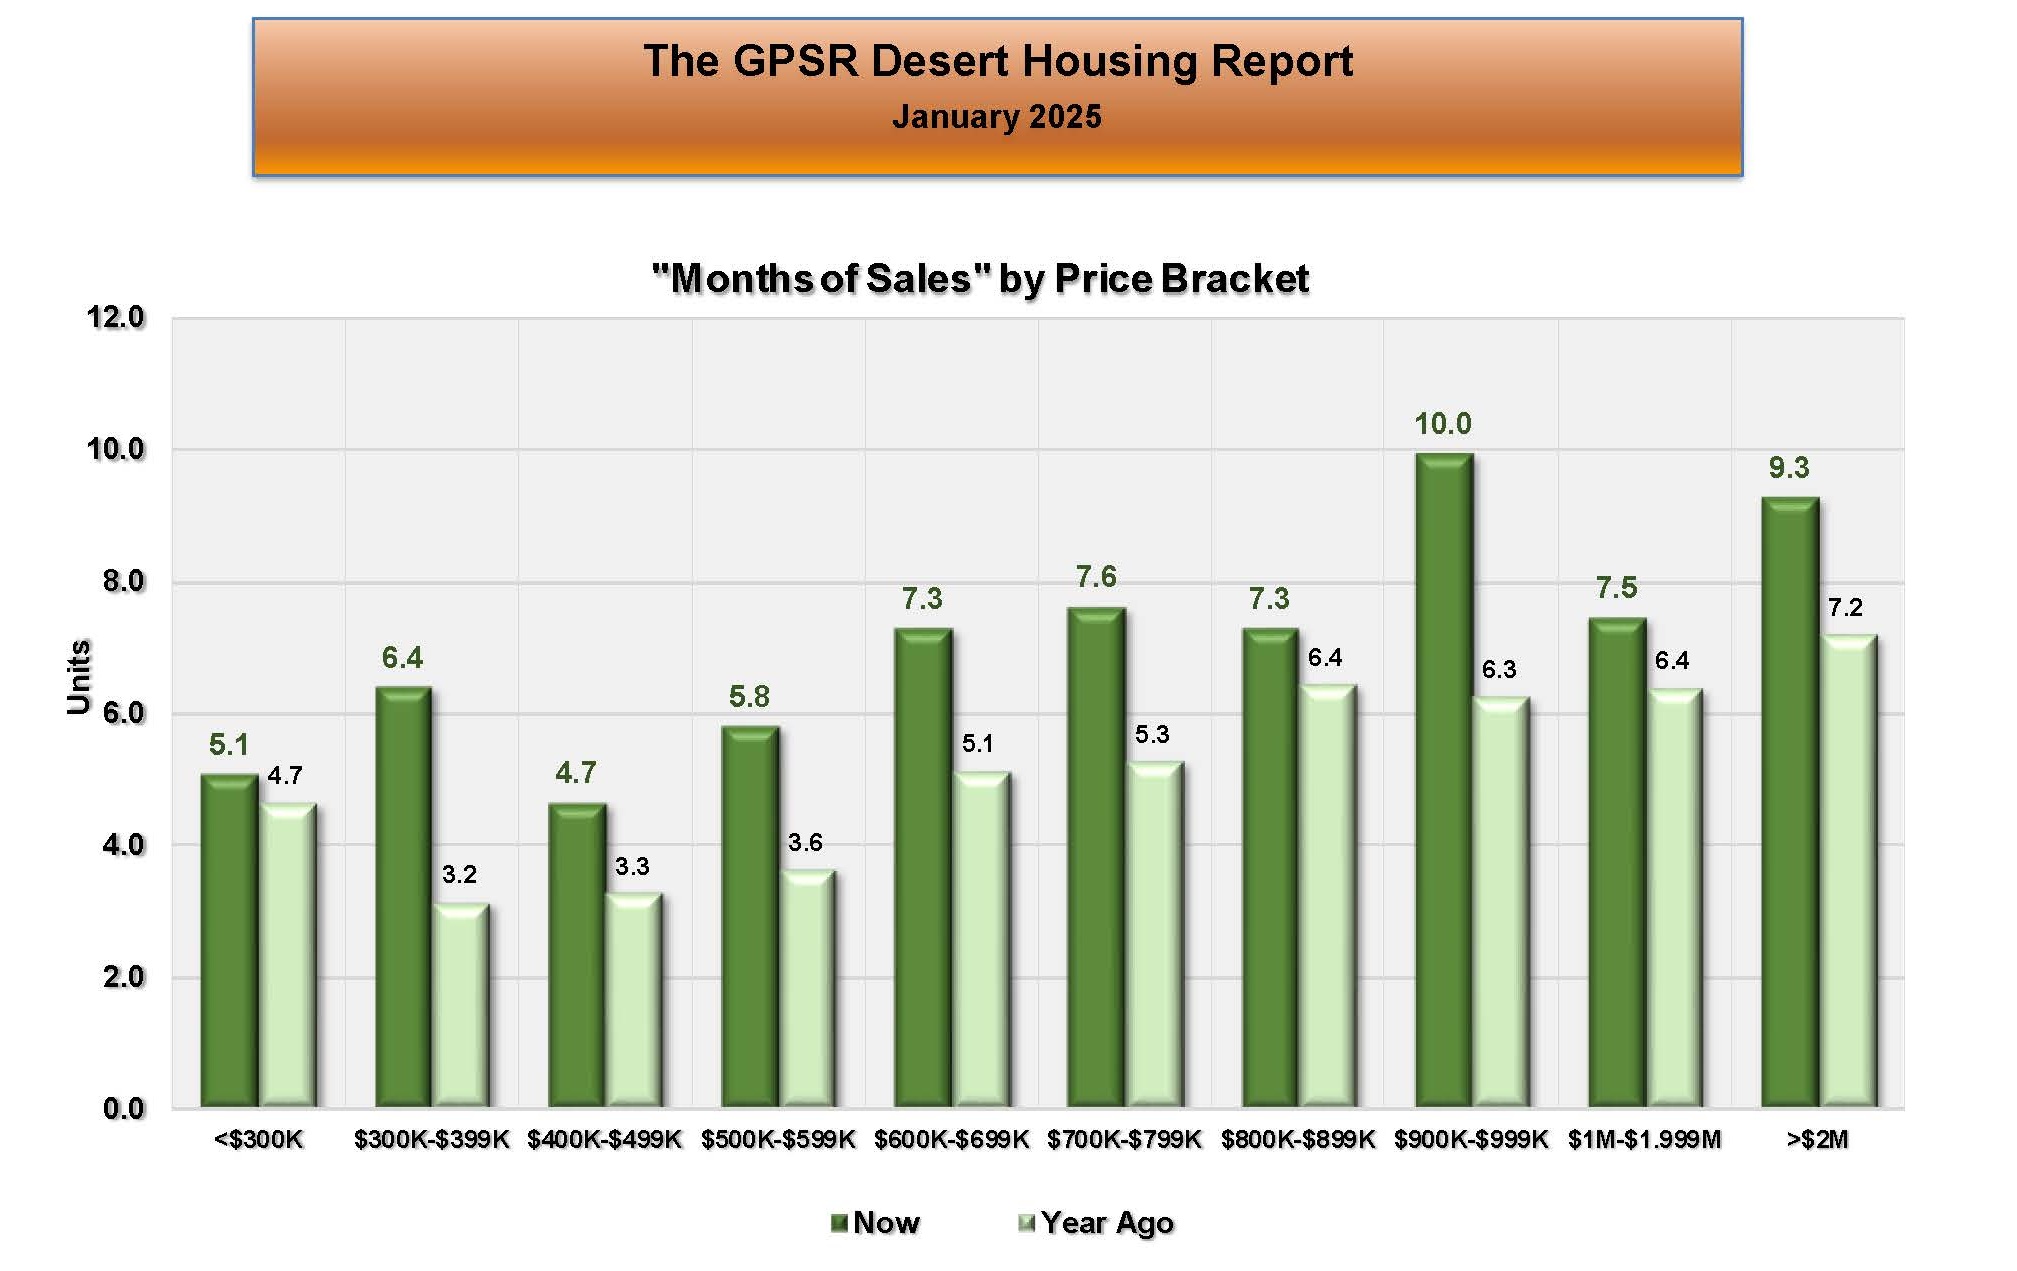 COACHELLA VALLEY FEBRUARY 1ST MONTHS OF SALES RATIO BY PRICE RANGE: The lowest months of sales ratio on February 1st was for homes priced between $400K and $499K at 4.7 months (up from 3.3 months on February 1st 2024 and up from 4.4 months on January 1st of this year). The highest months of sales ratio was for homes priced between $900K and $999K at 10 months (up from 6.3 months on February 1st 2024 but down from 11.4 months on January 1st of this year). Market Watch noted that since months of sales ratios were really the supply-demand equation for housing, the large increases over last year shows supply is starting to exceed demand in almost all price ranges. They pointed out that this hasn’t affected prices yet and most probably wouldn’t until selling times begin to lengthen.
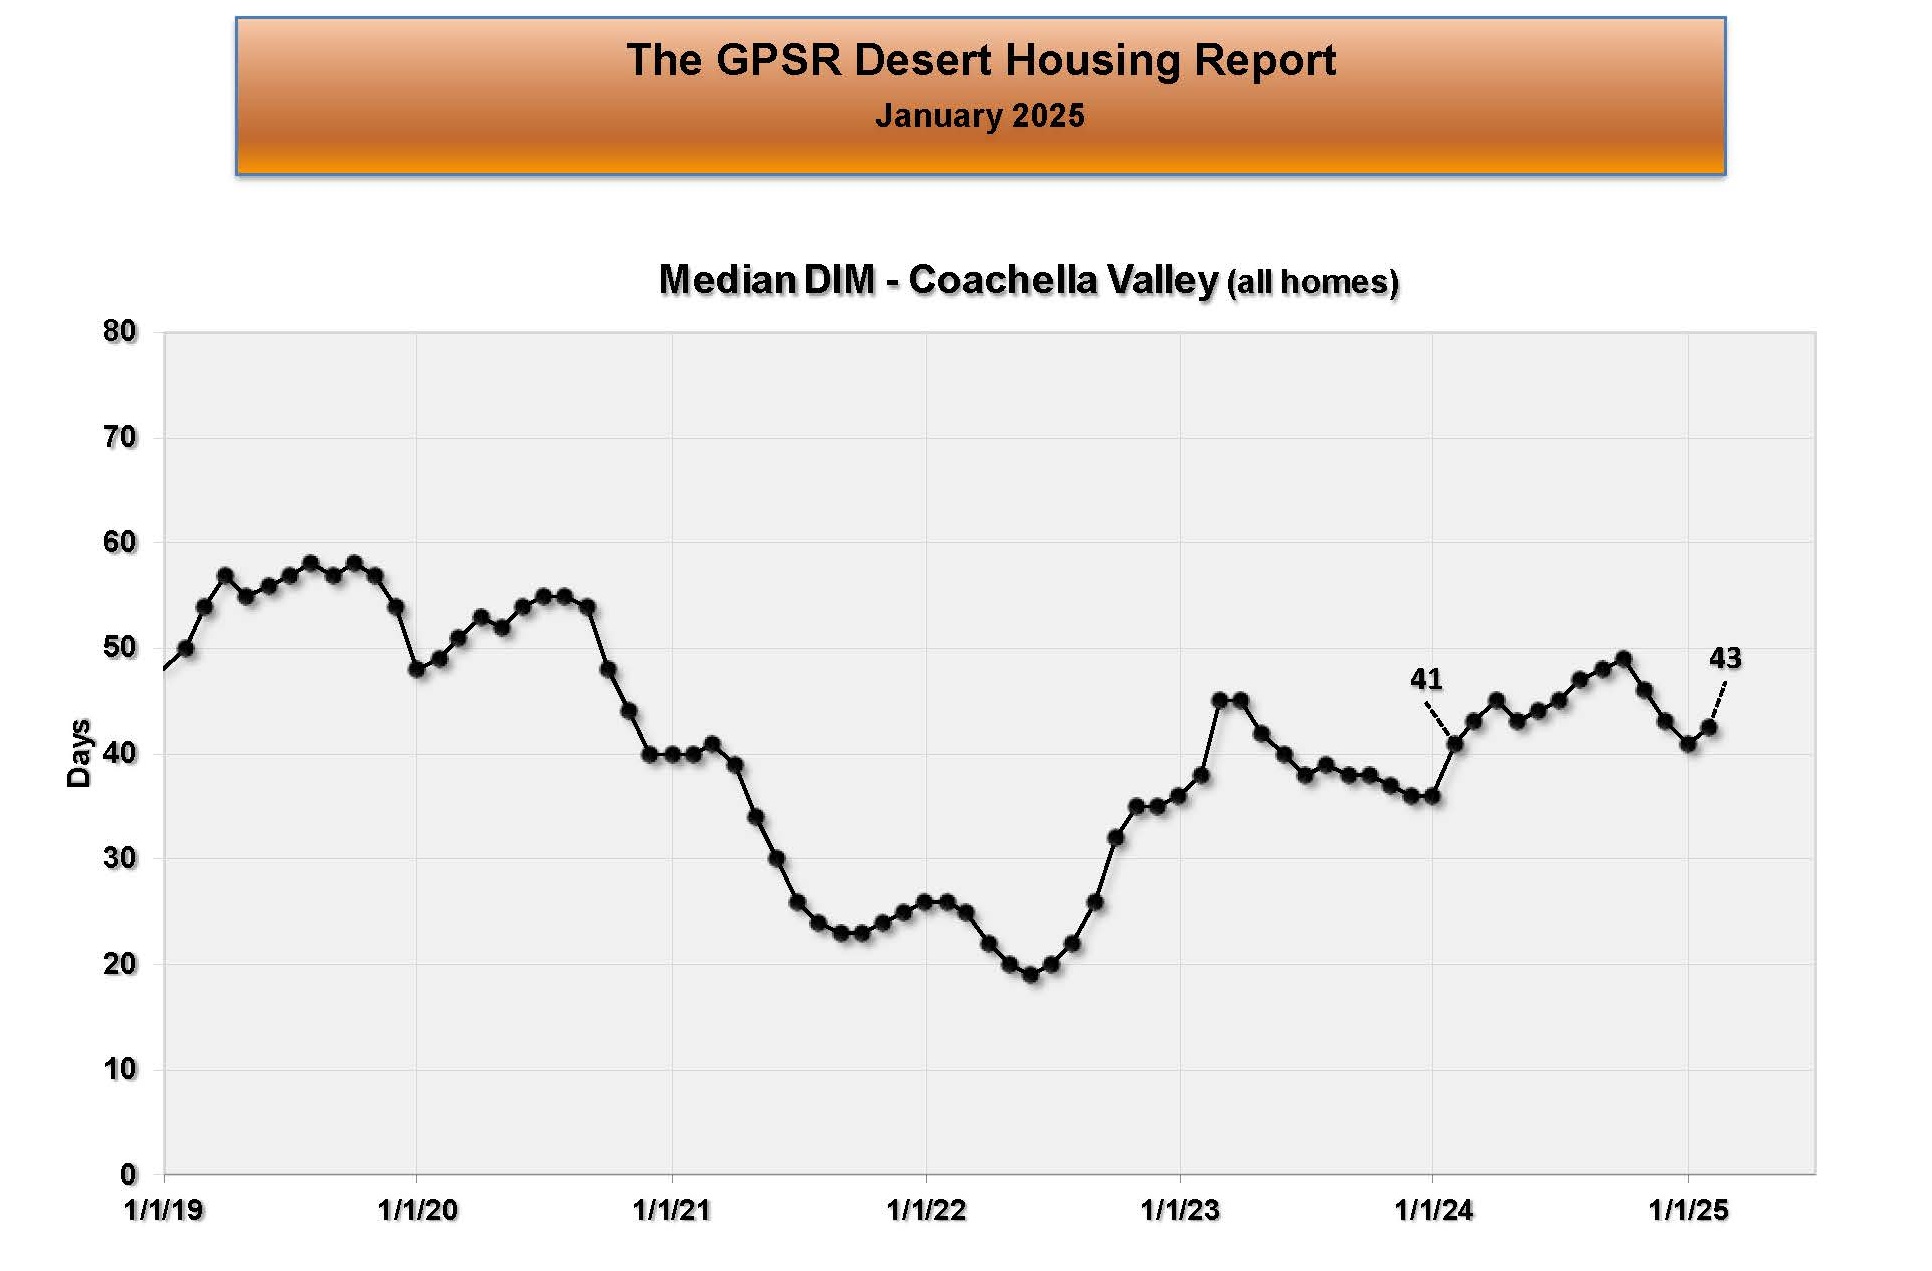 COACHELLA VALLEY JANUARY REGIONAL DAYS IN THE MARKET: The median selling time in the Coachella Valley in January was 43 days (up from 41 days in January 2024 and up from 41 days in December 2024). Market Watch noted that these historically short median selling times helped keep prices stable.
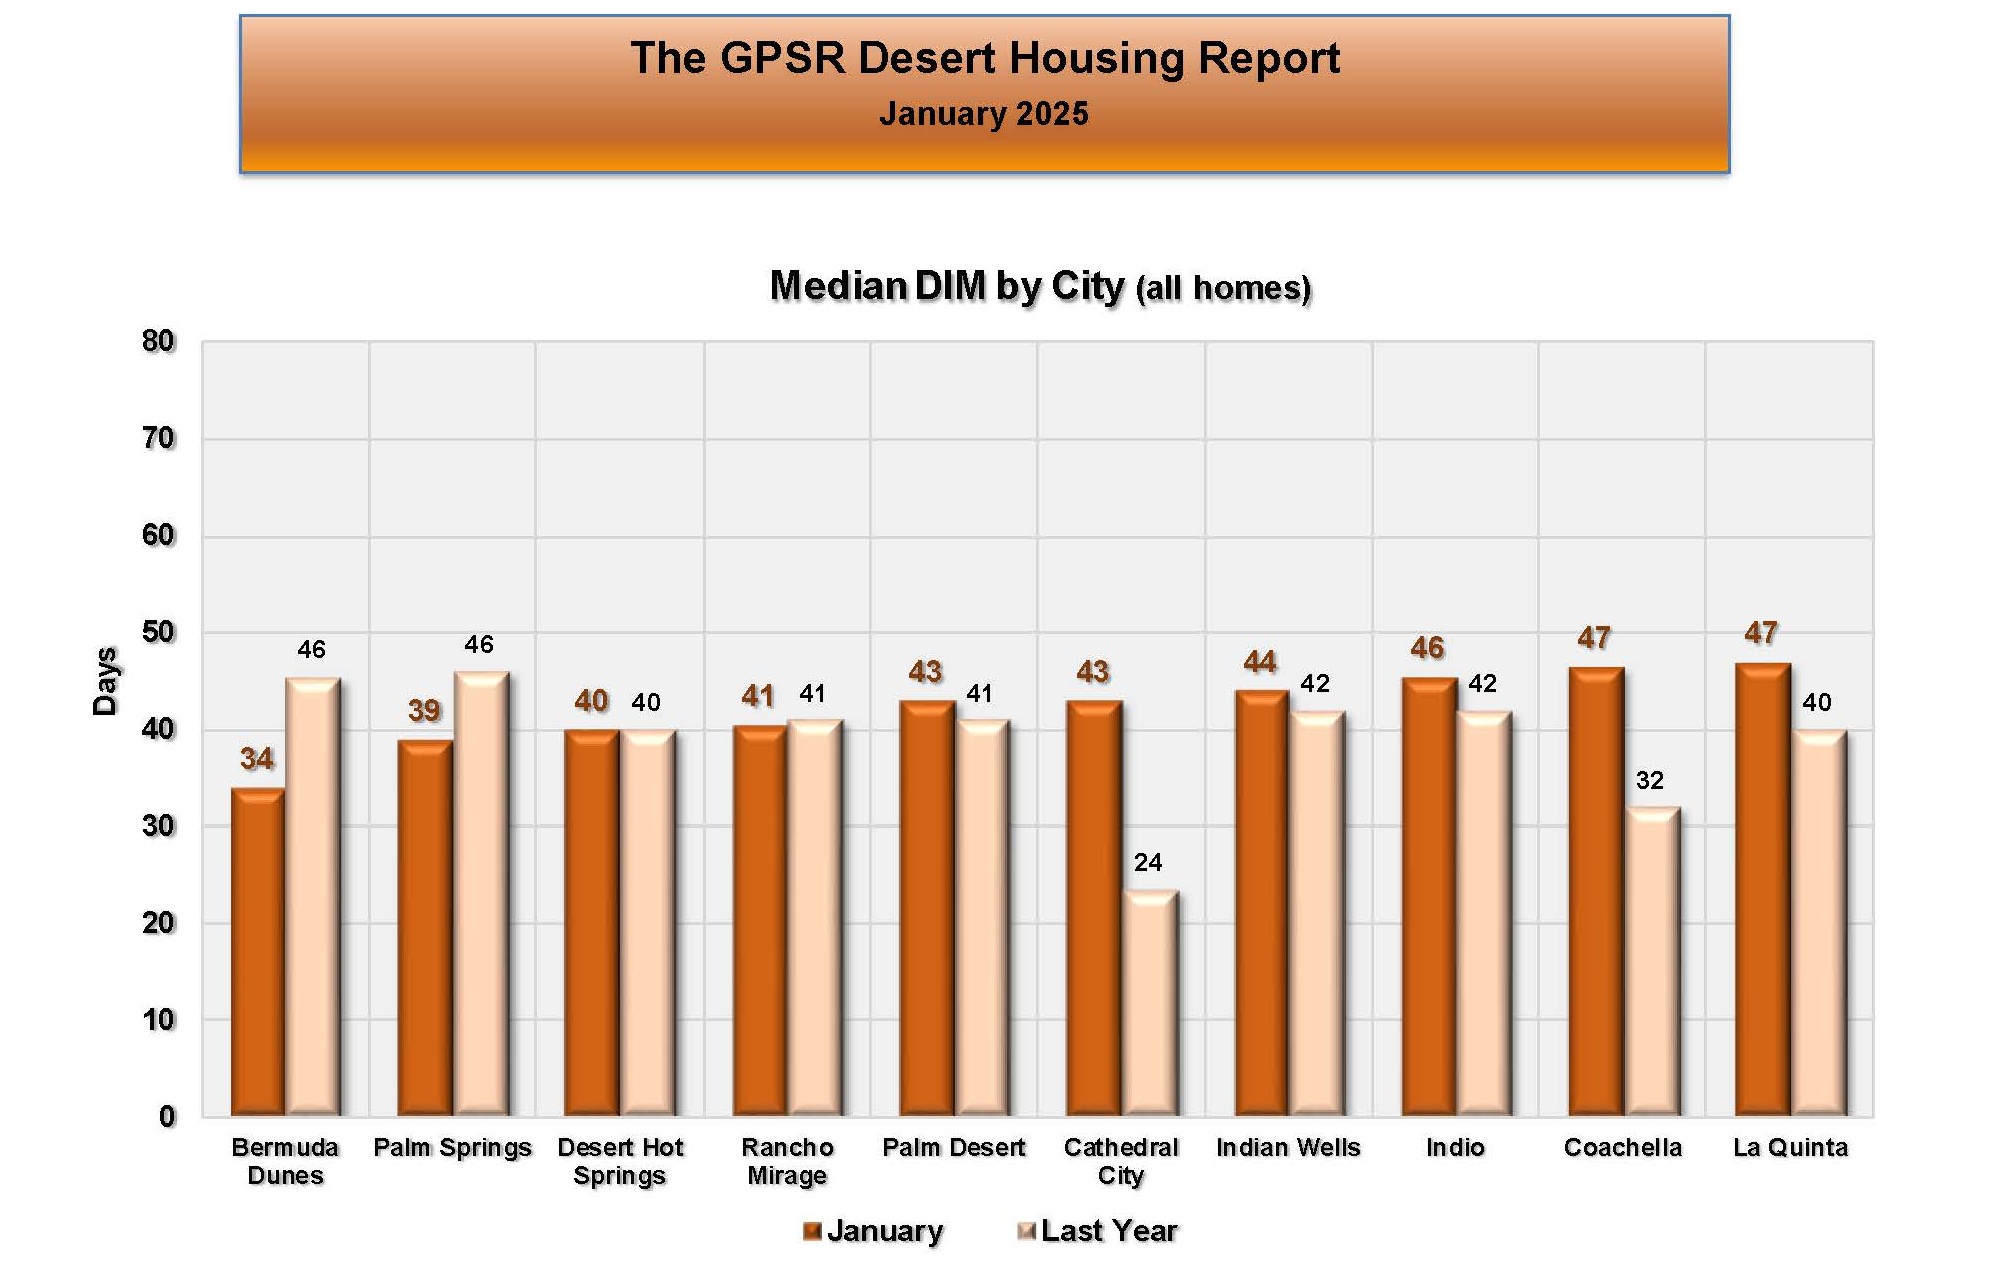 COACHELLA VALLEY JANUARY DAYS IN THE MARKET BY CITY: In the Coachella Valley in January, Bermuda Dunes had the lowest average selling time at just 34 days (down from 46 days in January 2024 but up from 33 days in December 2024). In January, Coachella and La Quinta had the highest average selling time at 47 days (up from 32 days in Coachella in January 2024 and up from 40 days in La Quinta in December 2024).
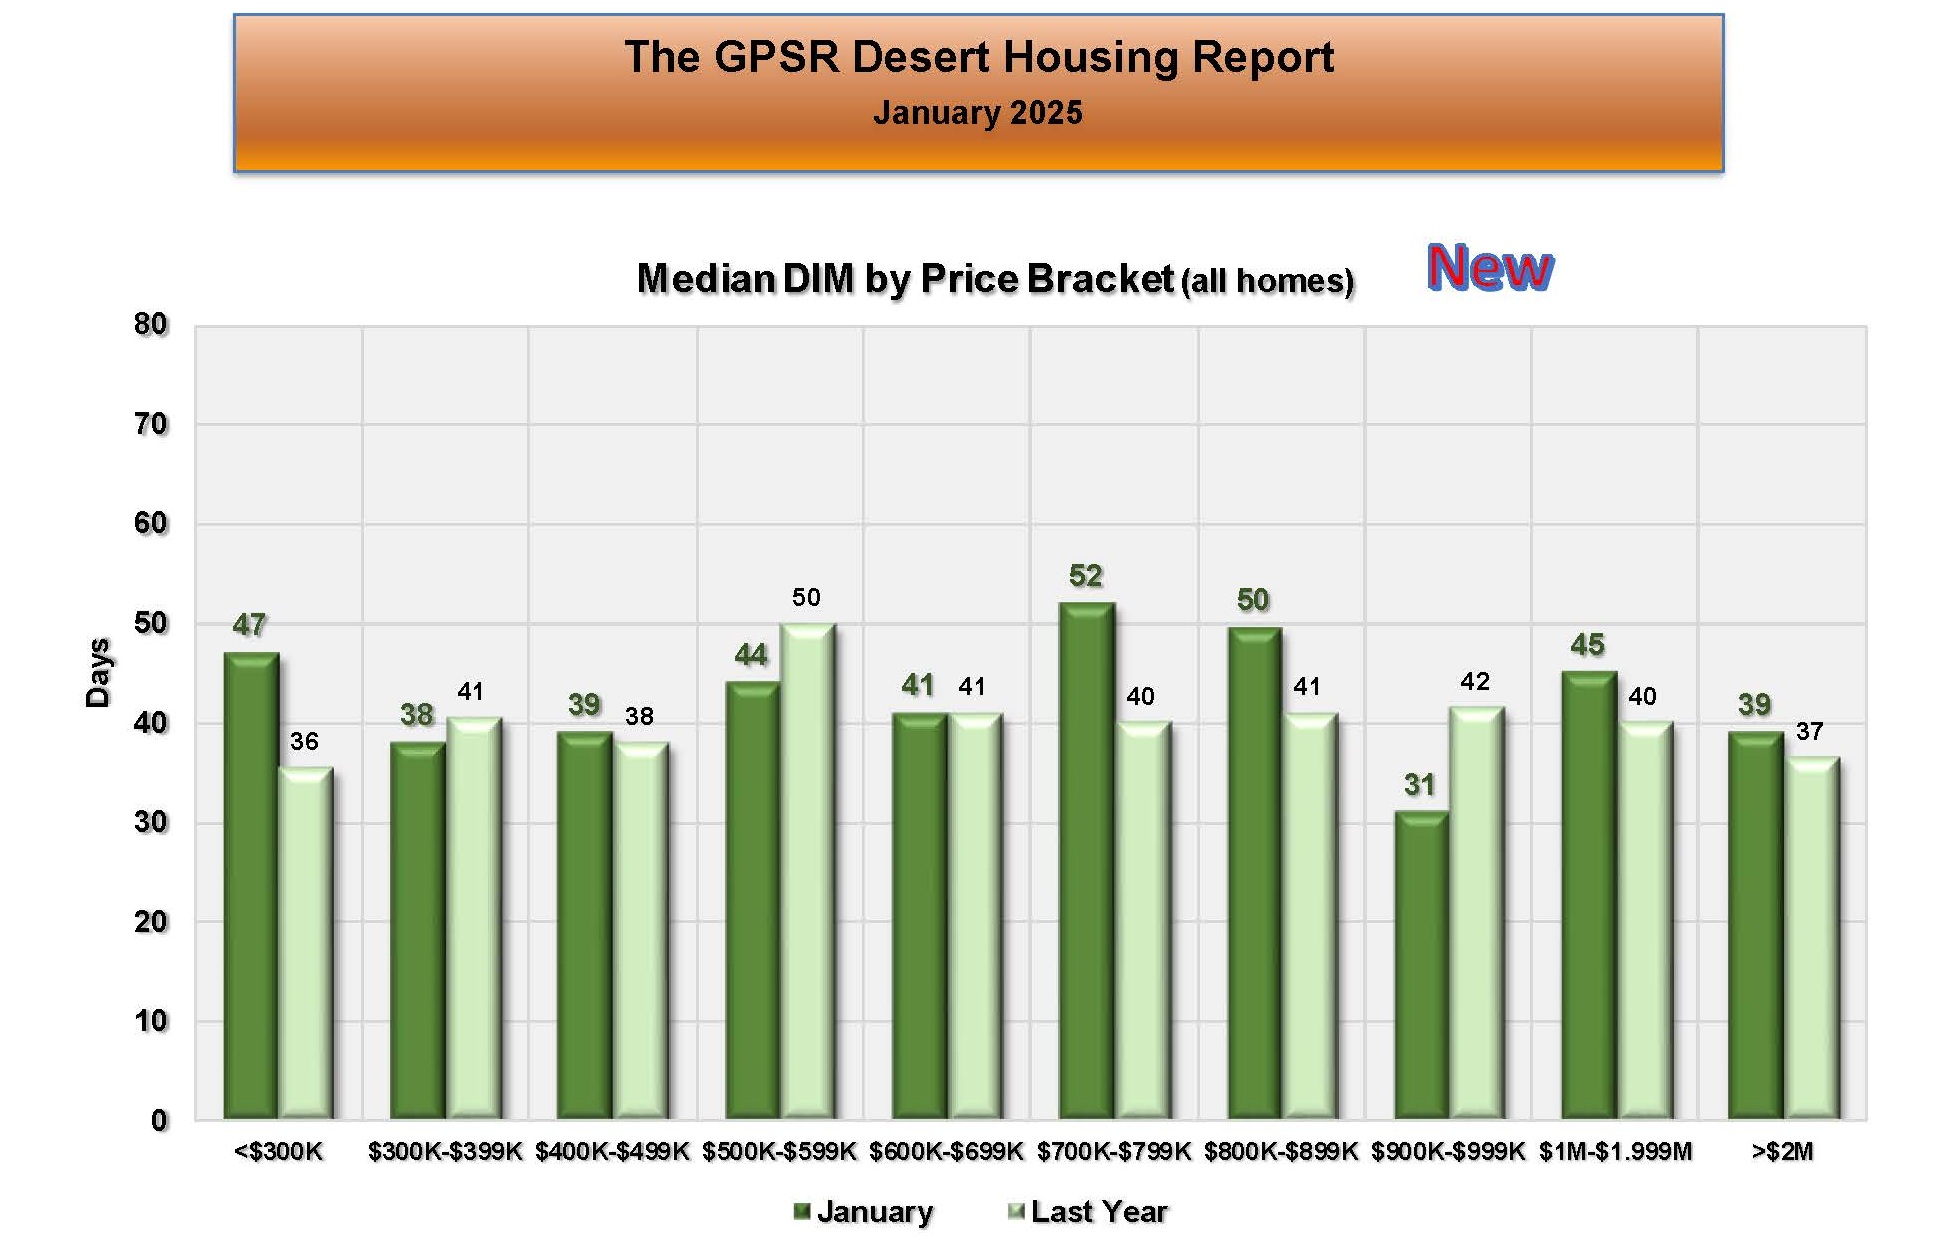 COACHELLA VALLEY JANUARY DAYS IN THE MARKET BY PRICE RANGE: : In the Coachella Valley in January the shortest selling time was for homes priced between $900K and $999K at 31 days (down from 42 days in January 2024 and down from 40 days in December 2024). In January, the longest selling time was for homes priced between $700K and $799K at 52 days (up from 40 days in January 2024 and up from 46 days in December 2024). Market Watch observed that selling times usually increase with higher priced homes. This was not the case in the current Coachella Valley market, which Market Watch called a positive situation.
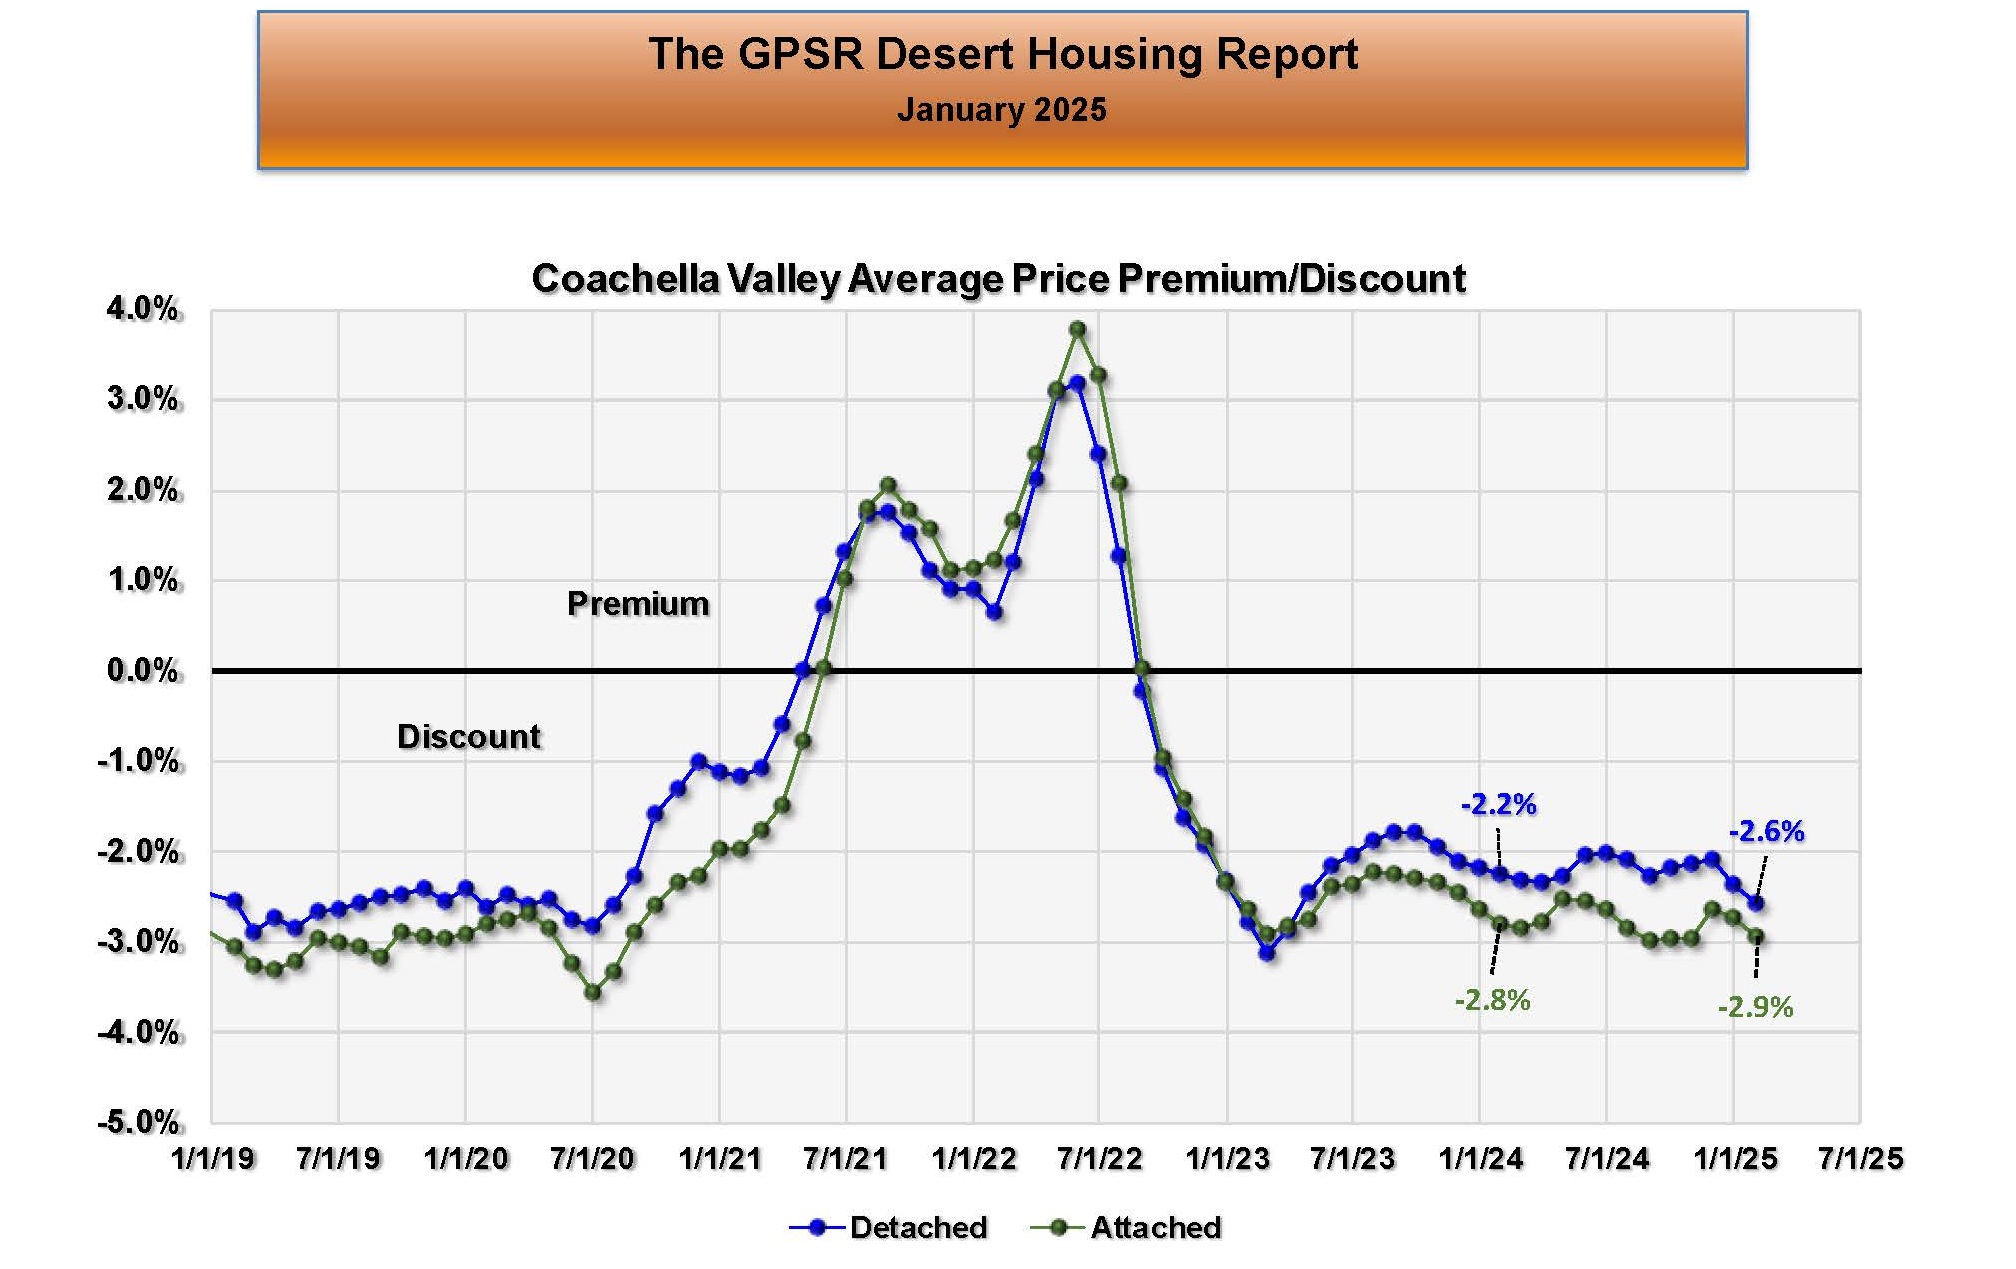 COACHELLA VALLEY JANUARY AVERAGE PRICE PREMIUM/DISCOUNT: In the Coachella Valley in January, detached homes were selling at an average discount of 2.6% (up from 2.2% in January 2024 and up from 2.3% in December 2024). Attached homes were selling at an average 2.9% discount (up from 2.8% in January 2024 and up from 2.7% in December 2024). Market Watch noted that these levels were back to normal pre-pandemic levels.
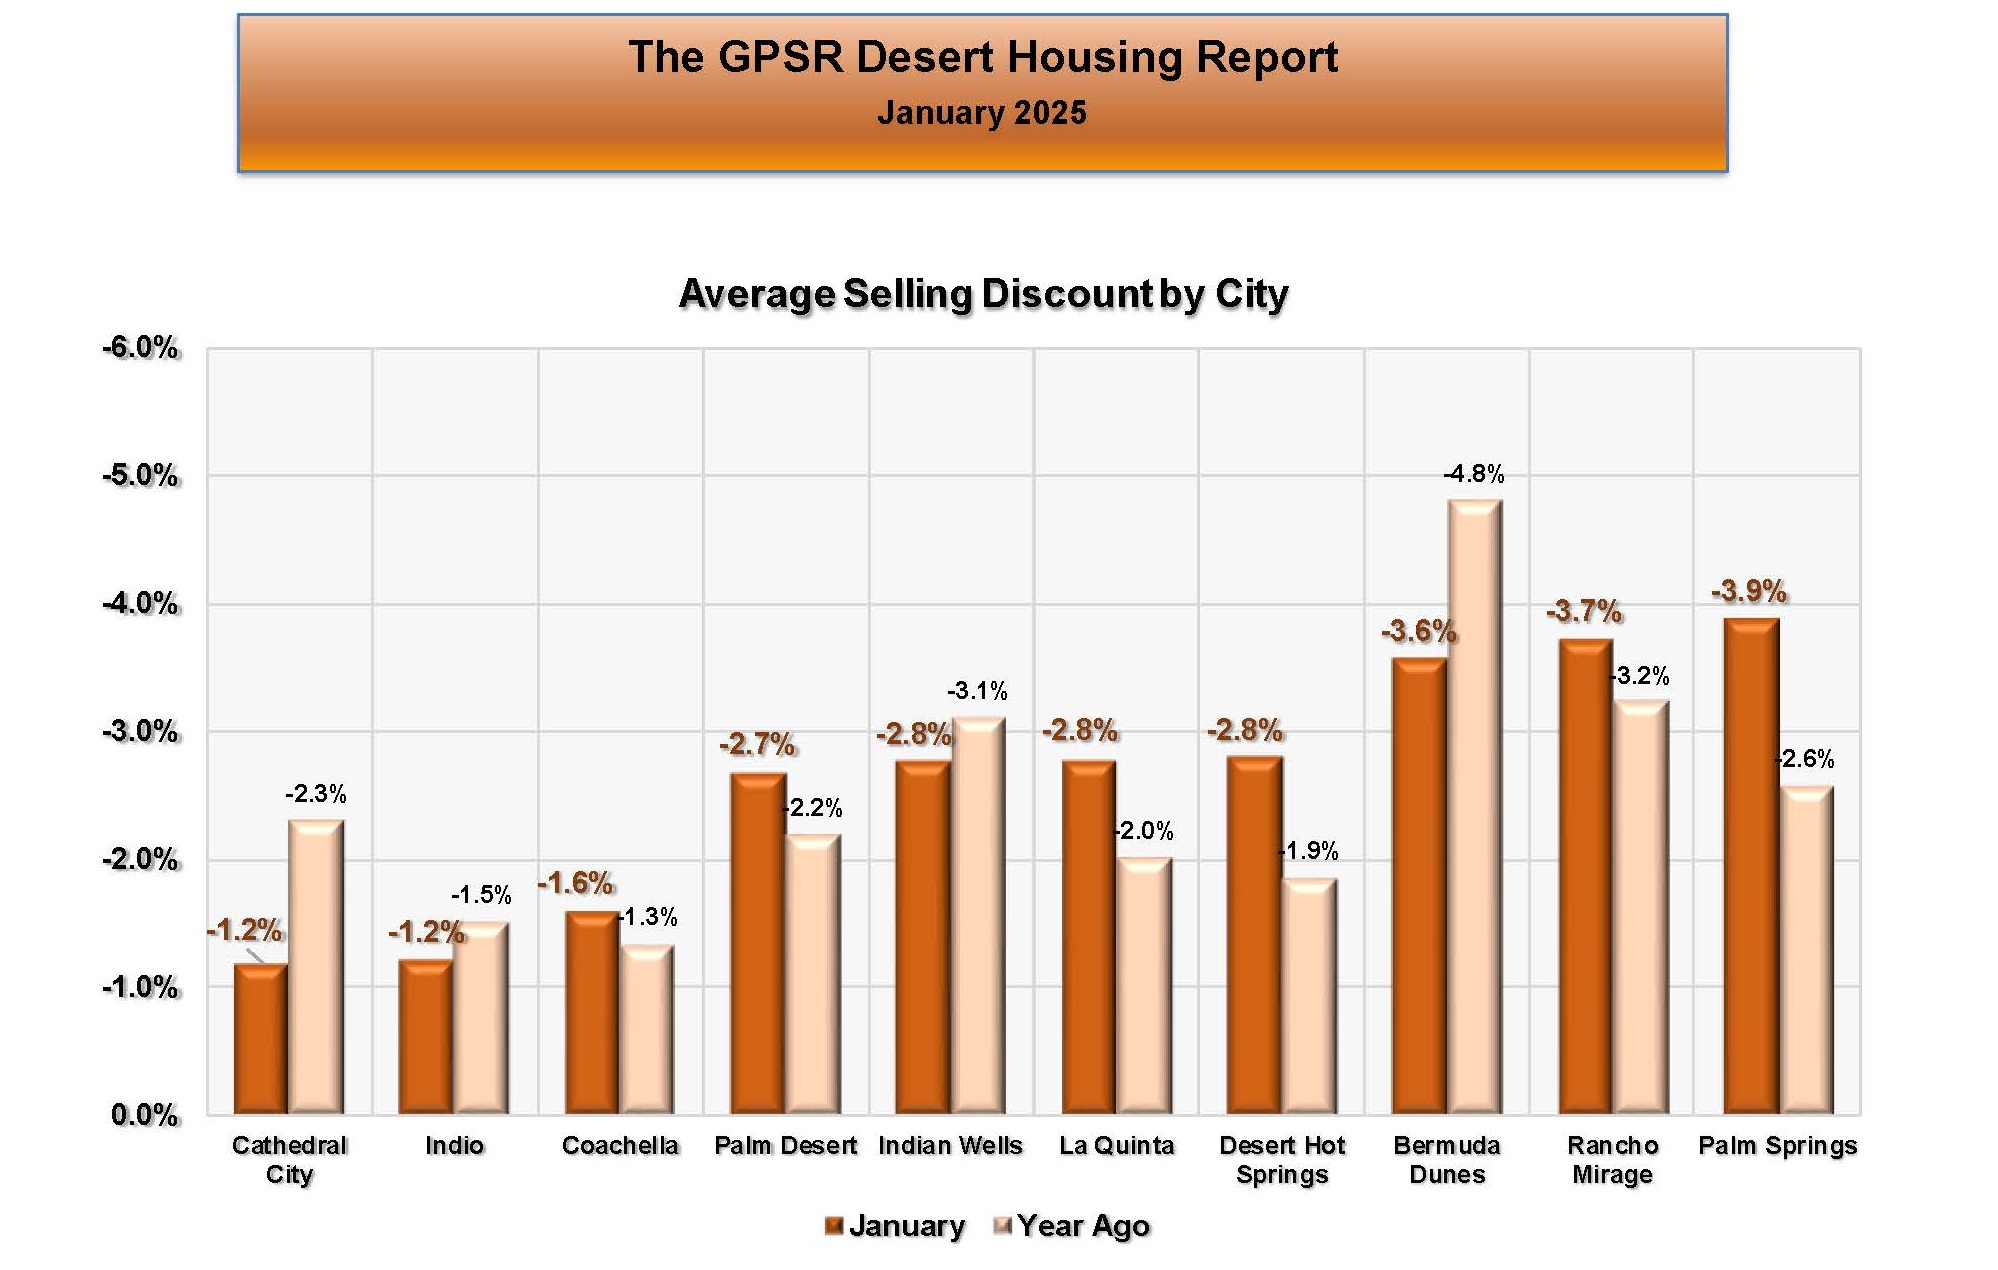 COACHELLA VALLEY JANUARY AVERAGE SELLING DISCOUNT BY CITY: In the Coachella Valley in January, Cathedral City had the smallest average selling discount at 1.2% (down from 2.3% in January 2024 and down from 1.5% in December 2024). In January, Palm Springs had the highest average selling discount at 3.9% (up from 2.6% in January 2024 and up from 3.2% in December 2024).
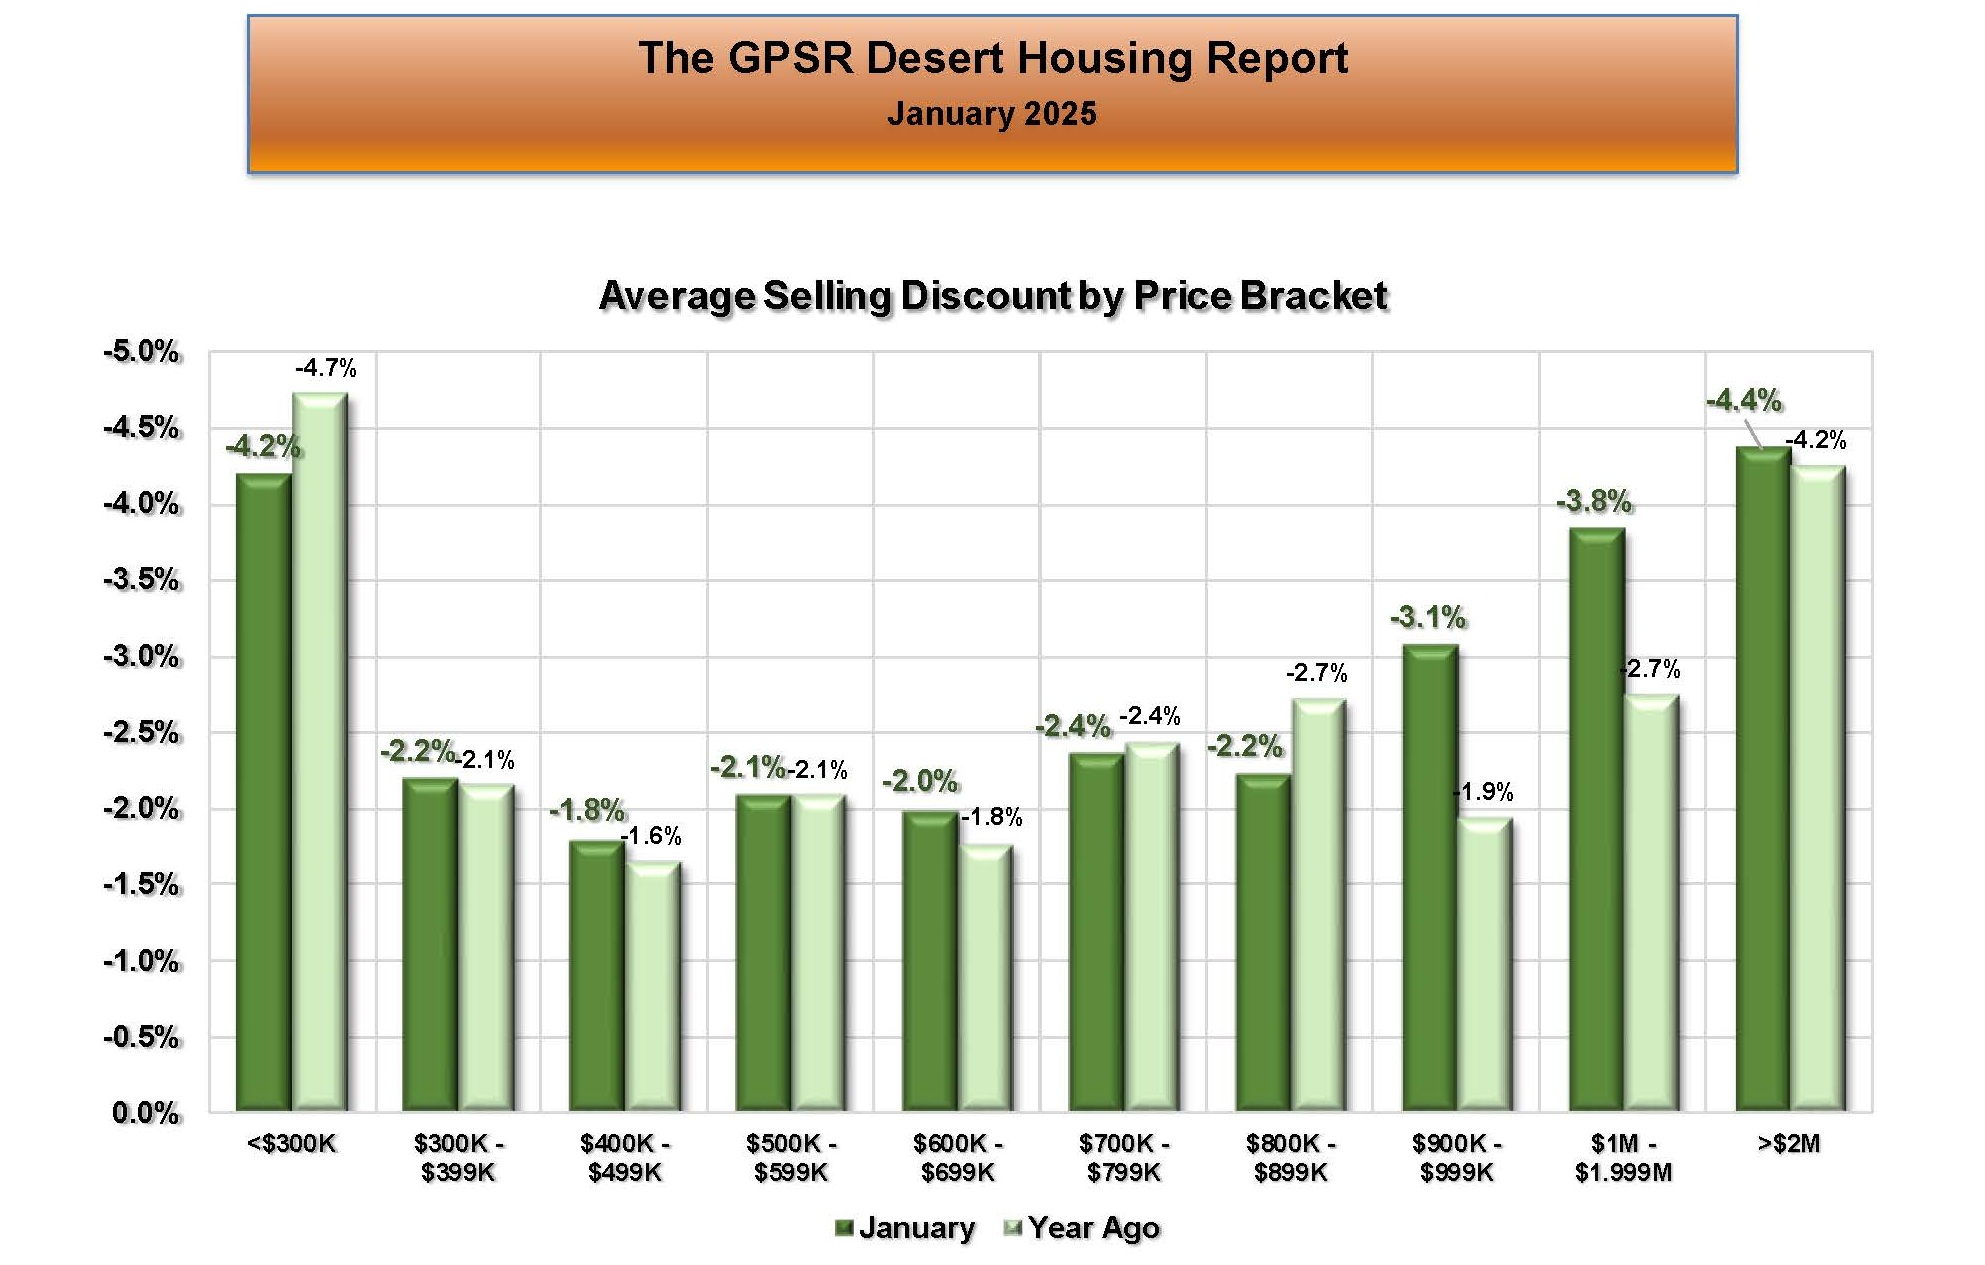 COACHELLA VALLEY JANUARY AVERAGE SELLING DISCOUNT BY PRICE RANGE: In the Coachella Valley in January, the lowest average selling discount was for homes priced between $400K and $499K at 1.8% (up from 1.6% in January 2024 but down from 2% in December 2024). The highest average selling discount was for homes priced over $2 million at 4.4% (up from 4.2% in January 2024 and up from 4.3% in December 2024).
 COACHELLA VALLEY JANUARY PERCENTAGE OF HOMES SELLING OVER LIST PRICE: In the Coachella Valley in January, the percentage of homes selling over list price was 10.8% (down from 14.2% in January 2024 and down from 13.1% in December 2024). Market Watch noted that the percentage of homes selling above list price was now back to pre pandemic levels.
 THE BRIGGS GROUP | COLDWELL BANKER | Laurie Briggs - DRE# 01896117 | Tim Briggs - DRE# 01898254 | Coldwell Banker Realty - DRE# 00616212