Our local real estate market experts, Market Watch LLC, just released their January 2026 GPSR Desert Housing Report. Some highlights, courtesy of the Greater Palm Springs Realtors®: 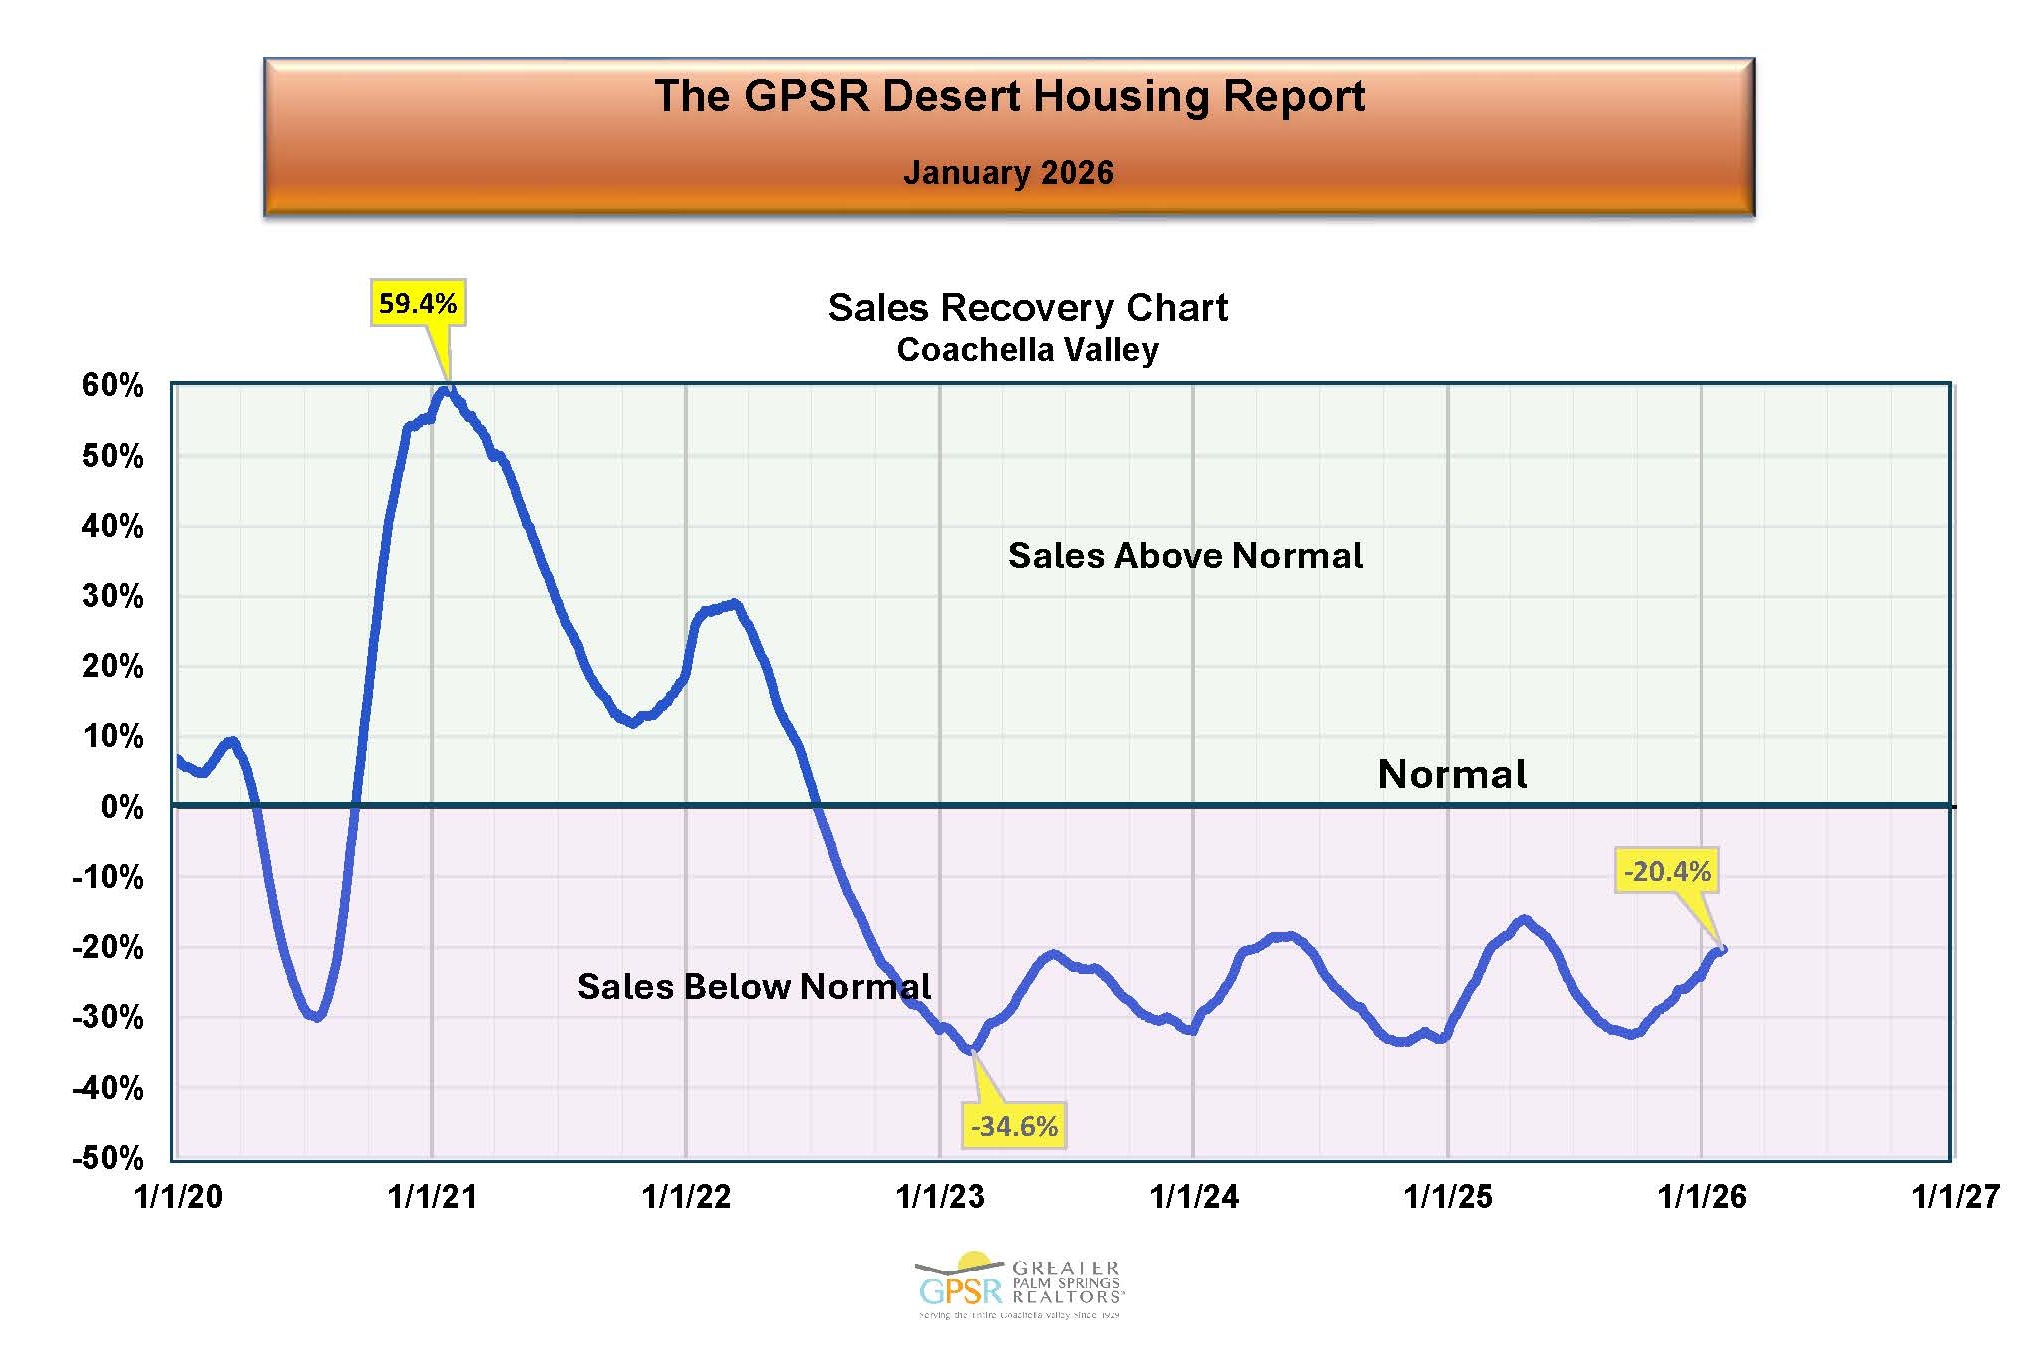 COACHELLA VALLEY JANUARY SALES RECOVERY: In January, Coachella Valley home sales remained below pre-pandemic average normal January home sales (calculated over the years 2016, 2017, 2018 and 2019). Sales recovery improved compared to last year, with sales approximately 20.4% below normal, an improvement from 34.6% below normal in January 2025.
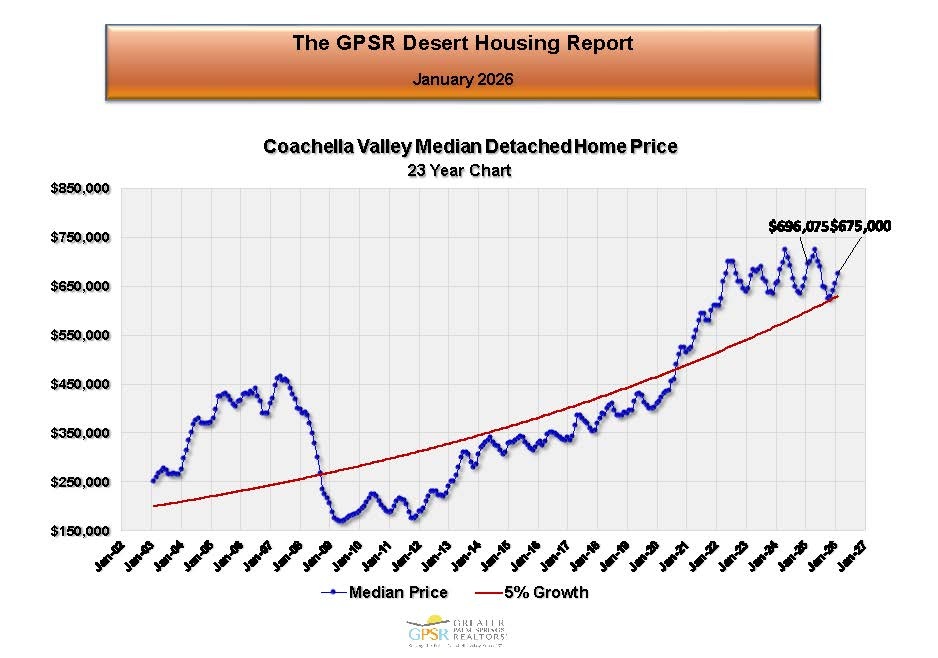 COACHELLA VALLEY JANUARY DETACHED HOME MEDIAN PRICE: The median price of a detached home in the Coachella Valley ended January at $675,000, representing a 3.0% year-over-year decrease from $696,075 in January 2025. Market Watch commented that detached home prices typically reach seasonal lows in Autumn and highs in Spring, and that overall pricing continues to reflect that the detached home price increases during the pandemic are being maintained.
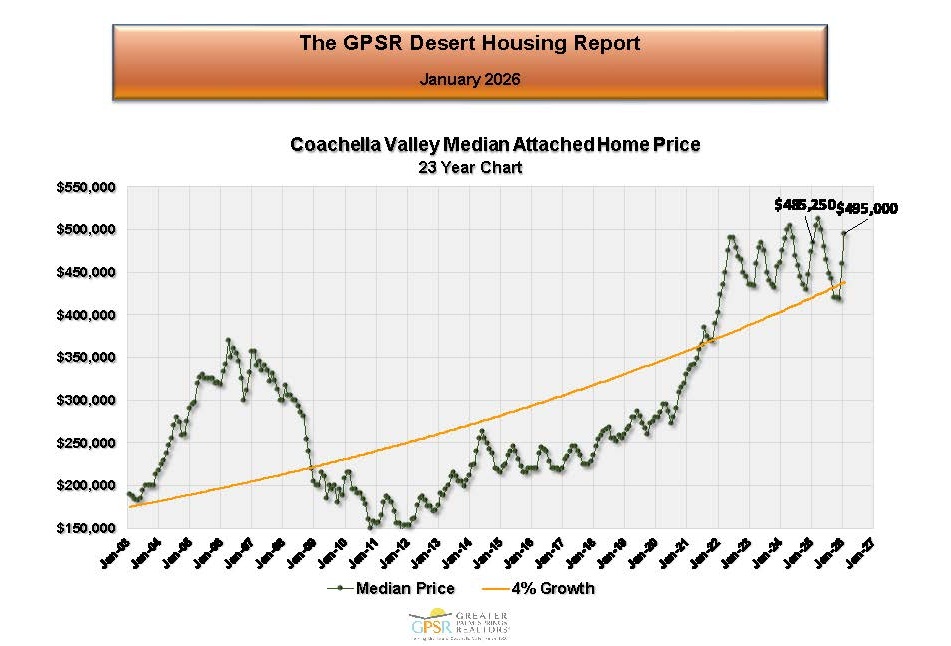 COACHELLA VALLEY JANUARY ATTACHED HOME MEDIAN PRICE: The median price of an attached home in the Coachella Valley ended January at $495,000, reflecting a 2.0% year-over-year increase from $485,250 in January 2025. Market Watch noted that while attached home prices show wider seasonal swings than detached homes, they have continued to follow a similar seasonal pattern to that for detached homes.
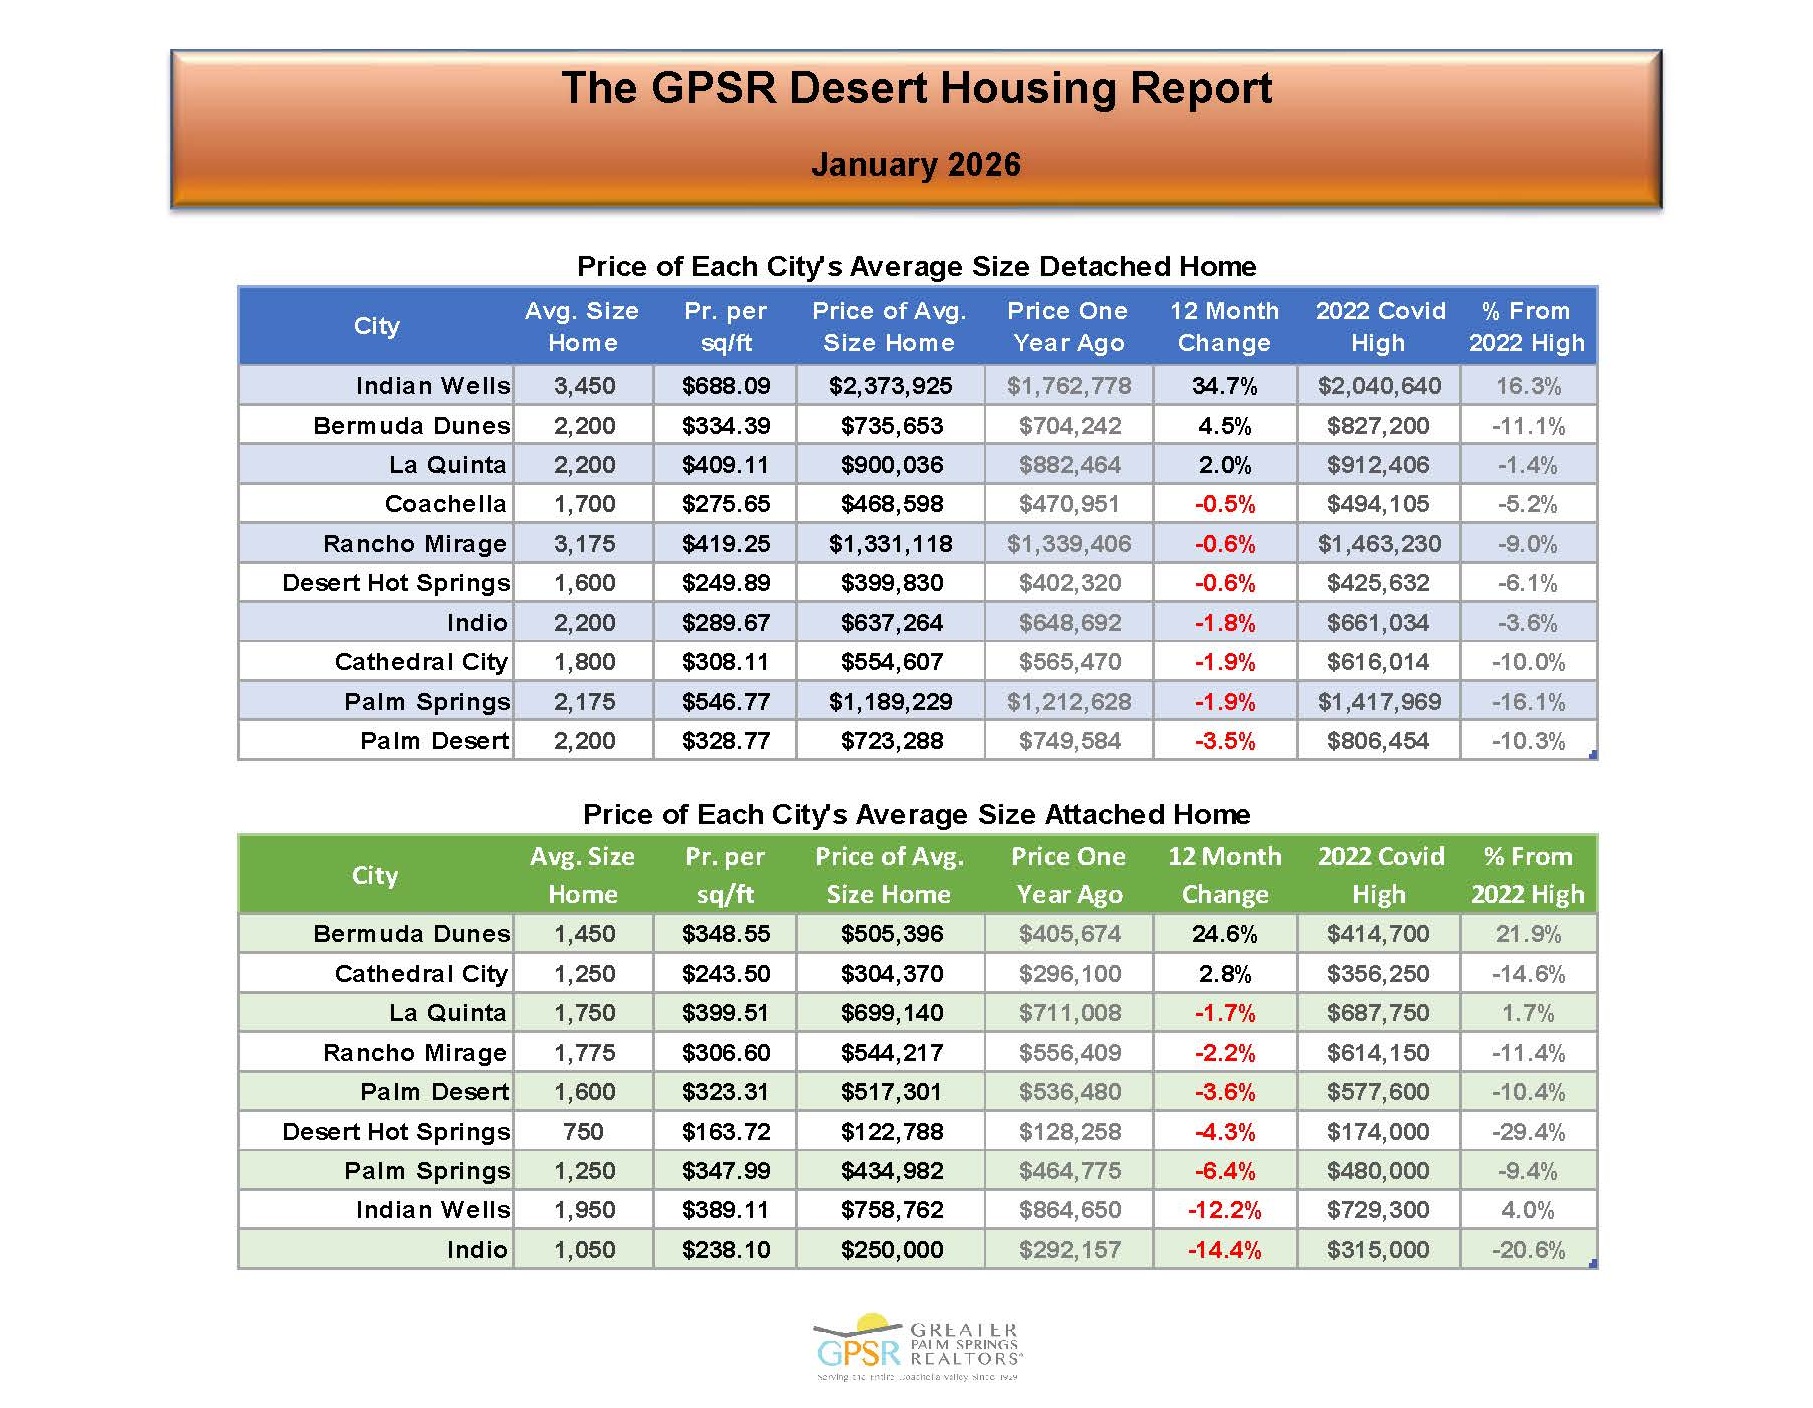 COACHELLA VALLEY JANUARY ANNUAL CHANGE IN PRICE OF AVERAGE SIZE HOMES BY CITY: In January, annual price changes for average-size detached homes ranged from an increase of 34.7% for the average size 3,450 sq ft detached home in Indian Wells (increasing to $2,373,926 from $1,762,778 in January 2025) to a decrease of 3.5% for the average size 2,200 sq ft detached home in Palm Desert (decreasing to $723,288 from $749,584 in January 20025). For attached homes, annual price changes for average-size attached homes ranged from an increase of 24.6% for the average size 1,450 sq ft attached home in Bermuda Dunes (increasing to $505,396 form $405,674 in January 2025) to a decrease of 14.4% for the average size 1,050 sq ft attached home in Indio (decreasing to $250,000 from $292,157 in January 2025).
 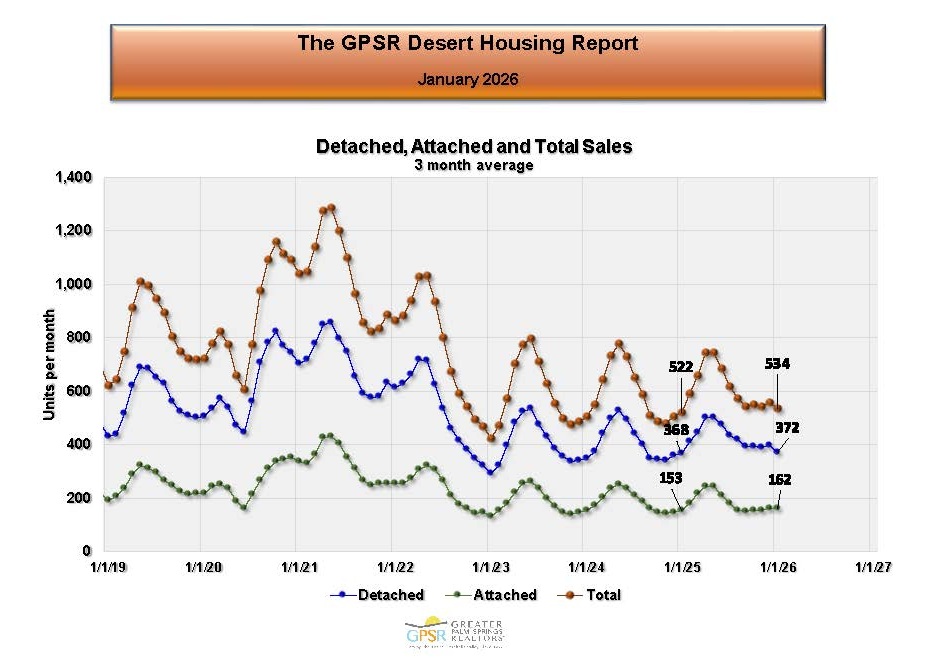 COACHELLA VALLEY JANUARY AVERAGE MONTHLY HOME SALES (THREE-MONTH AVERAGE): The Coachella Valley’s three-month average of total home sales was 534 homes, up 2.4% from 522 average home sales in January 2025. Market Watch noted that the sales recovery information above shows where home sales are on a historic basis.
 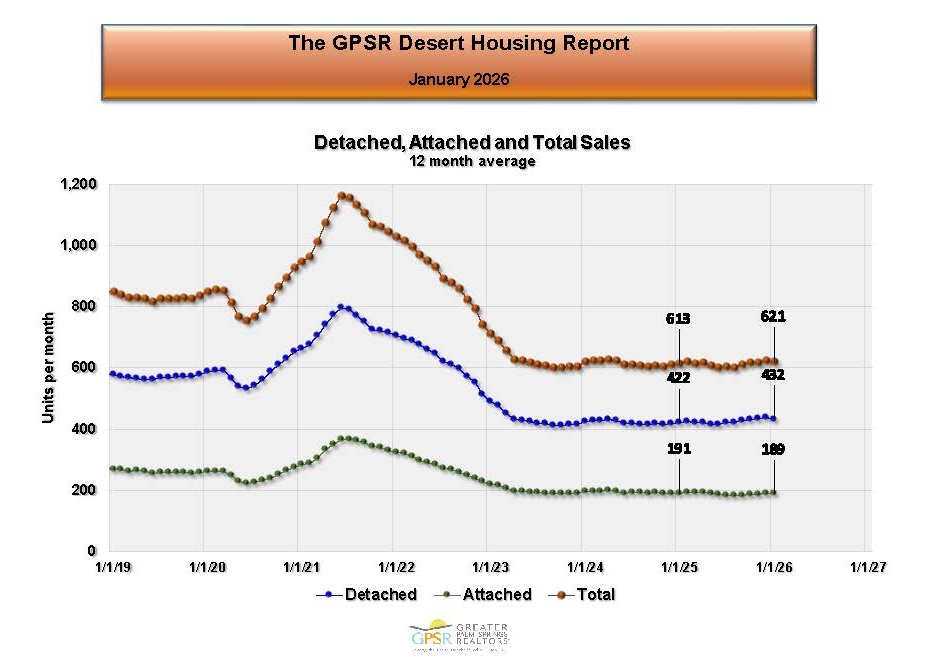 COACHELLA VALLEY JANUARY AVERAGE MONTHLY HOME SALES (TWELVE-MONTH AVERAGE): The twelve-month average of Coachella Valley home sales in January (which removes seasonality from the data) was 621 home sales per month, modestly higher than 613 average home sales per month in January 2025. Market Watch commented that despite moderating inflation, interest-rate uncertainty continues as the Federal Reserve Board waits to determine the effect of the administration’s economic policies.
 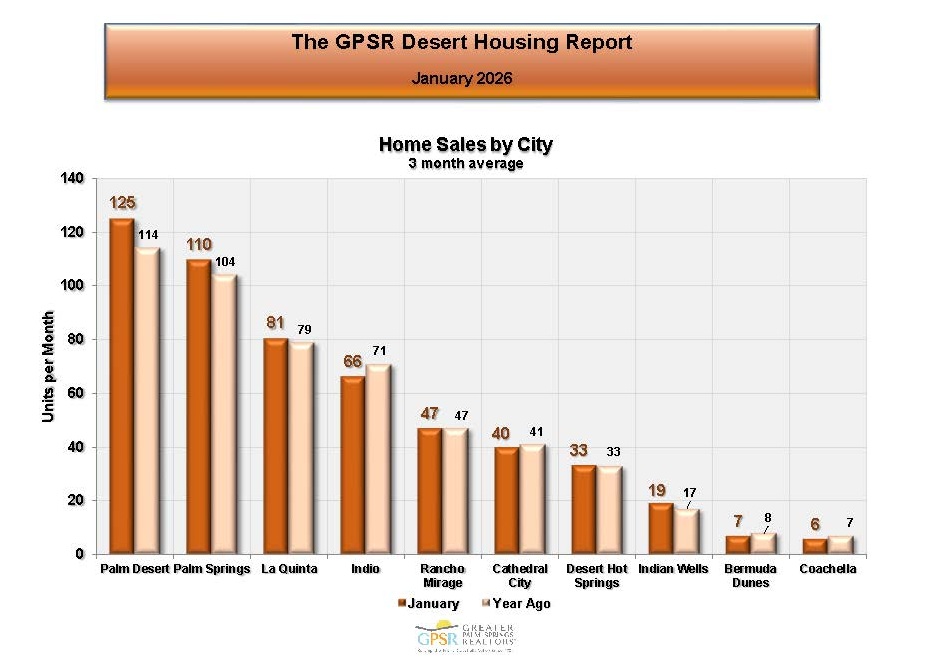 COACHELLA VALLEY JANUARY AVERAGE MONTHLY HOME SALES BY CITY: In January, Palm Desert recorded the highest average monthly home sales at 125 homes (up 9.7% from 114 homes in January 2025), followed by Palm Springs with 110 home sales (up 5.8% from 104 homes in January 2025) and La Quinta with 81 home sales (up 2.5% from 79 homes in January 2025). Coachella recorded the lowest average monthly home sales at 6 homes (down slightly from 7 home sales in January 2025.
 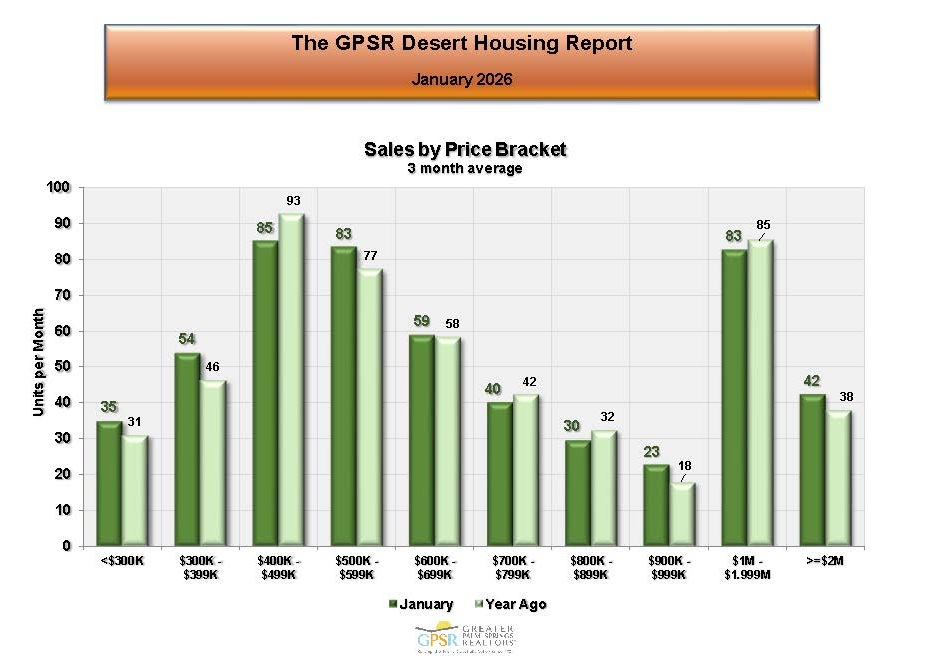 COACHELLA VALLEY JANUARY AVERAGE MONTHLY HOME SALES BY PRICE RANGE: In January, the Coachella Valley’s strongest average monthly home sales activity was 85 home sales in the $400,000–$499,000 range (down from 93 average monthly home sales in January 2025), followed by average monthly home sales of 83 homes in both the $500,000–$599,000 range (up from 77 average monthly home sales in January 2025) and the $1 million–$1.999 million range (down slightly from 85 average monthly home sales in January 2025). The lowest average monthly home sales activity was 23 homes in the $900,000–$999,000 range (up from 18 average monthly home sales in January 2025)
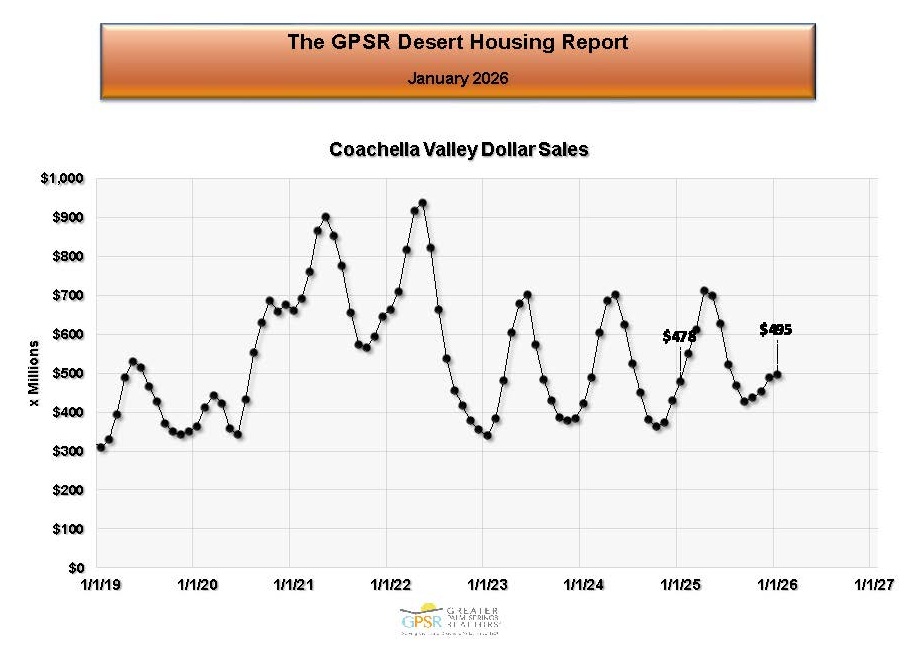 COACHELLA VALLEY JANUARY AVERAGE MONTHLY HOME SALES IN DOLLARS: Average monthly Coachella Valley home sales in January totaled $495 million, up 3.6% from home sales of $478 million in January 2025.
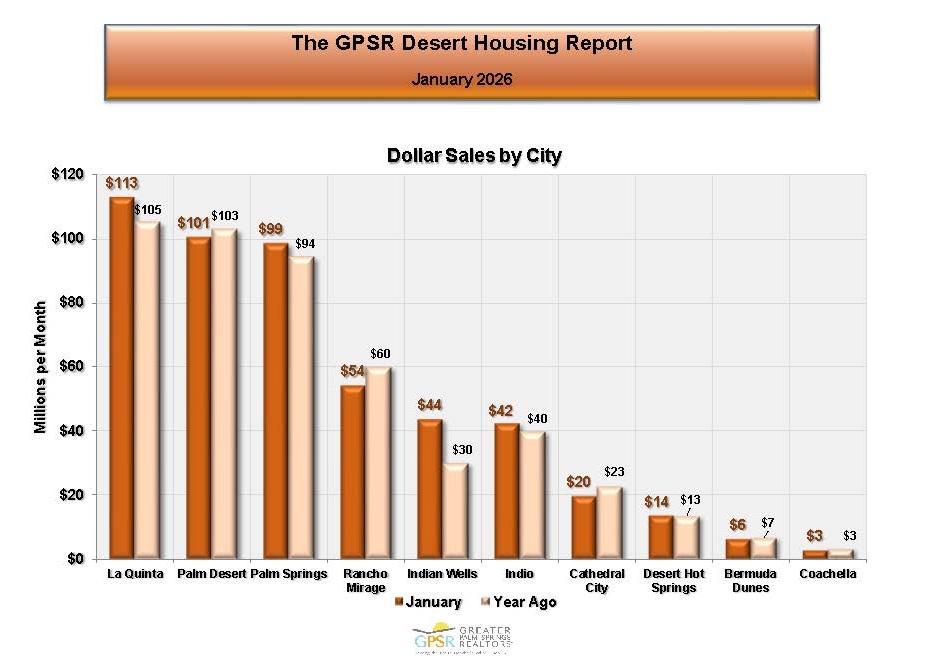 COACHELLA VALLEY JANUARY AVERAGE MONTHLY HOME SALES IN DOLLARS BY CITY: In January, La Quinta led the Valley with average monthly home sales of $113 million (up 7.6% from home sales of $105 million in January 2025), followed by Palm Desert with average monthly home sales of $101 million (down 1.9% from home sales of $103 million in January 2025) and then Palm Springs with average monthly home sales of $99 million (up 5.3% from home sales of $94 million in January 2025). Coachella posted the lowest dollar volume of average monthly home sales at $3 million (unchanged from January 2025).
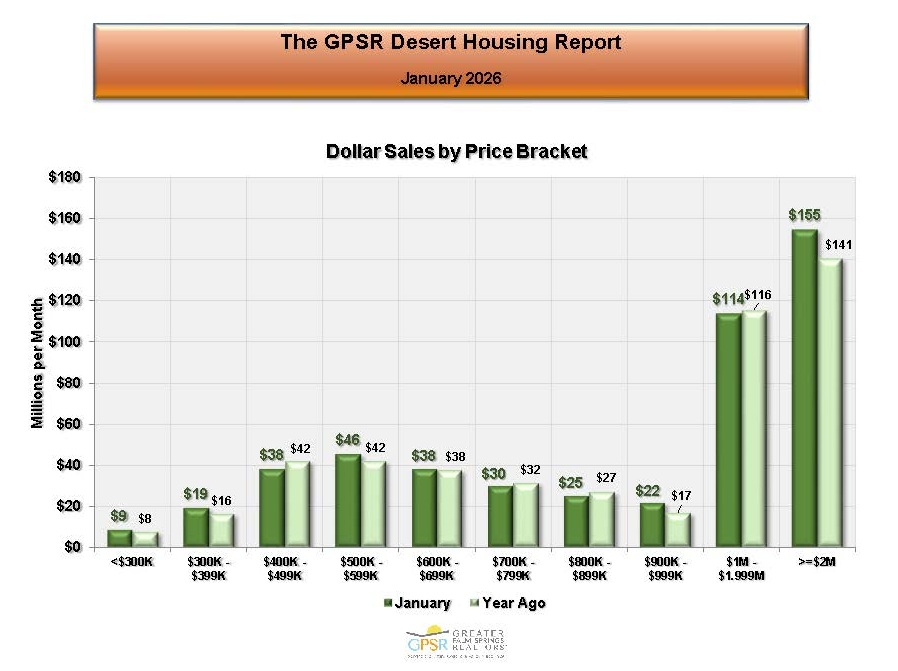 COACHELLA VALLEY JANUARY AVERAGE MONTHLY HOME SALES IN DOLLARS BY PRICE RANGE: In January, Coachella Valley homes priced over $2 million generated the highest dollar volume home sales at $155 million (up 9.9% from sales of $141 million in January 2025), followed by homes priced between $1 million and $1.999 million at $114 million (down slightly from sales of $116 million in January 2025). Market Watch pointed out that home sales in these two price ranges accounted for 54.3% of all total dollar sales of homes in the Coachella Valley in January.
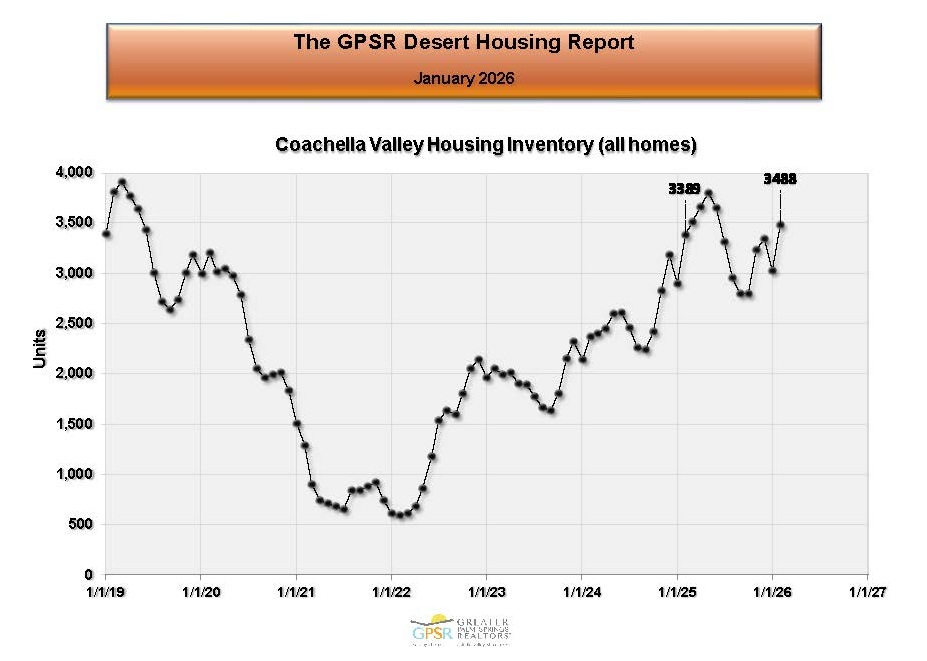 COACHELLA VALLEY FEBRUARY 1ST INVENTORY: On February 1st, total Coachella Valley housing inventory stood at 3,488 homes, an increase of 2.9% from 3,389 homes on February 1st, 2025. Market Watch noted that inventory levels on February 1st were near pre-pandemic norms.
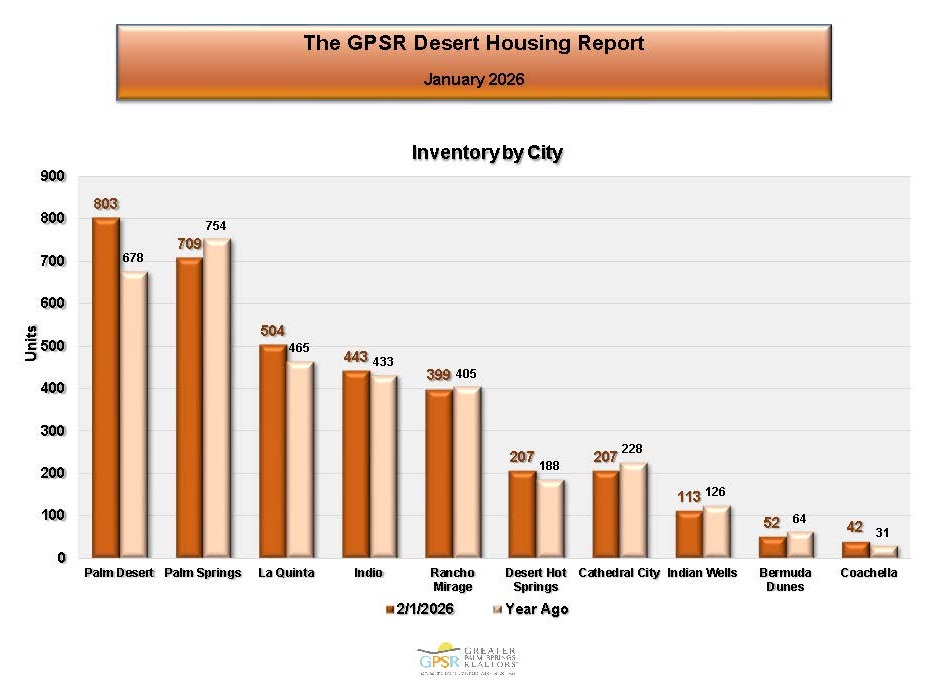 COACHELLA VALLEY FEBRUARY 1ST INVENTORY BY CITY: On February 1st, Palm Desert reported the highest inventory levels at 803 homes (up 18.4% from 678 homes on February 1st, 2025), followed by Palm Springs at 709 homes (down 7.2% from 754 homes on February 1st, 2025). Coachella posted the lowest inventory at 42 homes (up 35.5% from 31 homes on February 1st, 2025). Market Watch noted that this data helps identify cities with heightened seller interest and activity.
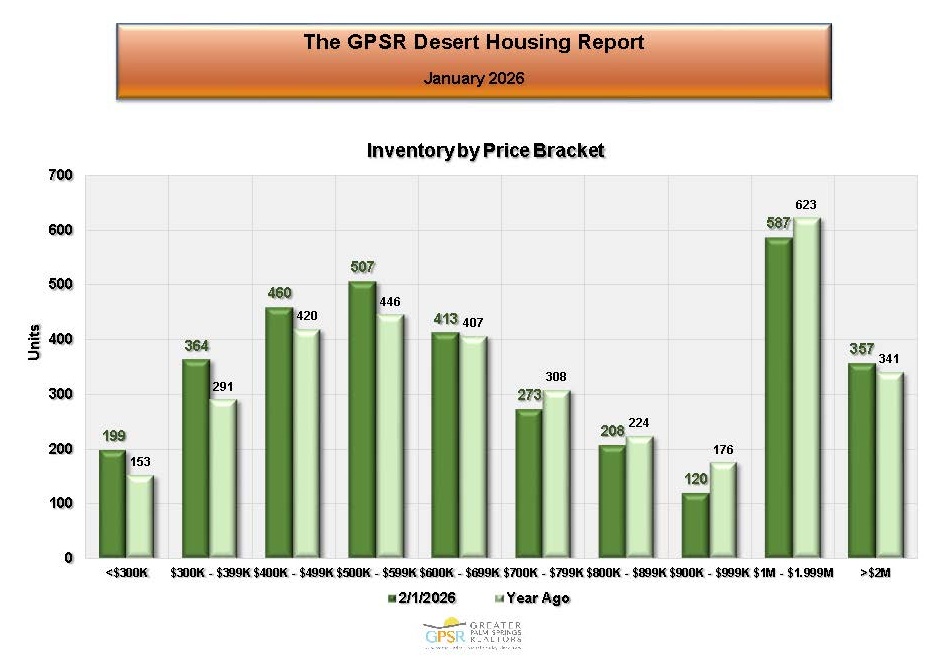 COACHELLA VALLEY FEBRUARY 1ST INVENTORY BY PRICE RANGE: On February 1st, the largest inventory concentration in the Coachella Valley was for homes in the $1 million to $1.999 million range at 587 homes (down 5.8% from 623 homes on February 1st, 2025). The lowest inventory was for homes in the $900,000 to $999,000 price range at 357 homes (up 4.7% from 341 homes on February 1st, 2025).
 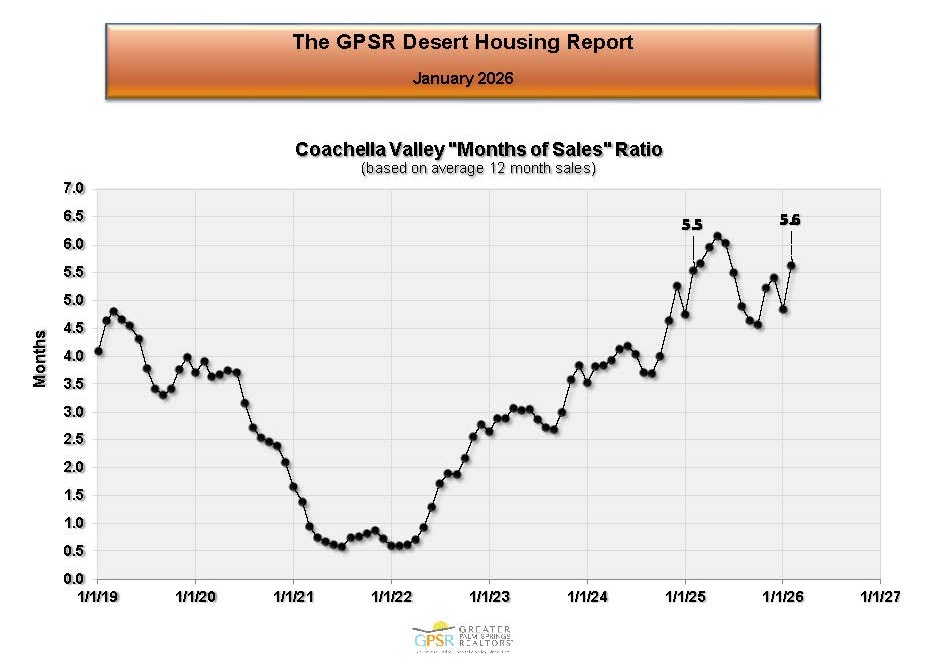 COACHELLA VALLEY FEBRUARY 1ST MONTHS OF SALES RATIO: On February 1st, the Coachella Valley’s months-of-sales ratio was 5.6 months, slightly higher than the 5.5 months of sale ratio on February 1st, 2025. Market watch noted that this fundamental ration which measures supply and demand was above pre-pandemic levels, indicating a gradual shift toward a more supply-heavy market.
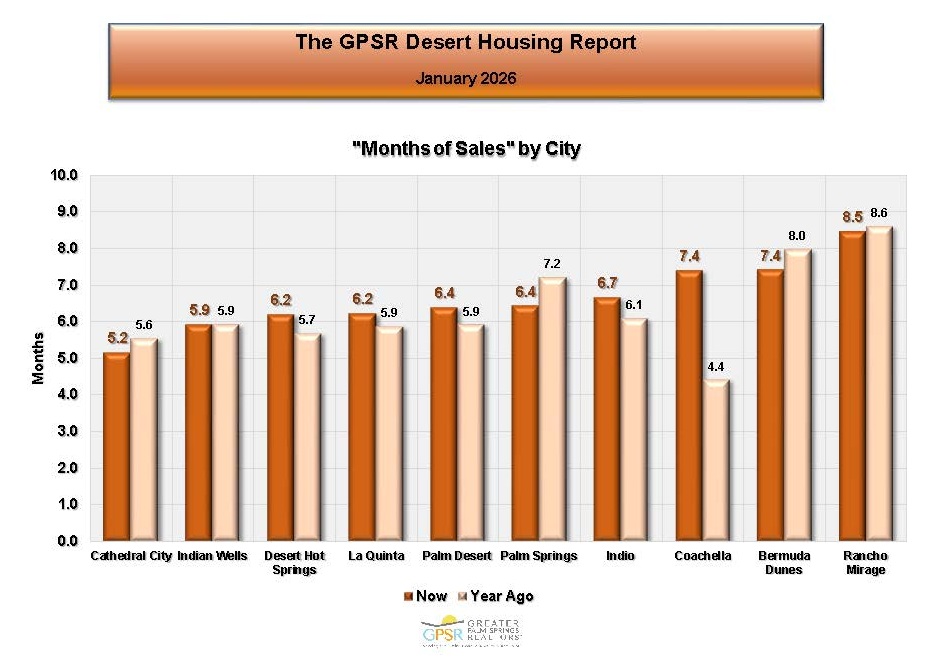 COACHELLA VALLEY FEBRUARY 1ST MONTHS OF SALES RATIO BY CITY: On February 1st, Rancho Mirage recorded the highest months of sales ratio at 8.5 months (down slightly from 8.6 months on February 1st, 2025). Cathedral City posted the lowest months of sales ratio at 5.2 months (down from 5.6 months on February 1st, 2025). The months of sales ration in most of the Coachella Valley’s cities were clustered between 5 and 6 months, reflecting a housing market that was becoming supply-heavy.
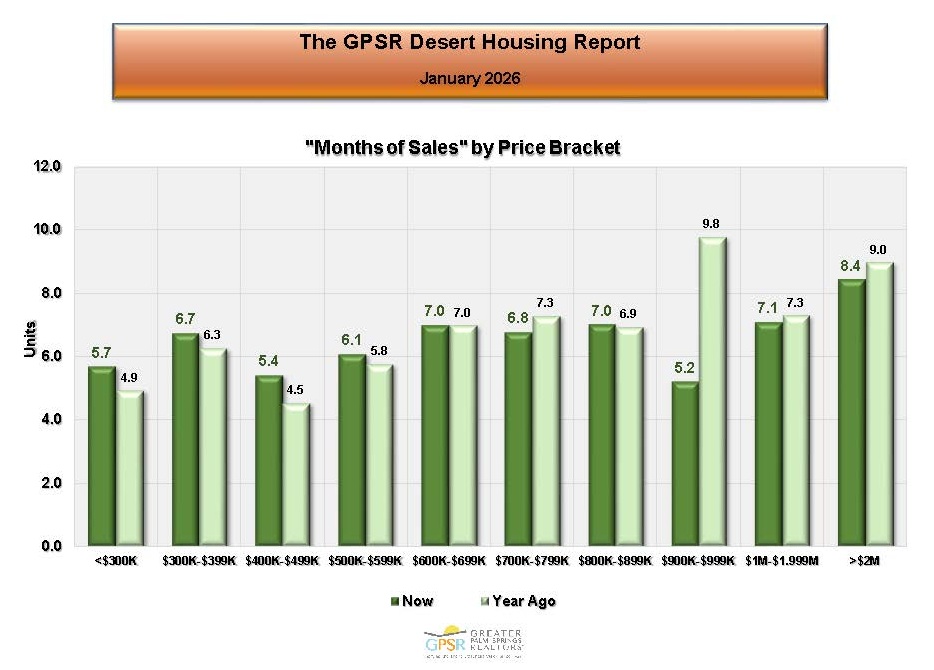 COACHELLA VALLEY FEBRUARY 1ST MONTHS OF SALES RATIO BY PRICE RANGE: On February 1st, Coachella Valley homes priced over $2 million showed the highest months-of-sales ratio at 8.4 months (down from 9.0 months on February 1st, 2025). Homes priced between $900,000 to $999,000 had the lowest months of sales ratio at 5.2 months (down from 9.8 months on February 1st, 2025). Market Watch noted that while supply is increasing, pricing had not yet been materially impacted.
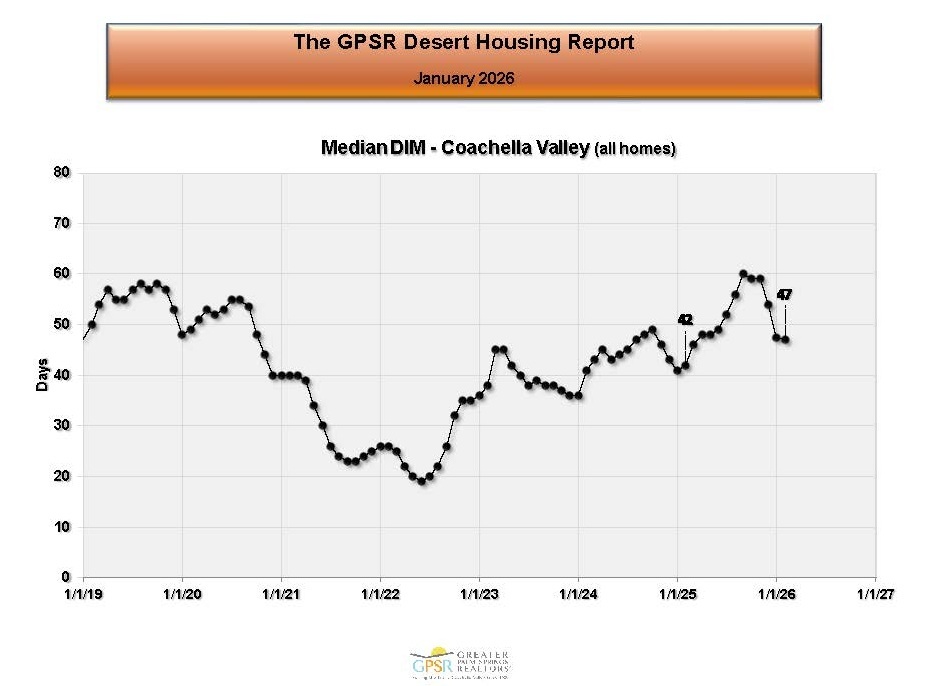 COACHELLA VALLEY JANUARY DAYS IN THE MARKET: At the end of January, the median days on market in the Coachella Valley was 47 days, up slightly from 42 days in January 2025. Market Watch commented that selling times have remained within a relatively narrow range of between 40 and 55 days over the past two years.
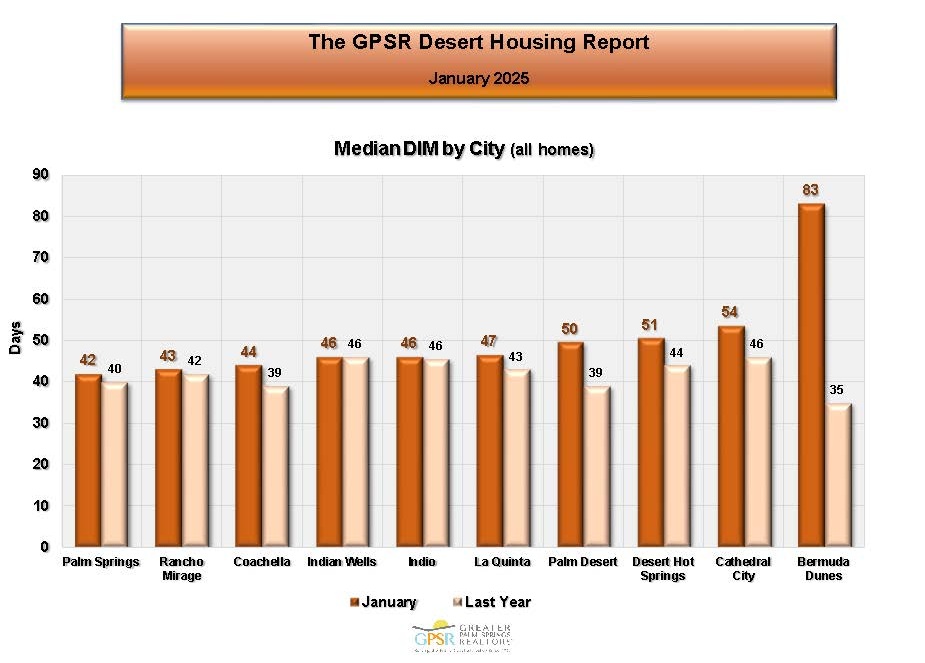 COACHELLA VALLEY JANUARY DAYS IN THE MARKET BY CITY: In January, Palm Springs posted the lowest average selling time in the Coachella Valley at 42 days (up from 40 days in January 2025), followed by Rancho Mirage at 43 days (up slightly from 42 days in January 2025). Bermuda Dunes recorded the longest selling time at 83 days (up significantly from 35 days in January 2025).
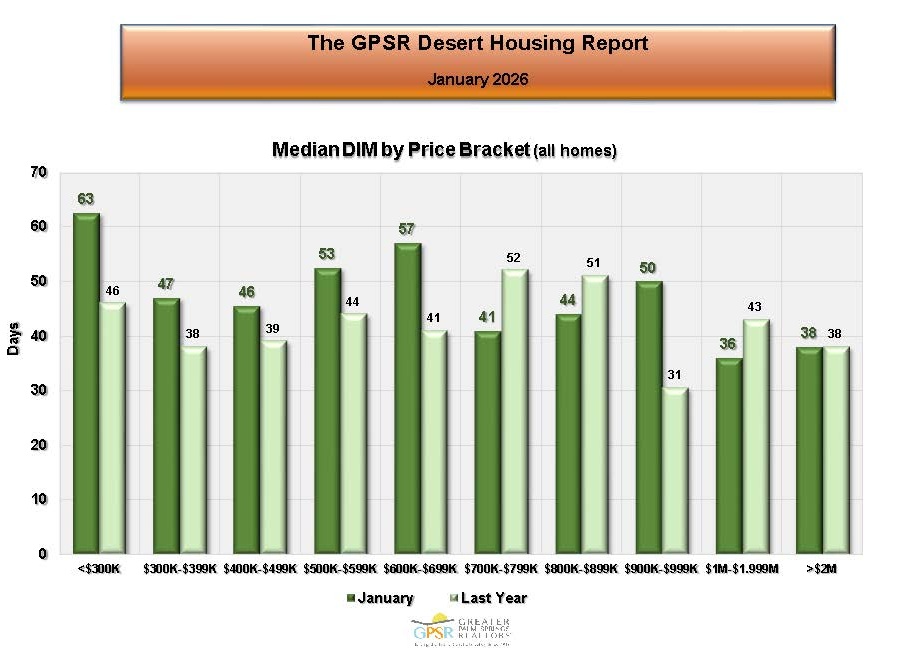 COACHELLA VALLEY JANUARY DAYS IN THE MARKET BY PRICE RANGE
In January, Coachella Valley homes priced between $1 million and $1.999 million sold the fastest with median days in the market of 36 days (down from 43 days in January 2025). , Homes priced under $300,000 took the longest to sell with a median days in the market of 63 days (up significantly from 46 days in January 2025). Market Watch noted that unlike most markets where selling times increase with higher priced homes, in the Coachella Valley in January higher priced homes were selling faster than lower priced homes.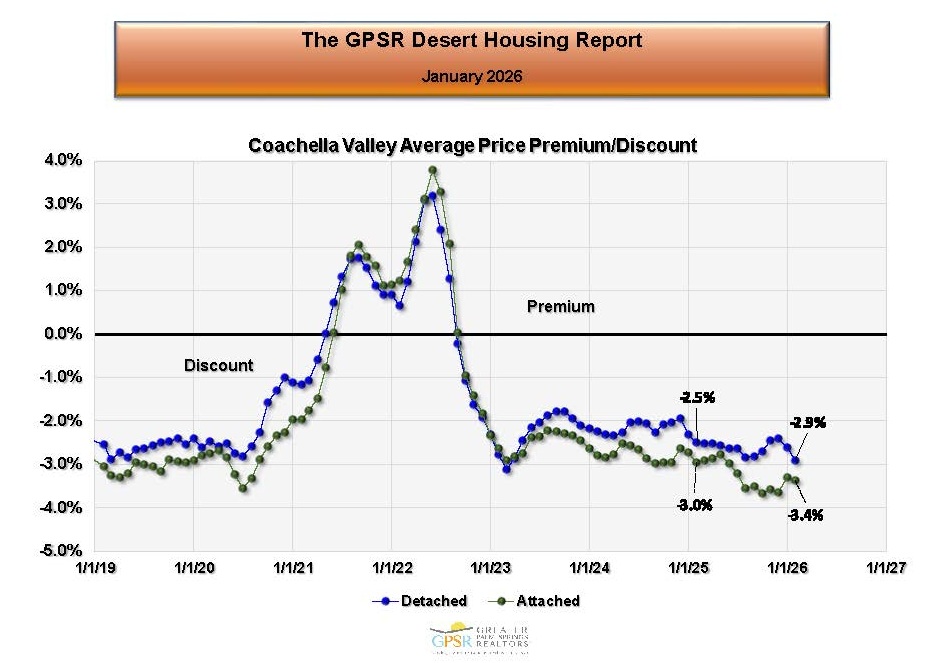 COACHELLA VALLEY JANUARY AVERAGE SELLING PREMIUM/DISCOUNT FROM LIST PRICE: In January, Coachella Valley detached homes were selling at an average discount from list price of 2.9% (compared to an average discount of 2.5% in January 2025). In January, Coachella Valley attached homes were selling at an average discount from list price of 3.4% (compared to an average discount of 3.0% in January 2025). Market Watch noted that these numbers had returned to pre-pandemic norms.
 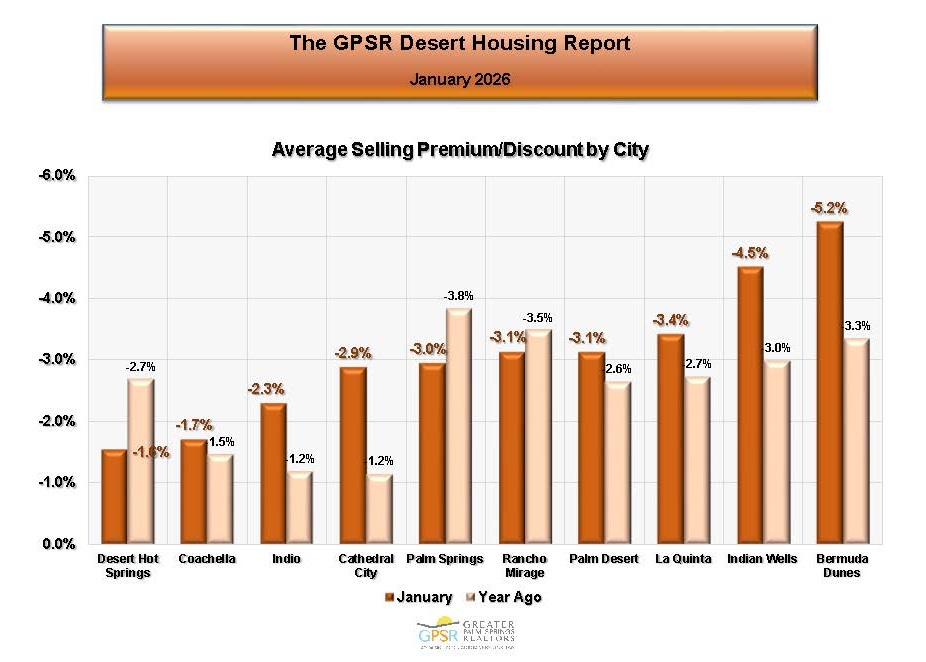 COACHELLA VALLEY JANUARY AVERAGE SELLING PREMIUM/DISCOUNT FROM LIST PRICE BY CITY: In January, Desert Hot Springs had the lowest average selling discount from list price of 1.6% (down from an average discount of 2.7% in January 2025). Bermuda Dunes had the largest average selling discount from list price in January at 5.2% (up from an average discount of 3.3% in January 2025). Market Watch noted that in general, cities with higher-priced homes have larger average selling discounts from list price.
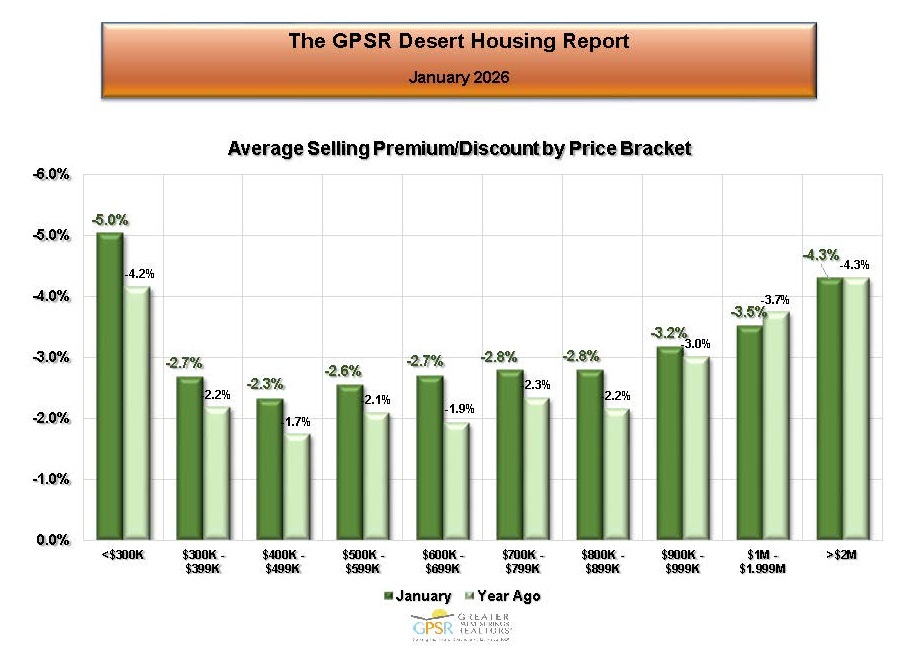 COACHELLA VALLEY JANUARY AVERAGE SELLING PREMIUM/DISCOUNT FROM LIST PRICE BY PRICE RANGE: In January, the lowest average discount from list price was for homes priced between $400,000 to $499,000 at 2.3% (up from an average discount of 1.7% in January 2025). The largest average discount from list price in January was for homes prices under $300,000 at 5.0% (up from an average discount of 4.2% in January 2025). Market Watch noted that as a rule, price discounts increase with higher priced homes. However, in the Coachella Valley in January, the lowest discounts were in the middle price ranges.
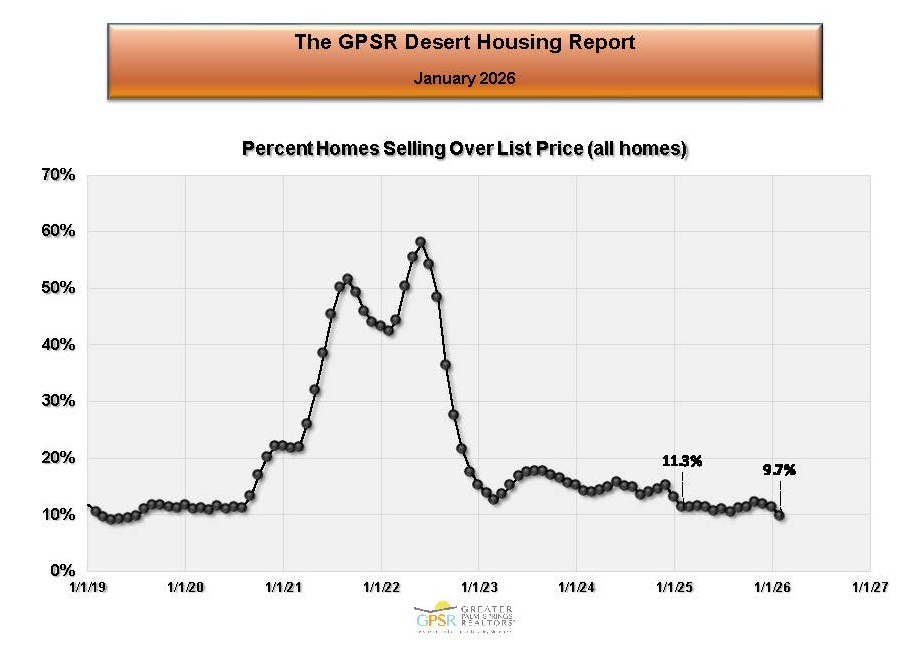 COACHELLA VALLEY JANUARY PERCENTAGE OF HOMES SELLING OVER LIST PRICE:In January, the percentage of homes in the Coachella Valley selling over list price was 9.7% (down from 11.3% in January 2025). Market Watch noted that the percentage of homes selling above list price was now back to pre-pandemic levels.
THE BRIGGS GROUP | COLDWELL BANKER | Laurie Briggs - DRE# 01896117 | Tim Briggs - DRE# 01898254 | Coldwell Banker Realty - DRE# 00616212