Desert real estate market experts, Market Watch LLC, have just released their July 2025 GPSR Desert Housing Report. Some highlights, courtesy of the Greater Palm Springs Realtors®:
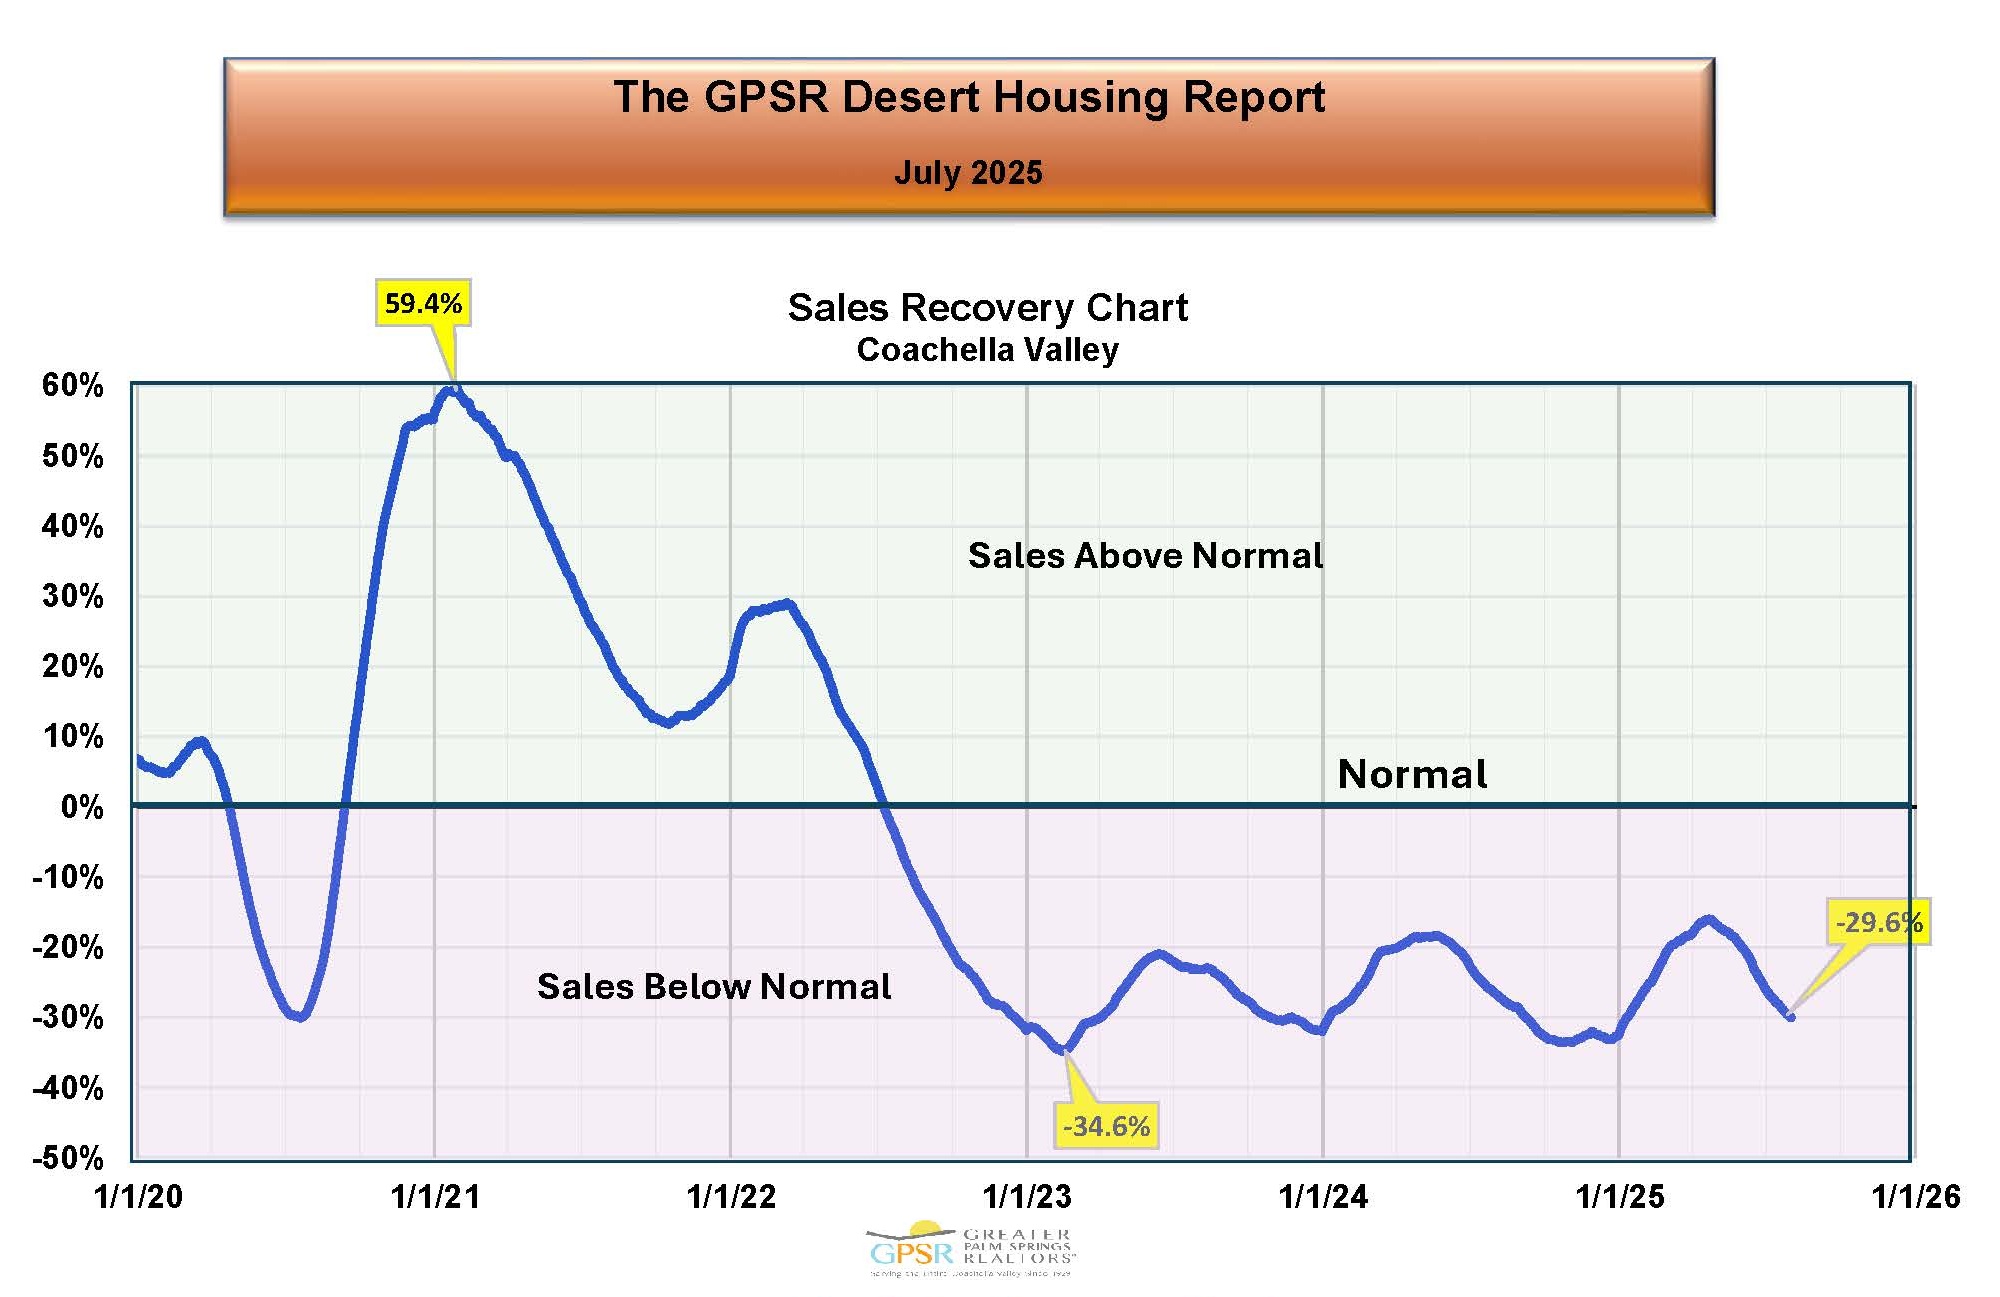 COACHELLA VALLEY JULY SALES RECOVERY: In July, Coachella Valley home sales were 29.6% below pre-pandemic July normal home sales (compared to 34.6% in July 2024). July normal pre-pandemic home sales were calculated from July Coachella Valley home sales in the years 2026 through 2019. Market Watch called out that over the last several months, home sales were slowing down again relative to pre-pandemic normal home sales (but were still an improvement from July 2024 home sales).
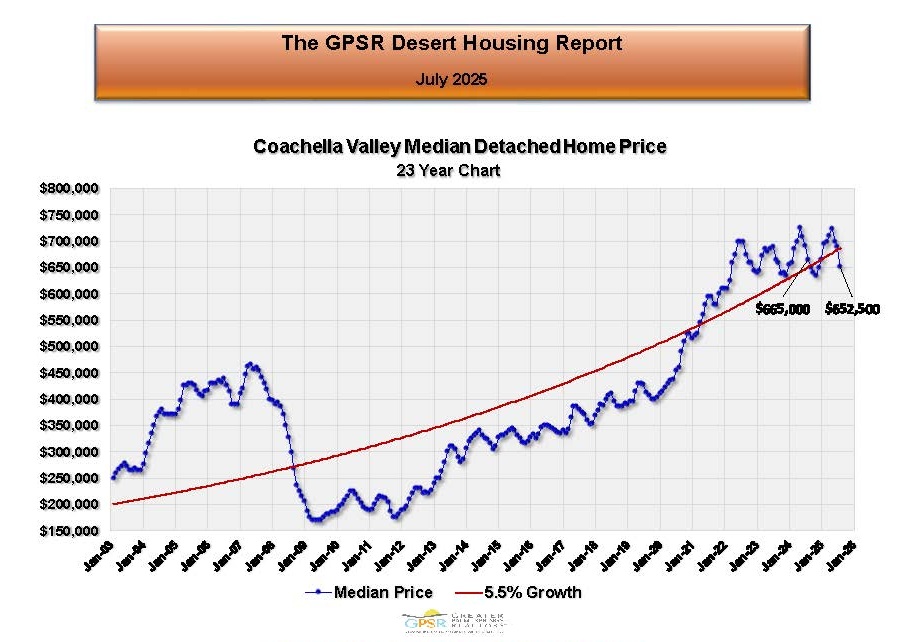 COACHELLA VALLEY JULY DETACHED HOME MEDIAN PRICE: The detached home median price in the Coachella Valley in July was $652,500 (down 1.9% from $665,000 in July 2024). Market Watch commented that the Coachella Valley detached home median price usually hits its seasonal low in Autumn and its seasonal high in the Spring. They were encouraged that detached homes in the Coachella Valley have in general maintained the price gains achieved during the pandemic.
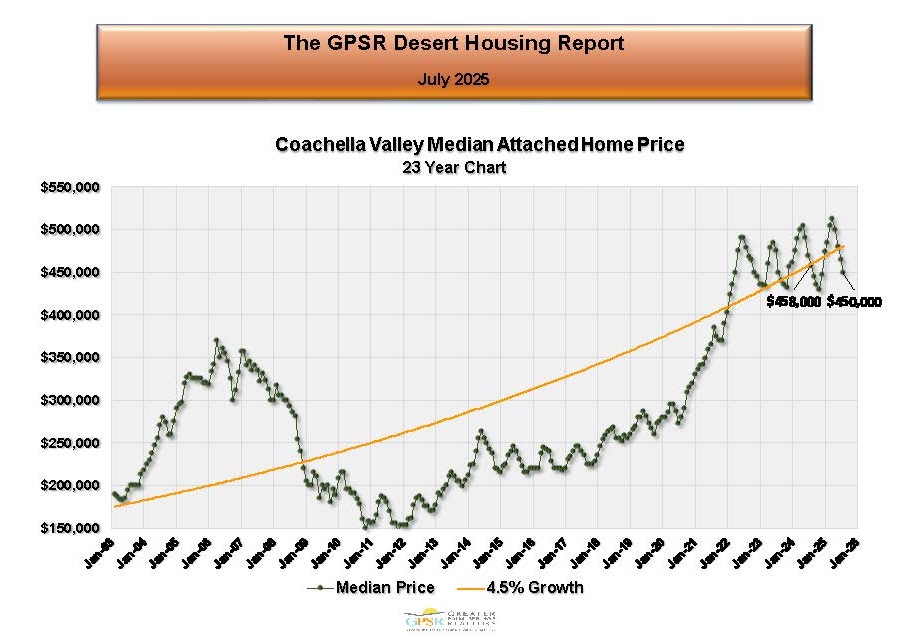 COACHELLA VALLEY JULY ATTACHED HOME MEDIAN PRICE: The attached home median price in the Coachella Valley in July was $450,000 (down 1.7% from $458,000 in July 2024). Market Watch commented that the attached home median price seemed to follow the same seasonal pattern as was the case for t detached home median price.
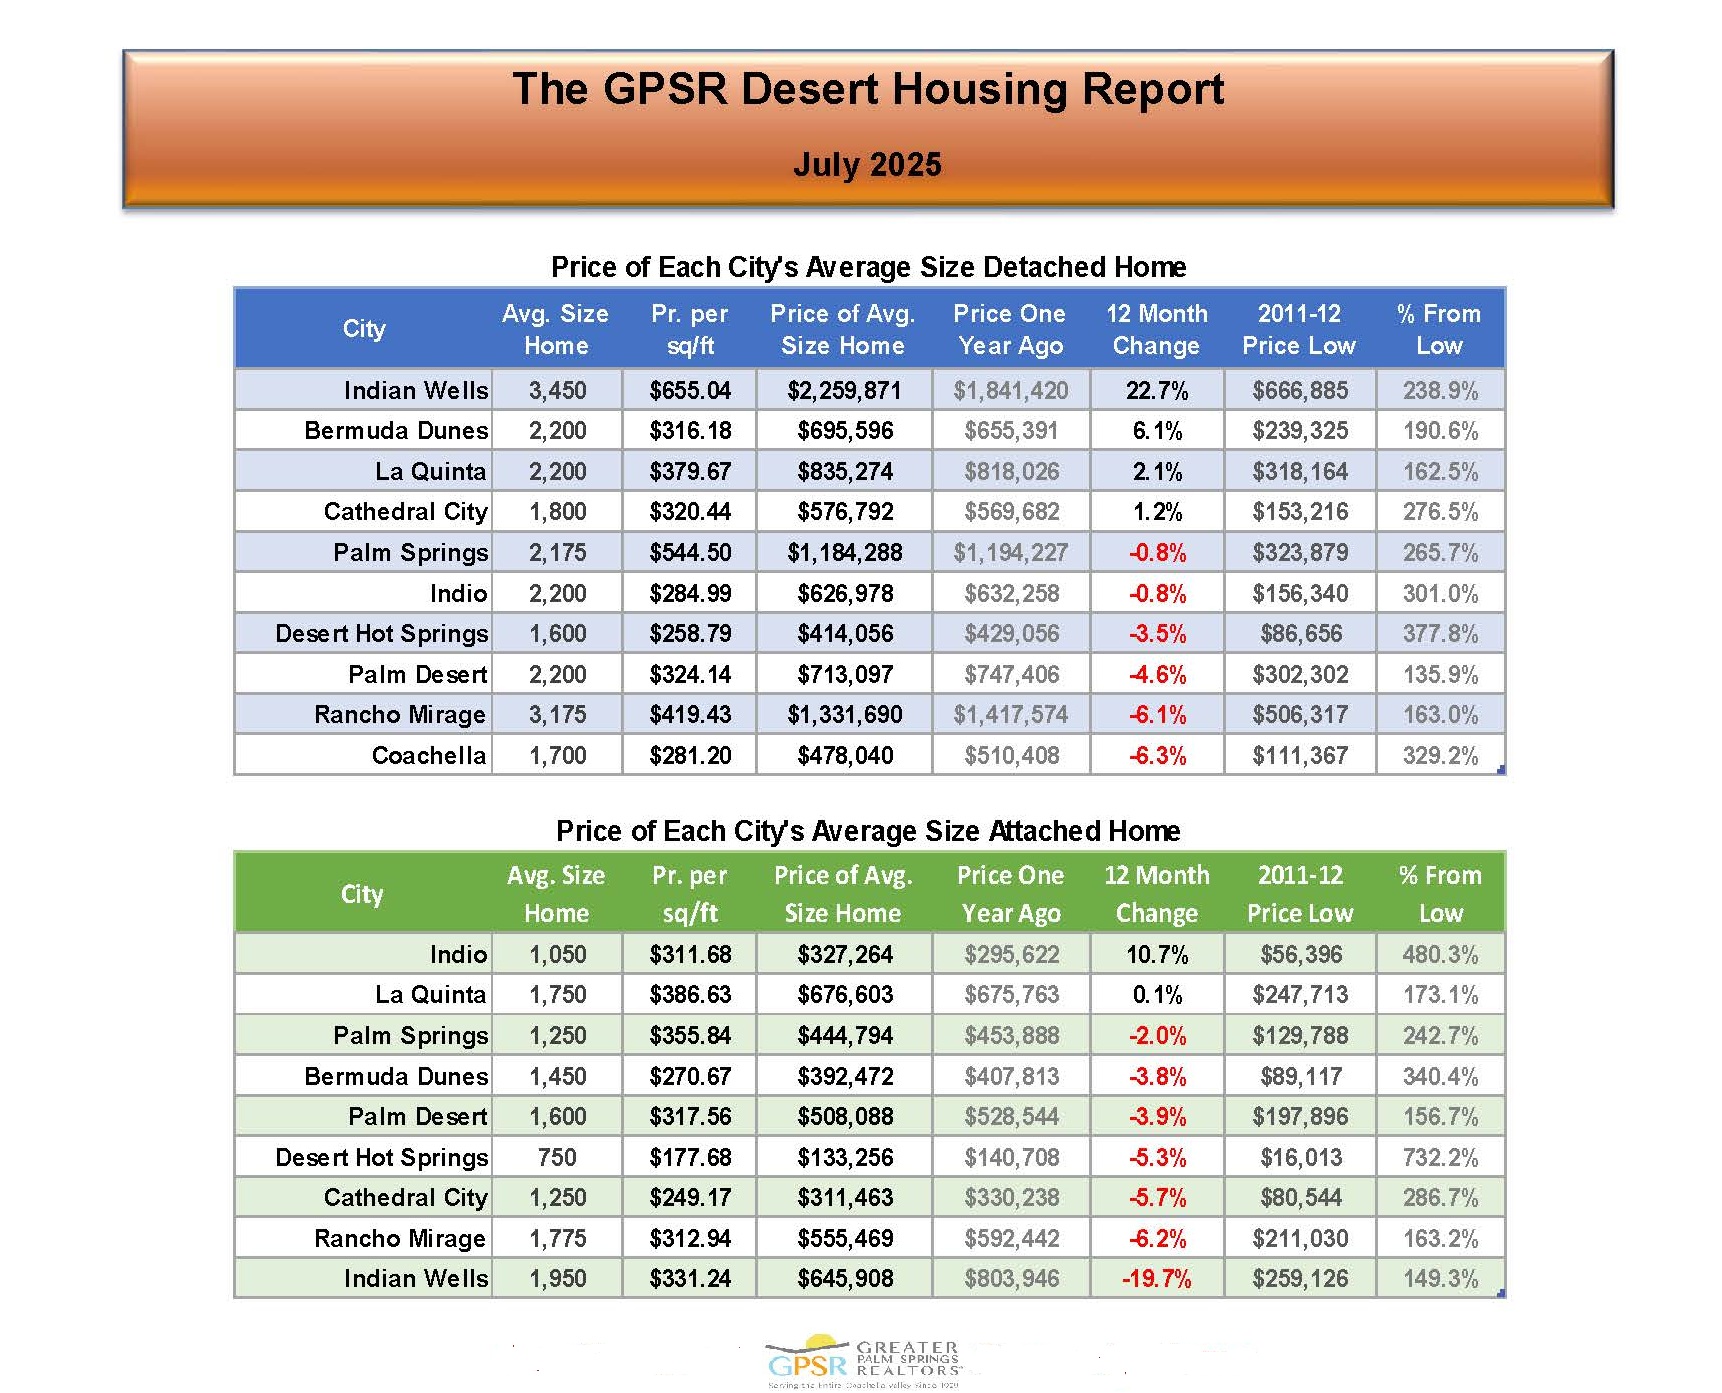 COACHELLA VALLEY JULY PRICE OF THE AVERAGE SIZE HOME BY CITY: In the Coachella Valley in July, changes in the median price of the average size detached home in each city ranged from an increase of 22.7% (increasing from $1,841,420 to $2,259,871) for the 3,450 sq ft average size detached home in Indian Wells to a decrease of 6.3% (decreasing from $510,408 to $478,040) for the 1,700 sq ft average size detached home in Coachella. In the Coachella Valley in July, changes in the median price of the average size attached home in each city ranged from an increase of 10.7% (increasing from $295,622 to $327,264) for the 1,050 sq ft average size attached home in Indio to a decrease of 19.7% (decreasing from $803,946 to $645,908) for the 1,950 sq ft average size attached home in Indian Wells.
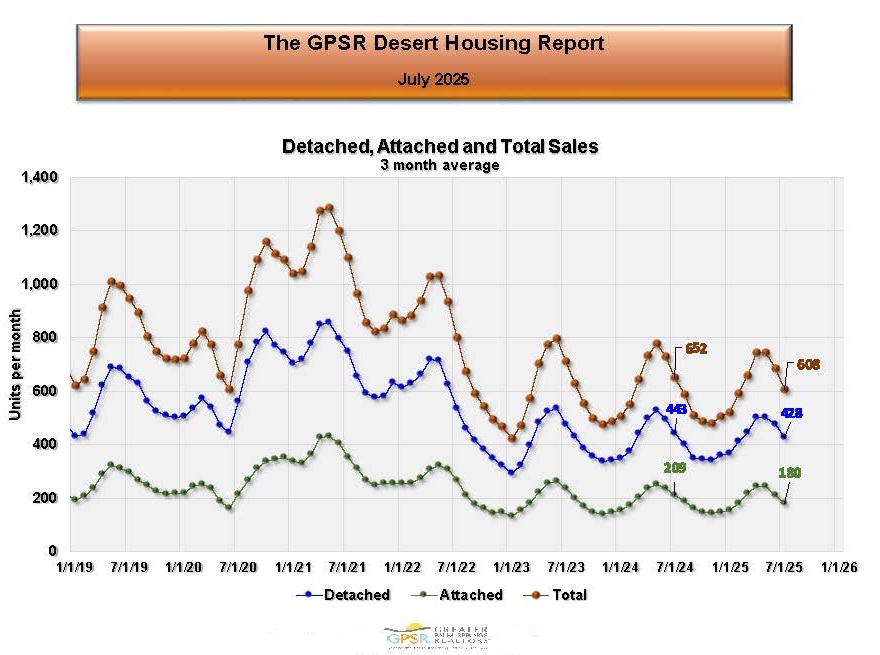 COACHELLA VALLEY JULY MONTHLY HOME SALES (3 MONTH AVERAGE): In the Coachella Valley in July, the three-month average of total home sales was 608 homes (down 6.8% from 652 average home sales in July 2024). Market Watch explained that because of the seasonality in Coachella Valley home sales, it was difficult to determine where home sales stood on a historical basis. The Sales Recovery data was designed to help distinguish seasonal home sales changes from real ones.
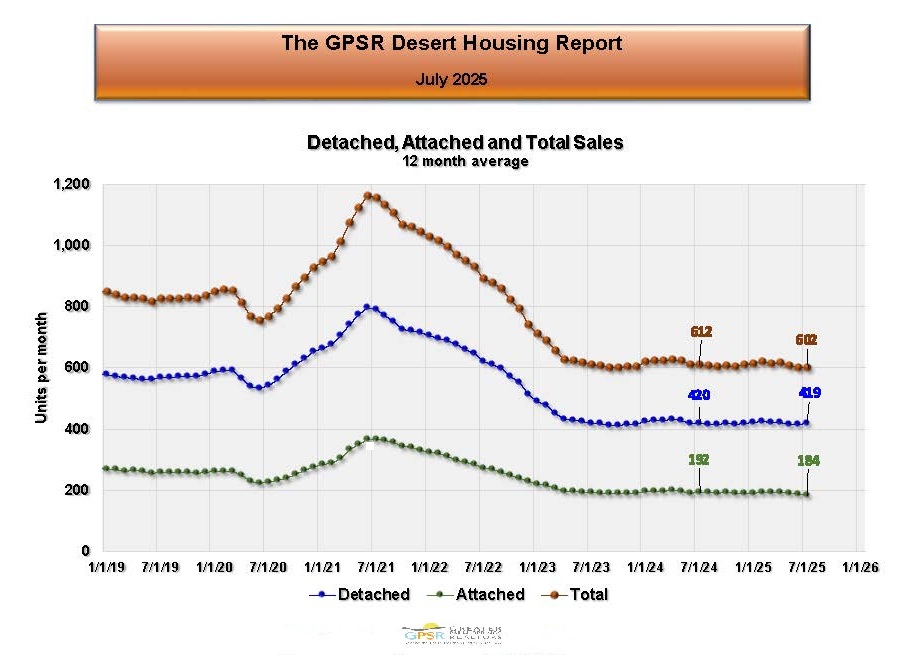 COACHELLA VALLEY JULY MONTHLY HOME SALES (12 MONTH AVERAGE): In the Coachella Valley in July, the 12-month average of total home sales, which removes seasonality from the Coachella Valley home sales data, was 602 homes (down 1.6% from 612 home sales in July 2024). Market Watch stated that the housing market needs lower mortgage rates. They added that although inflation remains low, the Federal Reserve Board has stopped lowering short-term interest rates until the effect of the administration’s new economic policies can be determined.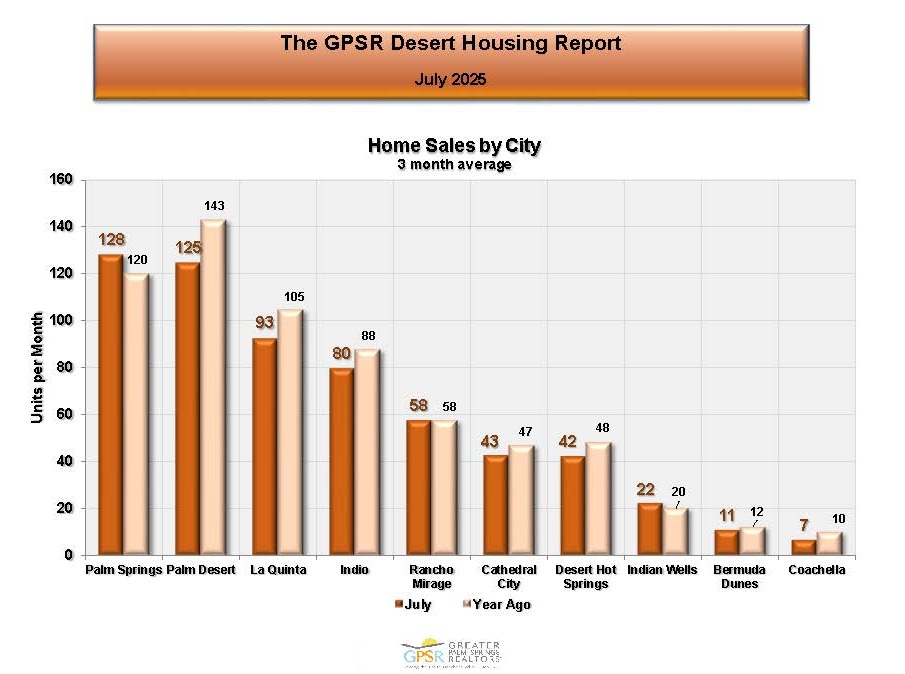
COACHELLA VALLEY JULY HOME SALES BY CITY: In the Coachella Valley in July, Palm Springs had the highest average home sales at 128 (up 6.7% from 120 home sales in July 2024), followed by Palm Desert with 125 home sales (down 12.6% from 143 home sales in July 2024), then La Quinta with 93 home sales (down 11.4% from 105 home sales in July 2024). Coachella had the lowest July average home sales in the Coachella Valley at 7 home sales (down 30% from 10 home sales in July 2024).
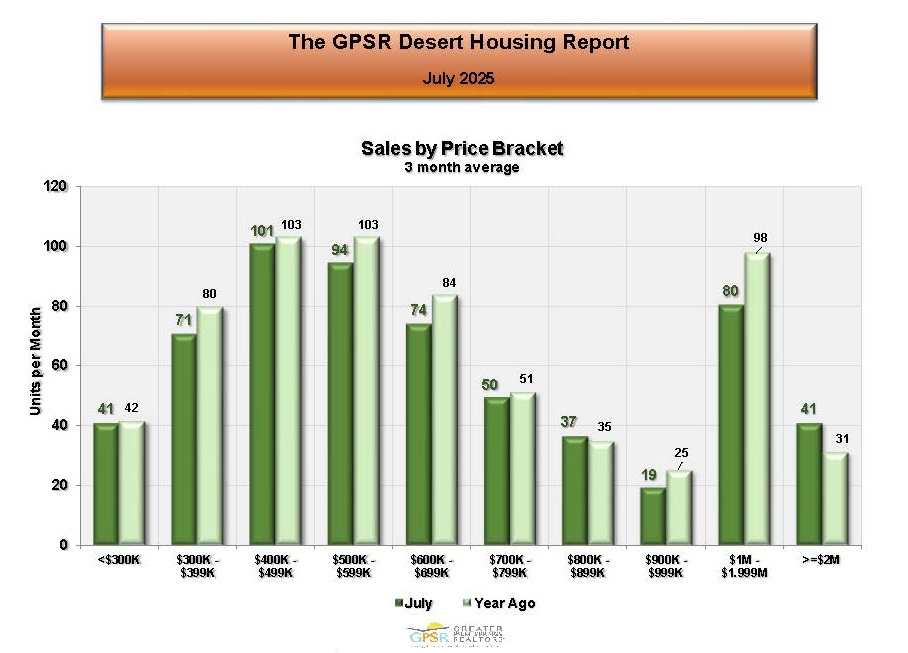 COACHELLA VALLEY JULY HOME SALES BY PRICE RANGE: Coachella Valley July home sales were highest for homes priced between $400K and $499K at 101 home sales (down 1.9% from 103 home sales in July 2024). Coachella Valley July home sales were lowest for homes priced between $900K and $999K at 19 home sales (down 24% from 25 home sales in July 2024). Market Watch commented that Coachella Valley July home sales were comparable in all price ranges to July 2024.
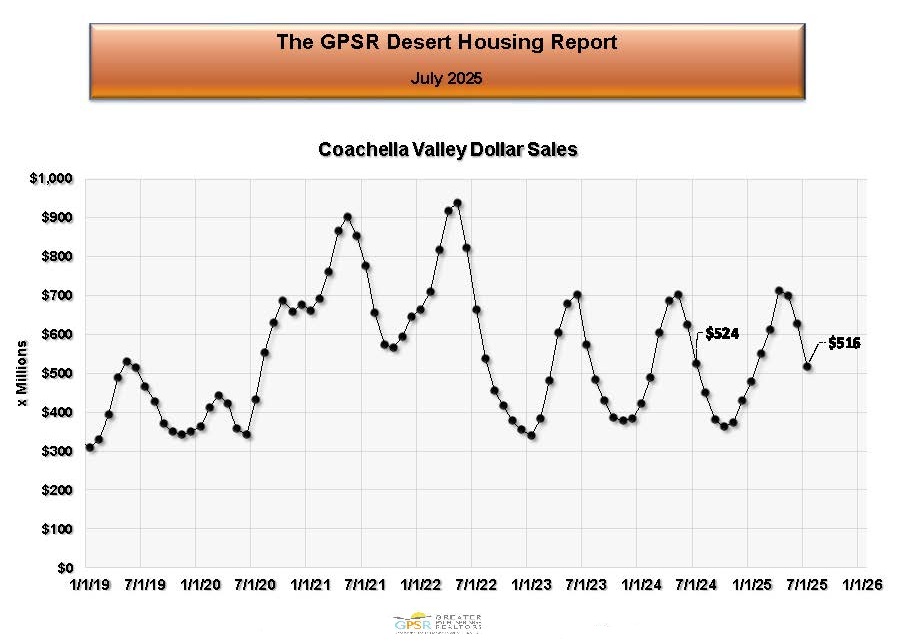 COACHELLA VALLEY JULY HOME SALES IN DOLLARS: Coachella Valley July home sales were $516M (down 1.5% from home sales of $524M in July 2024)
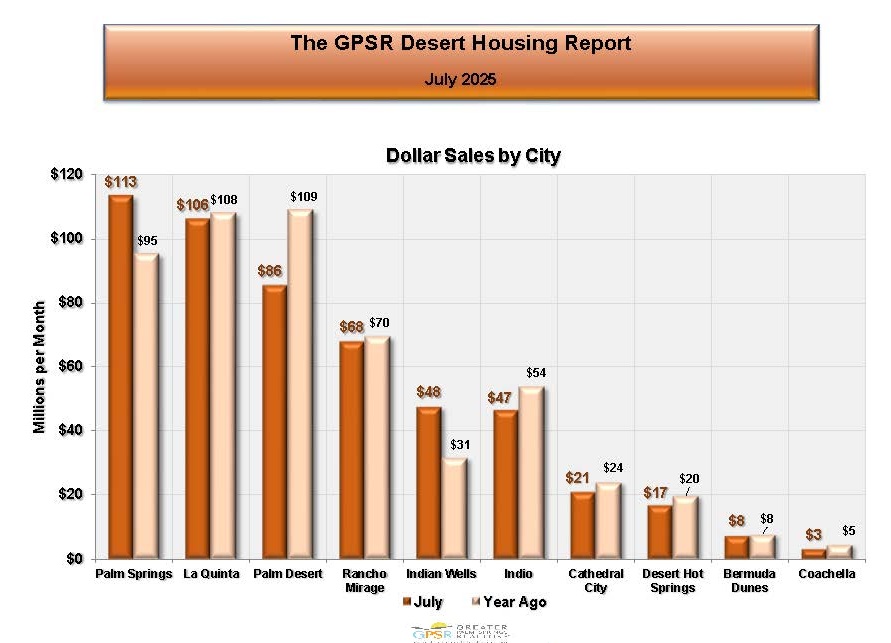 COACHELLA VALLEY JULY HOME SALES IN DOLLARS BY CITY: In the Coachella Valley in July, the highest monthly average home sales in dollars were in Palm Springs at $113M (up 19% from $95M in July 2024). This was followed by La Quinta with monthly average home sales of $106M (down 1.9% from $108M in home sales in July 2024) and Palm Desert with monthly average home sales of $86M (down 21.1% from home sales of $109M in July 2024). The lowest monthly average home sales in dollars were in Coachella at $3M (down 40% from $5M in home sales in July 2024).
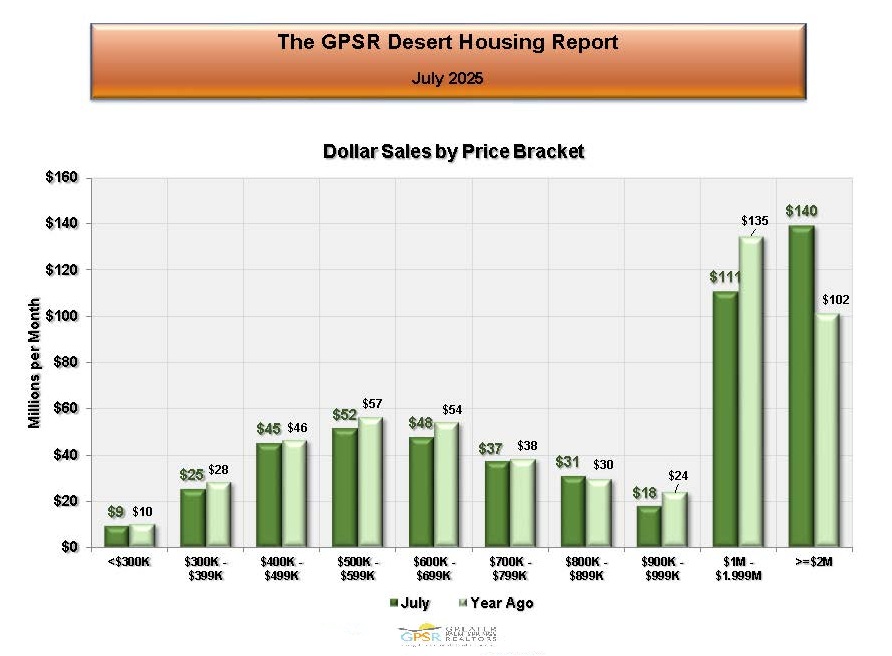 COACHELLA VALLEY JULY HOME SALES IN DOLLARS BY PRICE RANGE: In the Coachella Valley in July, the highest monthly average home sales in dollars were $140M for homes priced above $2M (up 37.3% from $102M in July 2024), followed closely by monthly average home sales of $111M for homes price between $1M and $1.999M (down 17.8% from $135M in July 2024). The lowest monthly average home sales in July were for homes priced under $300K at $9M (down 10% from$10M in July 2024). Market Watch noted that home sales in dollars for homes priced above $1M accounted for 48.5% of all home sales in dollars in the Coachella Valley in July.
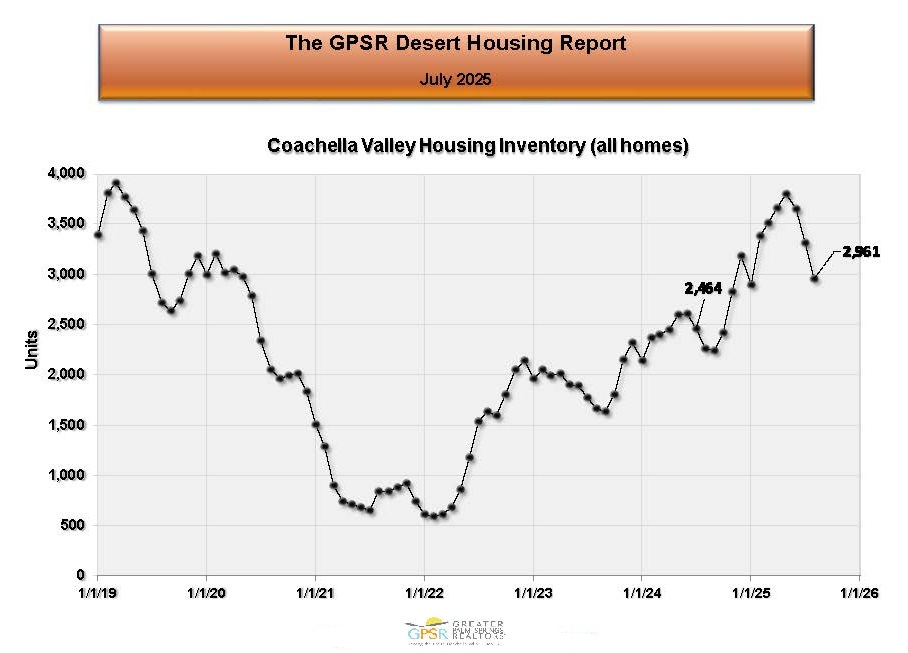 COACHELLA VALLEY AUGUST 1ST HOME INVENTORY: On August 1st , the combined inventory of detached and attached homes for sale in the Coachella Valley was 2,961 homes (up 695 homes or 30.7% from 2,464 homes on August 1st, 2024). Market Watch noted that inventory has been improving and current levels are now comparable to inventory before the pandemic. The seasonal pattern shows an inventory high at the beginning of the year and an inventory low in late Summer.
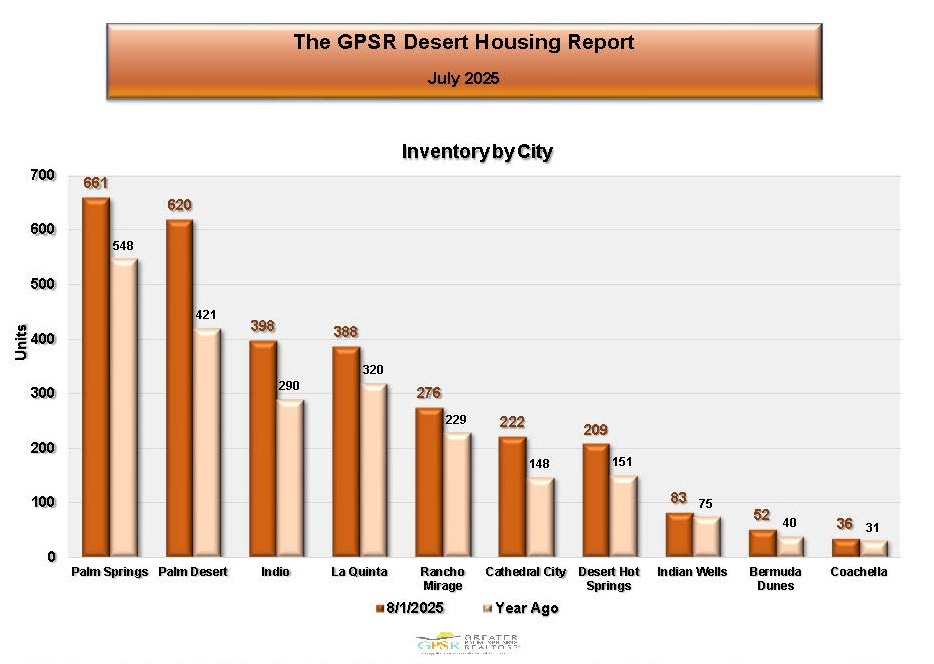 COACHELLA VALLEY AUGUST 1ST HOME INVENTORY BY CITY: On August 1st in the Coachella Valley, largest home inventory was in Palm Springs with 661 homes (up 20.6% from 548 homes on August 1st, 2024), followed by Palm Desert with 620 homes (up 47.3% from 421 homes on August 1st, 2024). The lowest home inventory was in Coachella at 36 homes (up 16.1% from 31 homes on August 1st, 2024). Market Watch was of the opinion that this data could help agents know what cities have homeowners with the greatest selling interest and how this compares to last year.
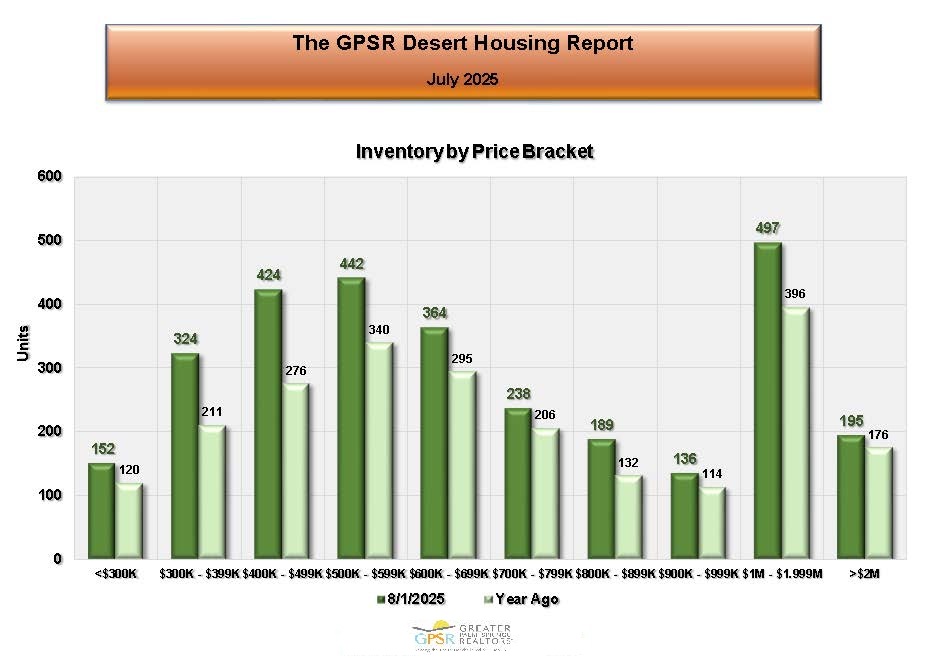 COACHELLA VALLEY AUGUST 1ST HOME INVENTORY BY PRICE RANGE: On August 1st in the Coachella Valley, the highest inventory level was for homes priced between $1M and $1.999M at 497 homes (up 25.5% from 396 homes on August 1st, 2024). The lowest inventory level was for homes priced between $900K and $999K at 136 homes (up 19.3% from 114 homes on August 1st, 2024). Market Watch noted that this data could help to locate what price ranges might be responsible for the growth or contraction of inventory.
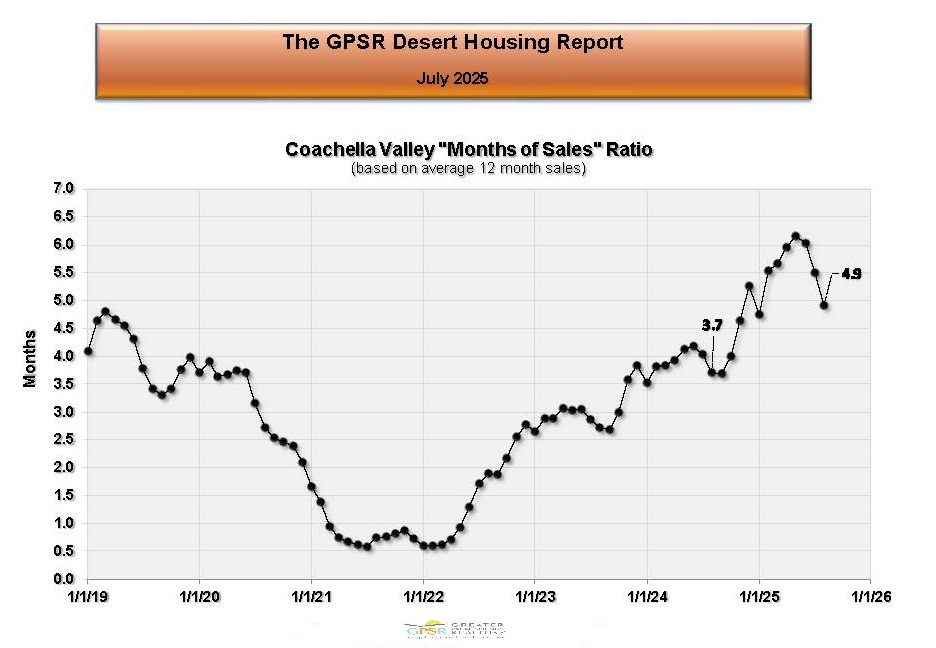 COACHELLA VALLEY AUGUST 1ST VALLEY-WIDE MONTHS OF SALES RATIO: On August 1st, the Coachella Valley’s valley-wide months of sales ratio was 4.9 months (up 32.4% from 3.7 months on August 1st, 2024). Market Watch stated that this fundamental ratio, which measures supply and demand, is now above pre-pandemic levels. They felt that while inventory has recovered, because of low home sales, supply was beginning to exceed demand. However, they felt that this should not cause a problem for home prices unless it begins to extend average selling times.
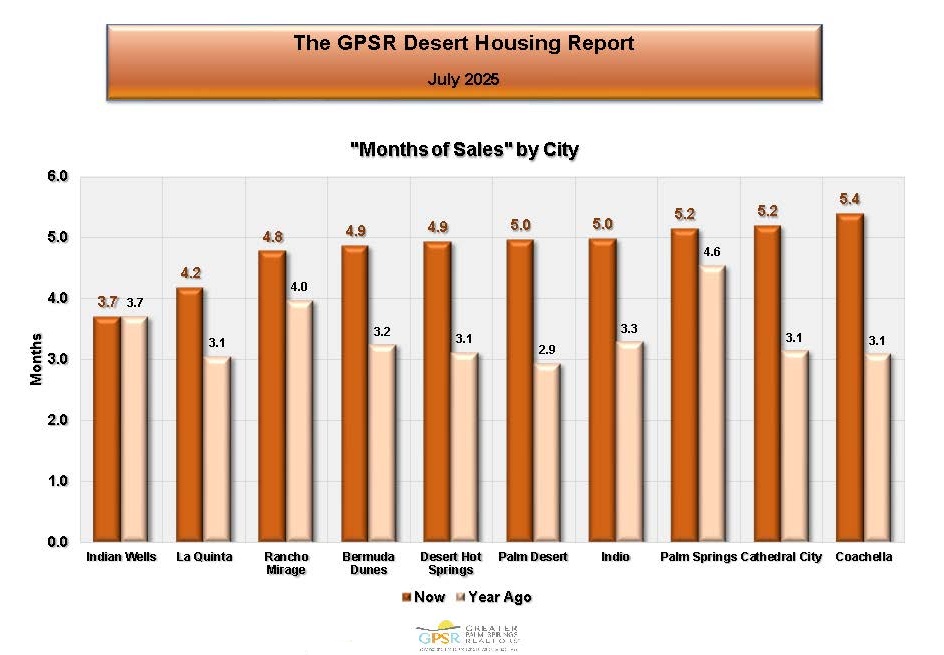 COACHELLA VALLEY AUGUST 1ST MONTHS OF SALES RATIO BY CITY: On August 1st in the Coachella Valley, the lowest months of sales ratio was 3.7 months in Indian Wells (the same as on August 1st, 2024). The highest months of sales ratio was 5.4 months in Coachella (up 74.2% from 3.1 months on August 1st, 2024). Market Watch saw consistent months of sales ratios between 4.0 and 5.0 months in most of the nine Coachella Valley cities. Since months of sales is really the supply-demand equation for housing, this data showed that the Coachella Valley housing market was becoming supply heavy.
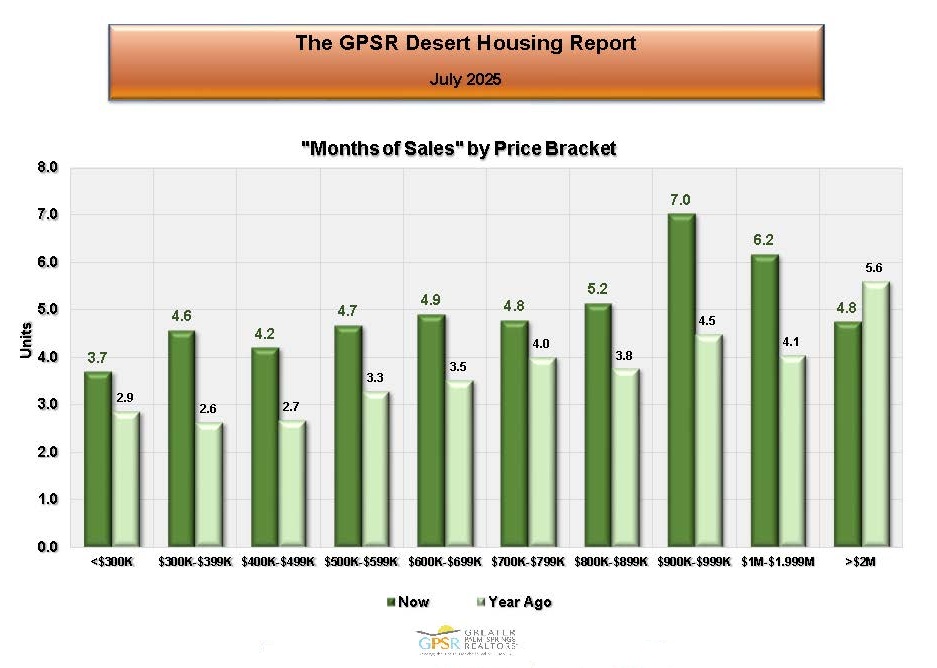
COACHELLA VALLEY AUGUST 1ST MONTHS OF SALES RATIO BY PRICE RANGE: On August 1st, in the Coachella Valley, the lowest months of sales ratio was for homes priced between $400K and $499K at 4.1 months (up 64% from 2.5 months on August 1st, 2024). The highest months of sales ratio was for homes priced between $900K and $999K at 6.7 months (up 55.8% from 4.3 months on August 1st, 2024). Market Watch was of the opinion that since months of sales ratios are really the supply-demand equation for housing, the large increases over last year shows supply is starting to exceed demand in almost all price brackets. They added that this hasn’t affected prices yet and most probably won’t until selling times begin to lengthen.
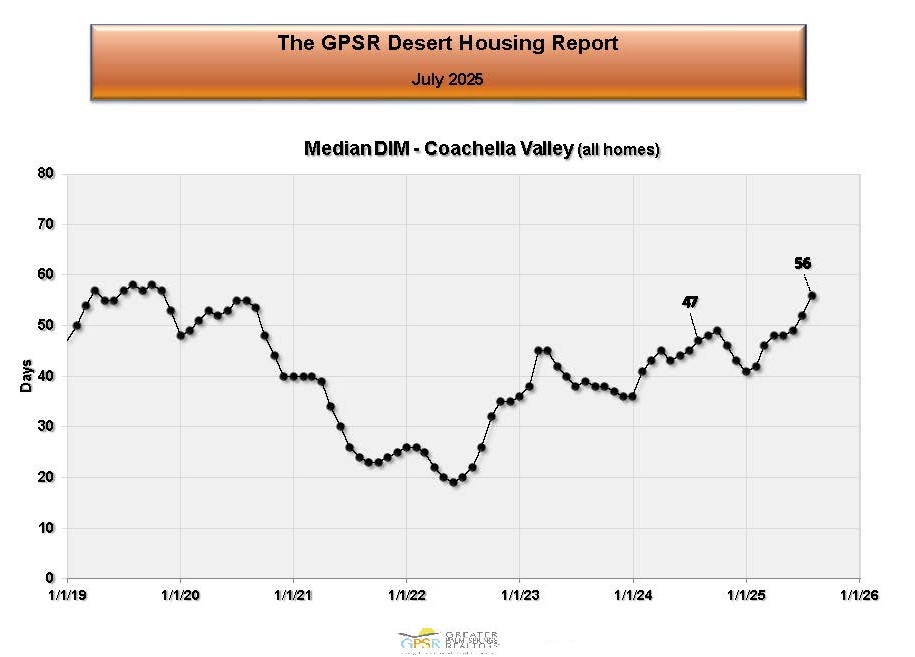 COACHELLA VALLEY JULY VALLEY-WIDE DAYS IN THE MARKET: At the end of July, the median number of days in the market in the Coachella Valley was 56 days (9 days more than 47 days in July 2024). Market Watch noted that the median selling time in the Coachella Valley region has been running between 40 and 55 days for over two years.
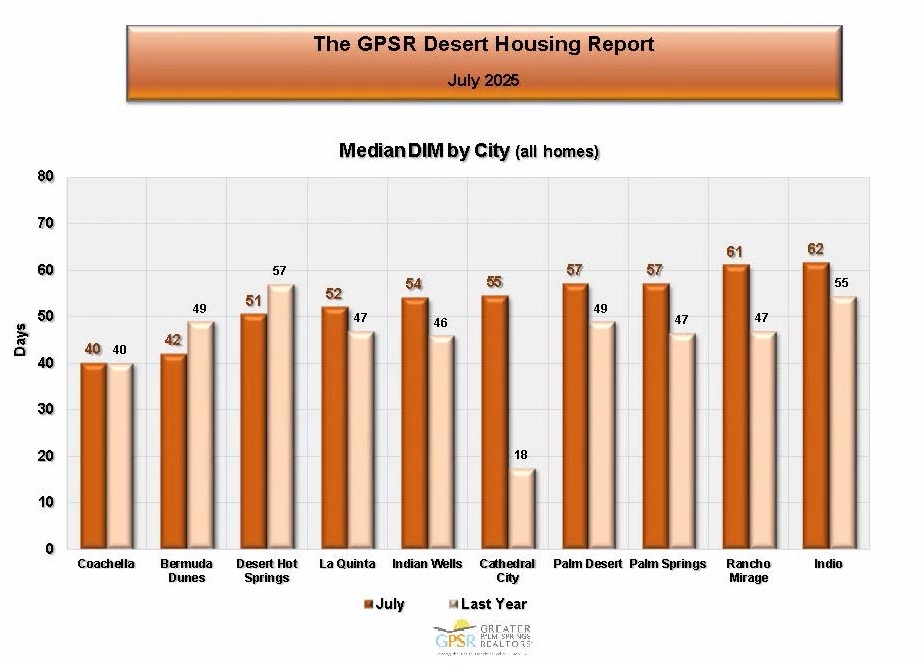 COACHELLA VALLEY JULY DAYS IN THE MARKET BY CITY: In July, the Coachella Valley’s lowest average selling time was in Coachella at 40 days (same as in July 2024). This was followed by Bermuda Dunes at 42 days (down from 49 days in July 2024). Indio had the longest average selling time at 62 days (up from 55 days in July 2024).
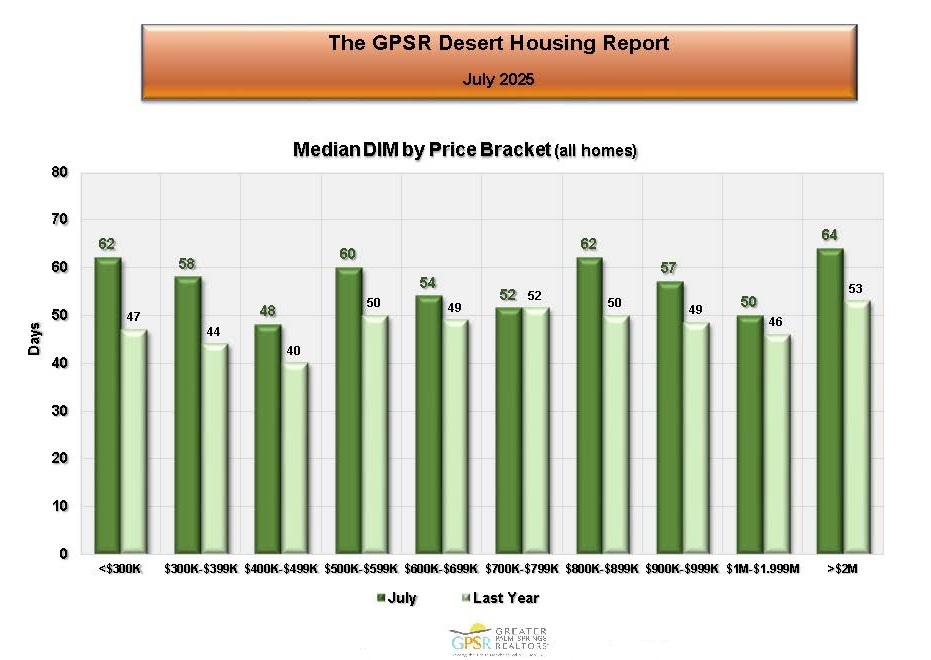 COACHELLA VALLEY JULY DAYS IN THE MARKET BY PRICE RANGE: In July, the Coachella Valley’s lowest average selling time was for homes priced between $400K and $499K at 48 days (up from 40 days in July 2024). The longest average selling time was for homes priced over $2M at 64 days (up from 53 days in July 2024). Market Watch stated that it was important to note if any price range had an abnormal number of days in the market. They went on to add that usually selling times increase with higher priced homes. In the current Coachella Valley market, they didn’t see that trend, which they felt was a positive situation.
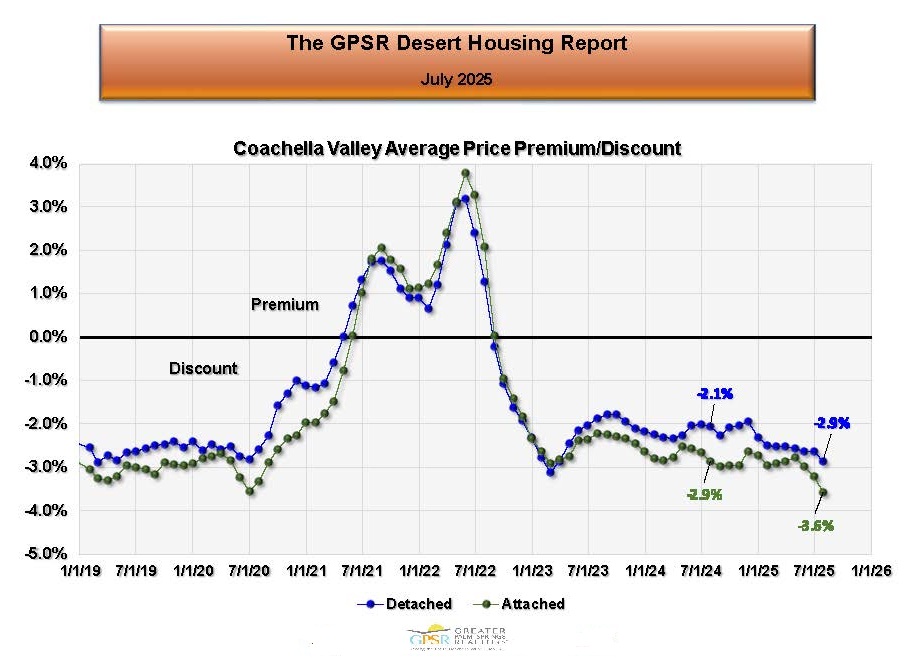 COACHELLA VALLEY JULY AVERAGE PRICE PREMIUM/DISCOUNT: In the Coachella Valley in July, detached homes were selling at an average discount of 2.9% (compared to an average discount of 2.1% in July 2024). Attached homes were selling at an average discount of 3.6% (compared to an average discount of 2.9% in July 2024). Market Watch felt that the premium/discount numbers were back to pre-covid norms.
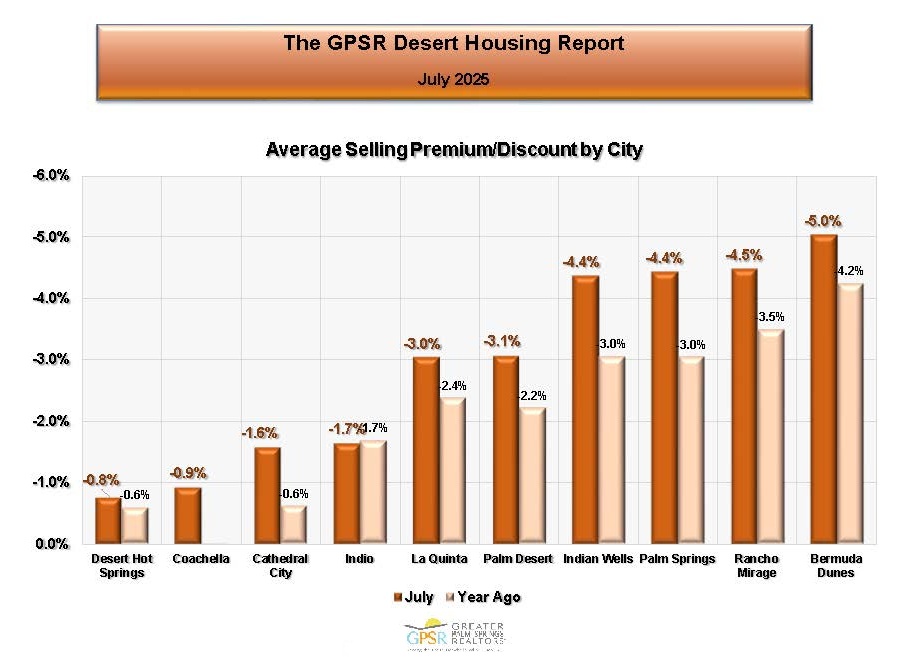 COACHELLA VALLEY JULY AVERAGE PRICE PREMIUM/DISCOUNT BY CITY: Market Watch noted that in general, cities with higher priced homes sell at larger discounts. In July, the lowest price discount in the Coachella Valley was in Desert Hot Springs at a discount of 0.8% (compared to an average discount of 0.6% in July 2024) The highest price discount was in Bermuda Dunes at an average discount of 5.0% (compared to an average discount of 4.2% in July 2024).
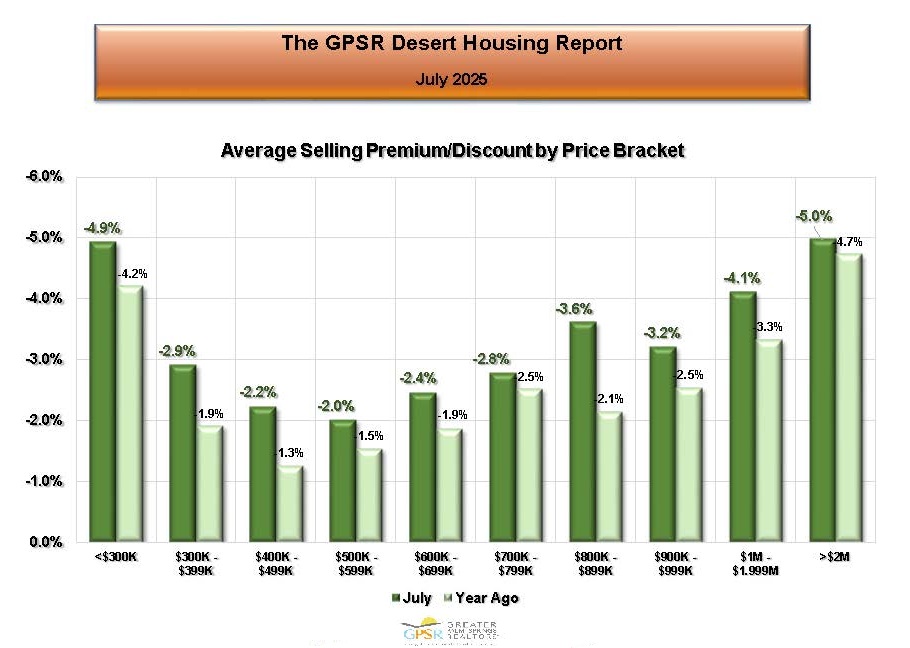 COACHELLA VALLEY JULY AVERAGE PRICE PREMIUM/DISCOUNT BY PRICE RANGE: In July, the lowest price discount in the Coachella Valley was for homes priced between $500K and $599K at an average discount of 2.0% (compared to an average price discount of 1.5% in July 2024). The highest price discount in the Coachella Valley in July was for homes priced over two million dollars at 5.0% (compared to 4.7% in July 2024). Market Watch noted that as a rule, price discounts increase with higher priced homes. However, in the Coachella Valley they noted that the lowest discounts seemed to occur in the mid-range price ranges.
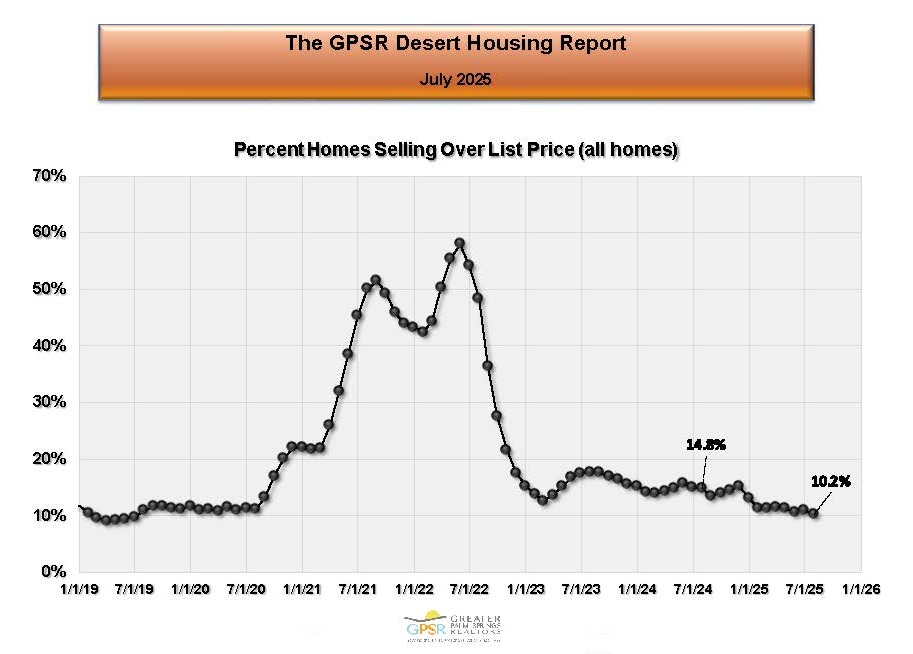 COACHELLA VALLEY JULY PERCENTAGE OF HOMES SELLING ABOVE LIST PRICE: In July, the percentage of homes in the Coachella Valley selling over list price was 10.2%. (compared to 14.8% in July 2024). Market Watch noted that the percentage of homes selling above list price in the Coachella Valley was now back to pre-pandemic levels.
THE BRIGGS GROUP | COLDWELL BANKER | Laurie Briggs - DRE# 01896117 | Tim Briggs - DRE# 01898254 | Coldwell Banker Realty - DRE# 00616212