Our local residential real estate market experts, Market Watch LLC, have just released their June 2024 Desert Housing report. For those of you wondering about the current state of our local real estate market, some highlights:
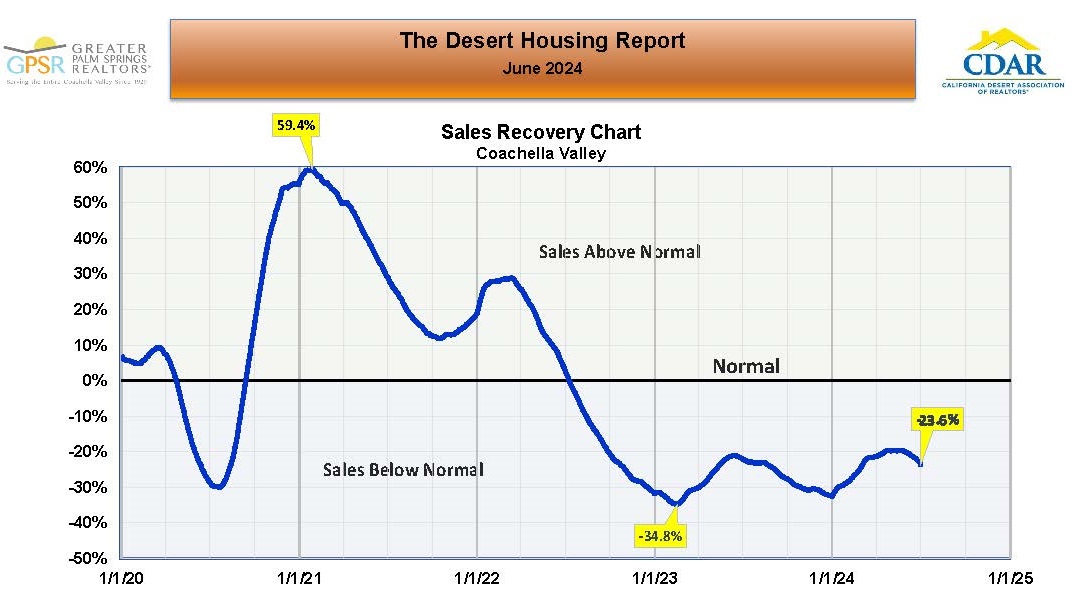 COACHELLA VALLEY JUNE SALES RECOVERY: This data shows where current Coachella Valley home sales were in June, relative to historic norms (where historic norms are calculated from Coachella Valley home sales over the 4 years from 2016 through 2019). Coachella Valley home sales in June were 23.6% below historic normal June home sales (up from homes sales 34.8% below historic norms in June 2023). Market Watch pointed out that Coachella Valley home sales have been declining over the last three months. They noted that they had hoped that Coachella Valley home sales would be in recovery by now, but they appear to be in decline. They were hopeful that the Federal Reserve would engineer an interest rate cut soon, which would stimulate buyers.
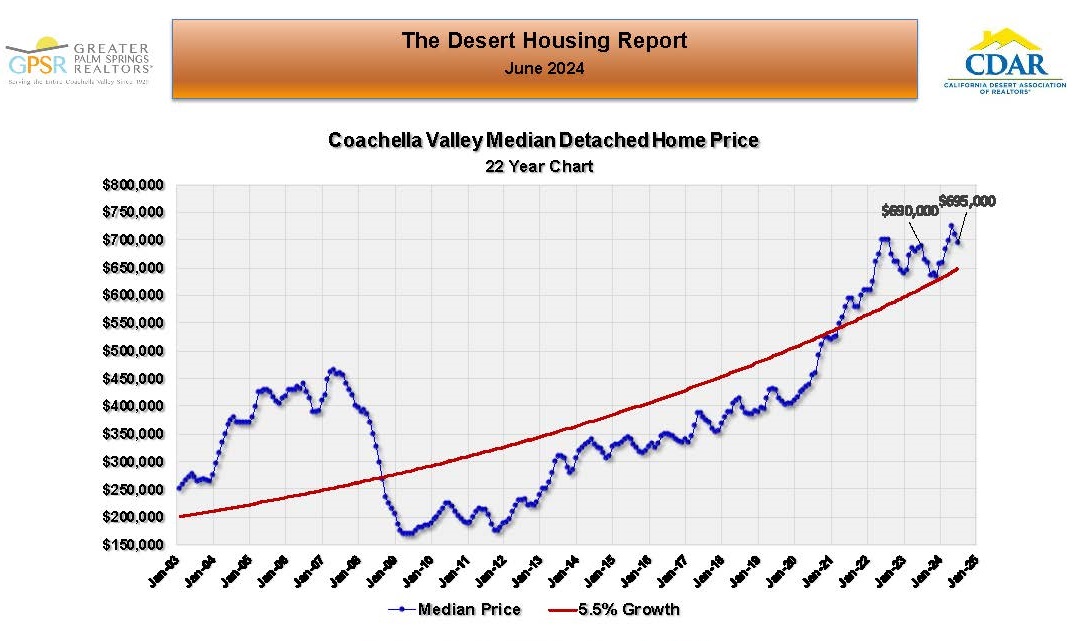 COACHELLA VALLEY JUNE MEDIAN DETACHED HOME PRICE: The median price of a detached home in the Coachella Valley in June was $695,000, after reaching an all-time high $724,523 in April of this year. On a year-over-year basis, the median detached home price was up 0.7% from $690,000 in June 2023. Market Watch commented that Coachella Valley home prices usually peak in May or June due to seasonal patterns and it appeared that this pattern was repeating itself this year. They further noted that with inventory rising and sales beginning to contract, they thought that supply and demand was starting to favor buyers.
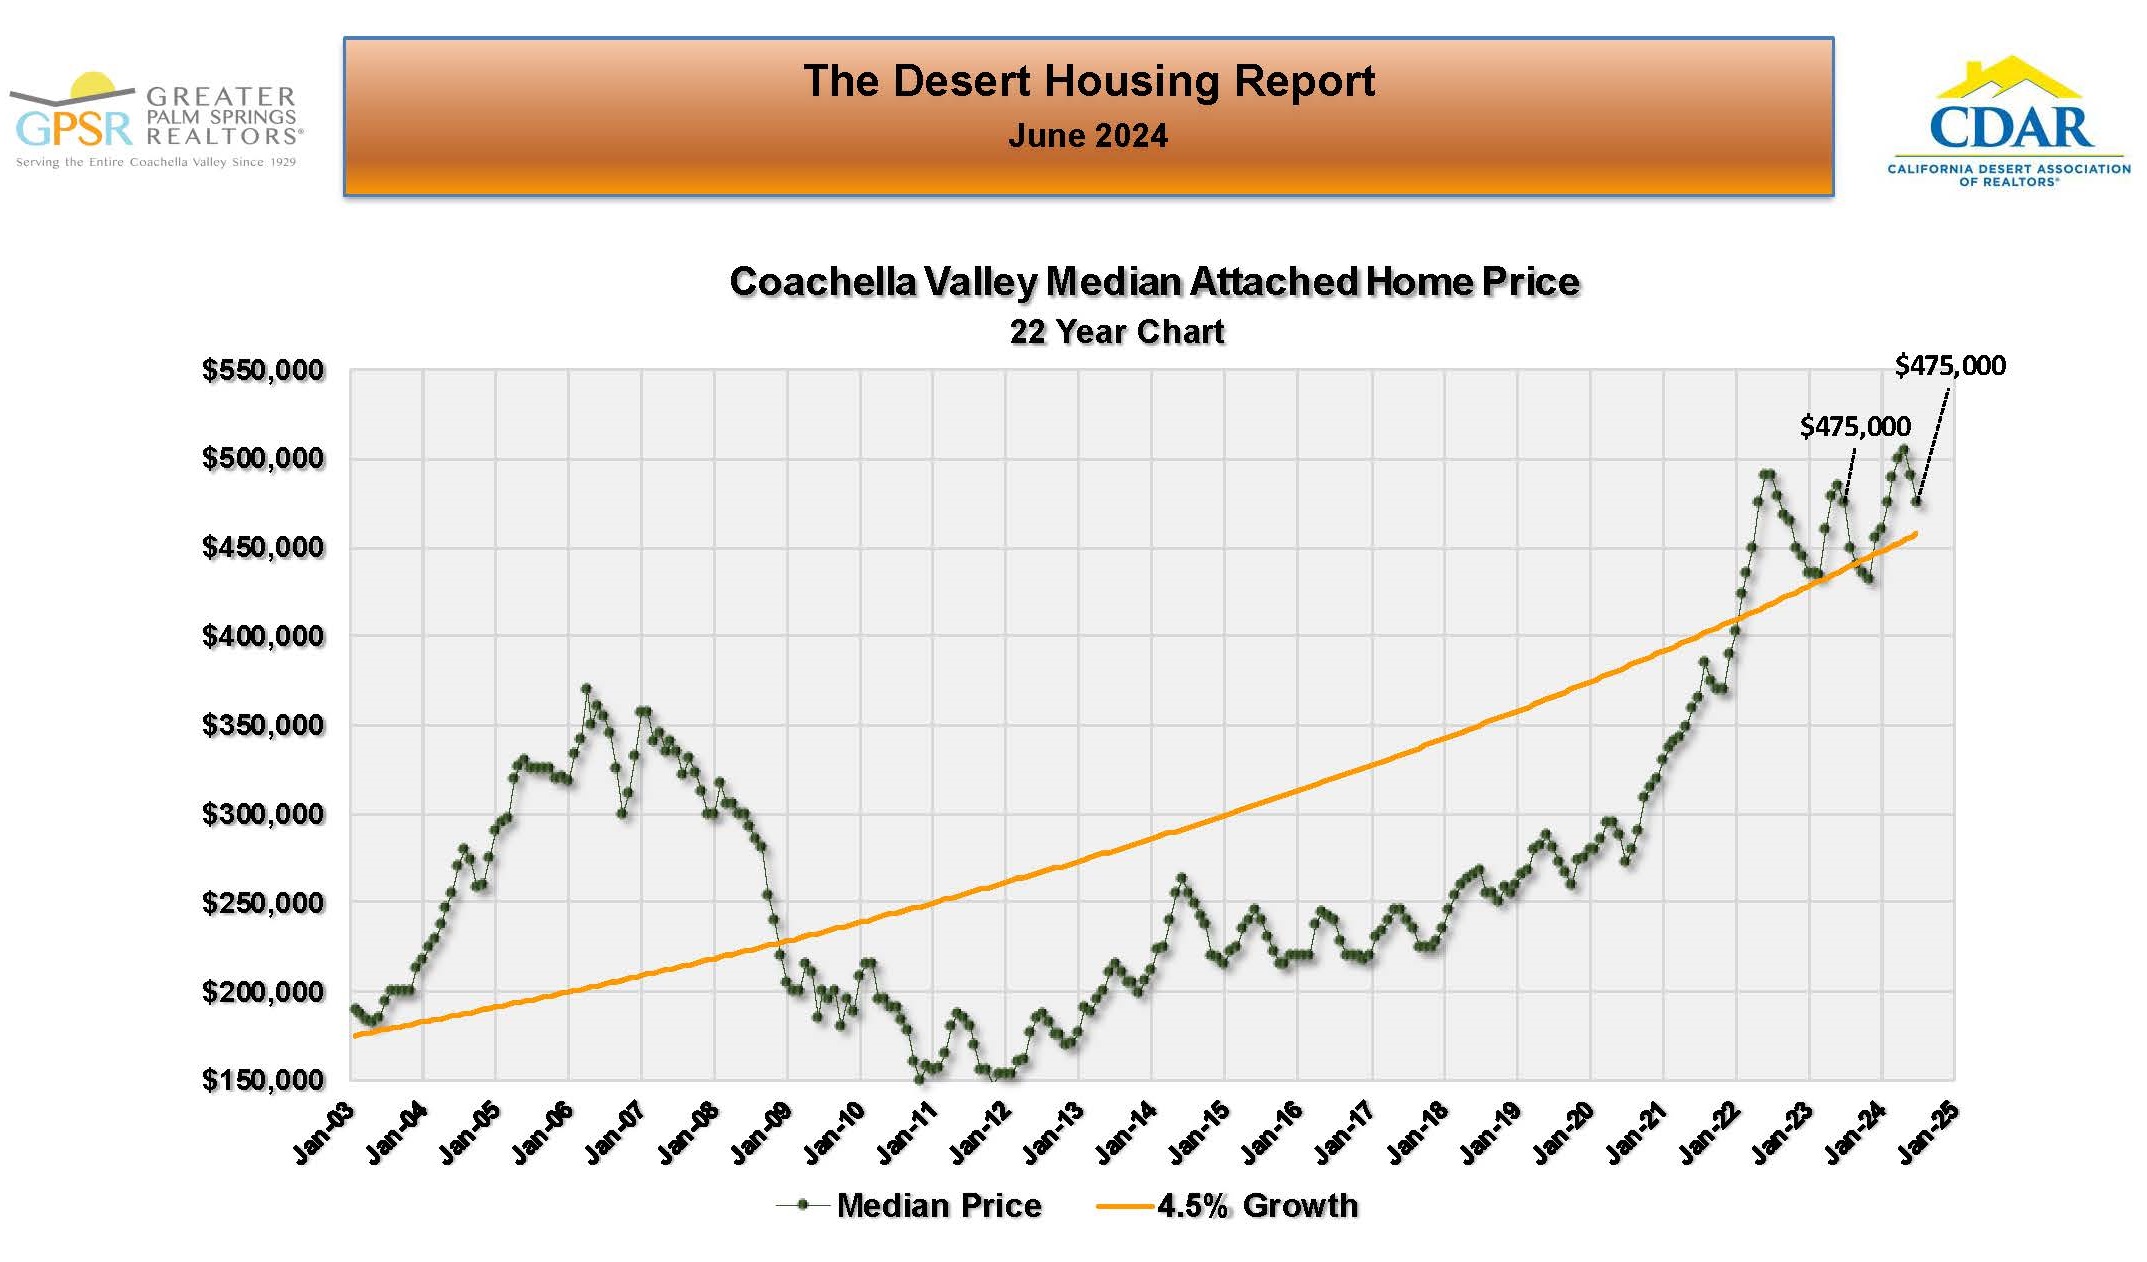 COACHELLA VALLEY JUNE MEDIAN ATTACHED HOME PRICE: The median price of an attached home in the Coachella Valley in June was $475,000 (the same as in June 2023). Market Watch pointed out that the seasonal variance in prices for attached homes was much larger than for detached homes and that attached home prices seemed to be following the normal seasonal pattern.
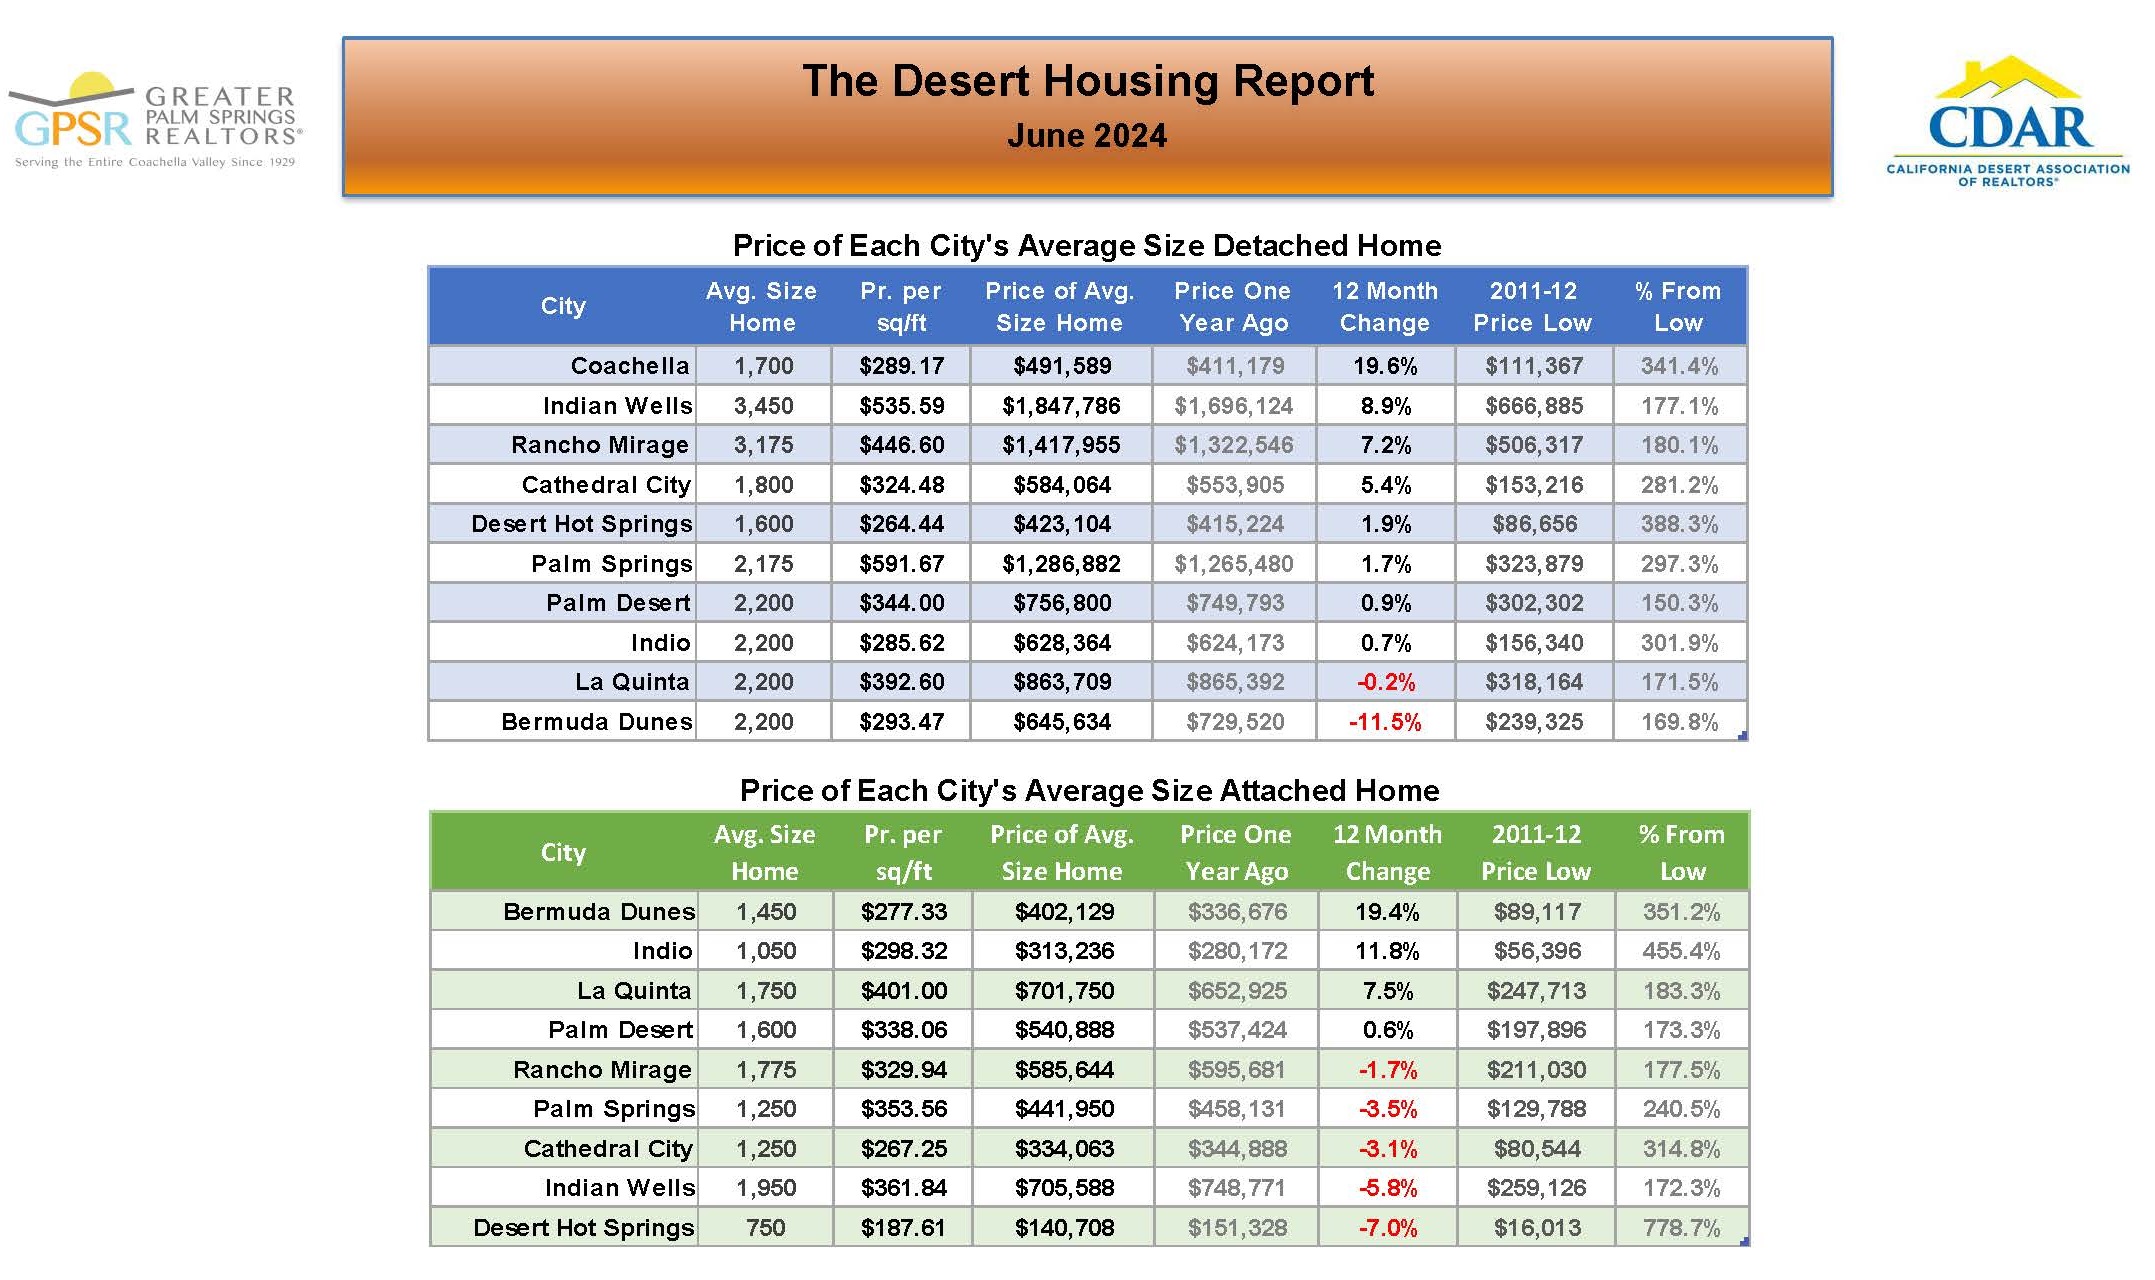 JUNE YEAR-OVER-YEAR CHANGE IN THE PRICE OF THE AVERAGE SIZE COACHELLA VALLEY HOME BY CITY: In June, year-over-year price changes for the average size Coachella Valley detached home by city ranged from an increase of 19.6% for the 1,700 sq ft average size detached home in Coachella to a decrease of 11.5% for the 2,200 sq ft average size detached home in Bermuda Dunes. Year-over-year price changes for the average size Coachella Valley attached home by city ranged from an increase of 19.4% for the 1,450 sq ft average size attached home in Bermuda Dunes to a decrease of 7.0% for the 750 sq ft average size attached home in Desert Hot Springs.
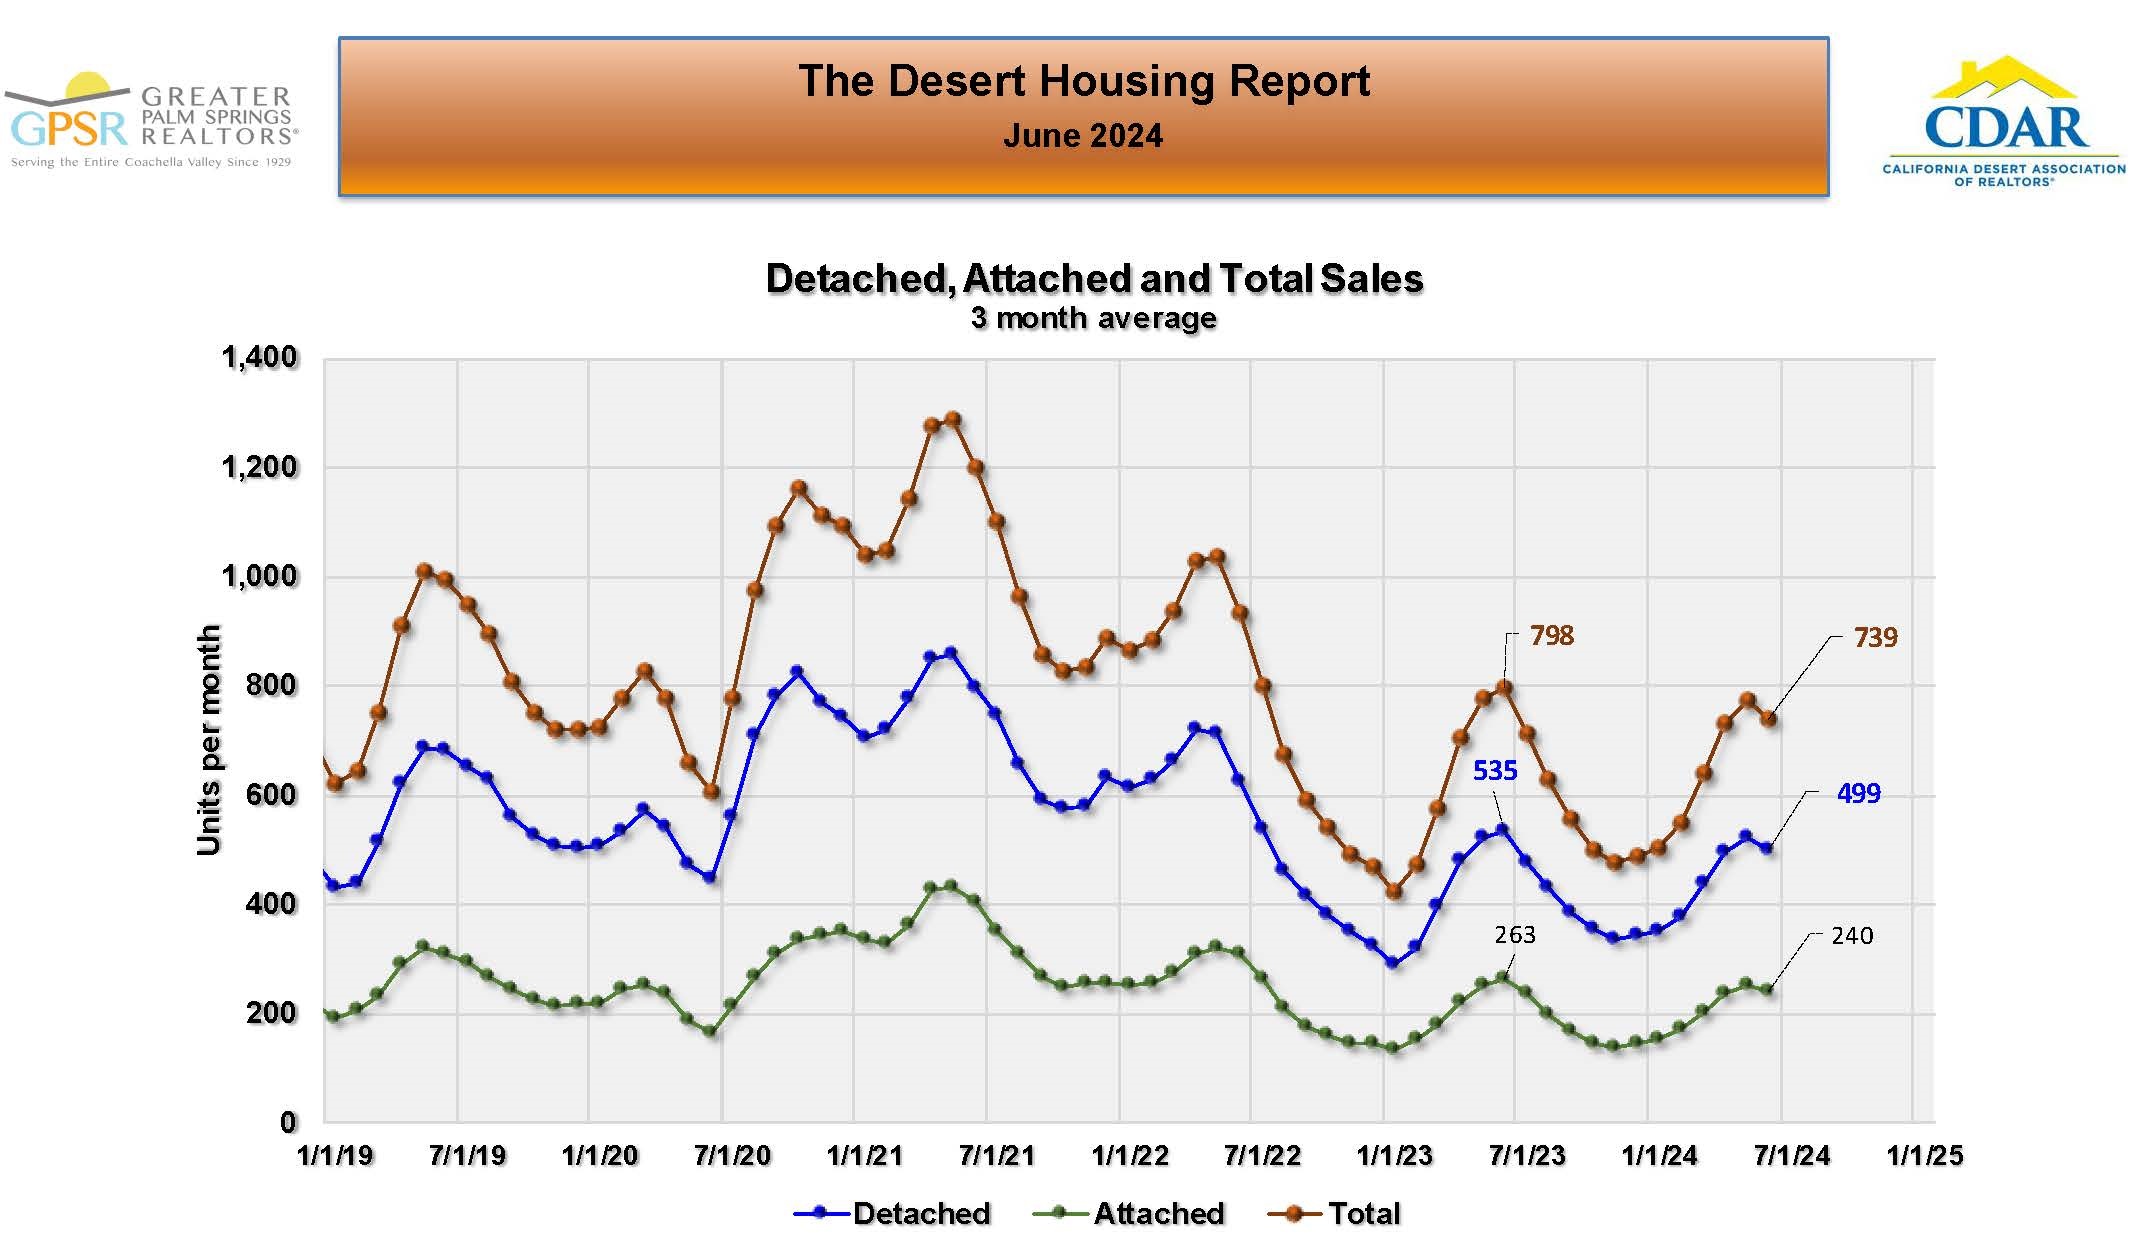 COACHELLA VALLEY JUNE MONTHLY HOME SALES - THREE MONTH AVERAGE: In June, Coachella Valley home sales averaged 739 sales per month (down 7.4% from monthly home sales of 798 in June 2023). Market Watch noted that because of seasonality in Coachella Valley home sales, it's difficult to determine where home sales stand on a historical basis. The Sales Recovery data above was designed to help distinguish seasonal home sales changes from real ones. In June, it showed that Coachella Valley home sales had been decreasing against past norms and were now 23.6% below pre-pandemic norms.
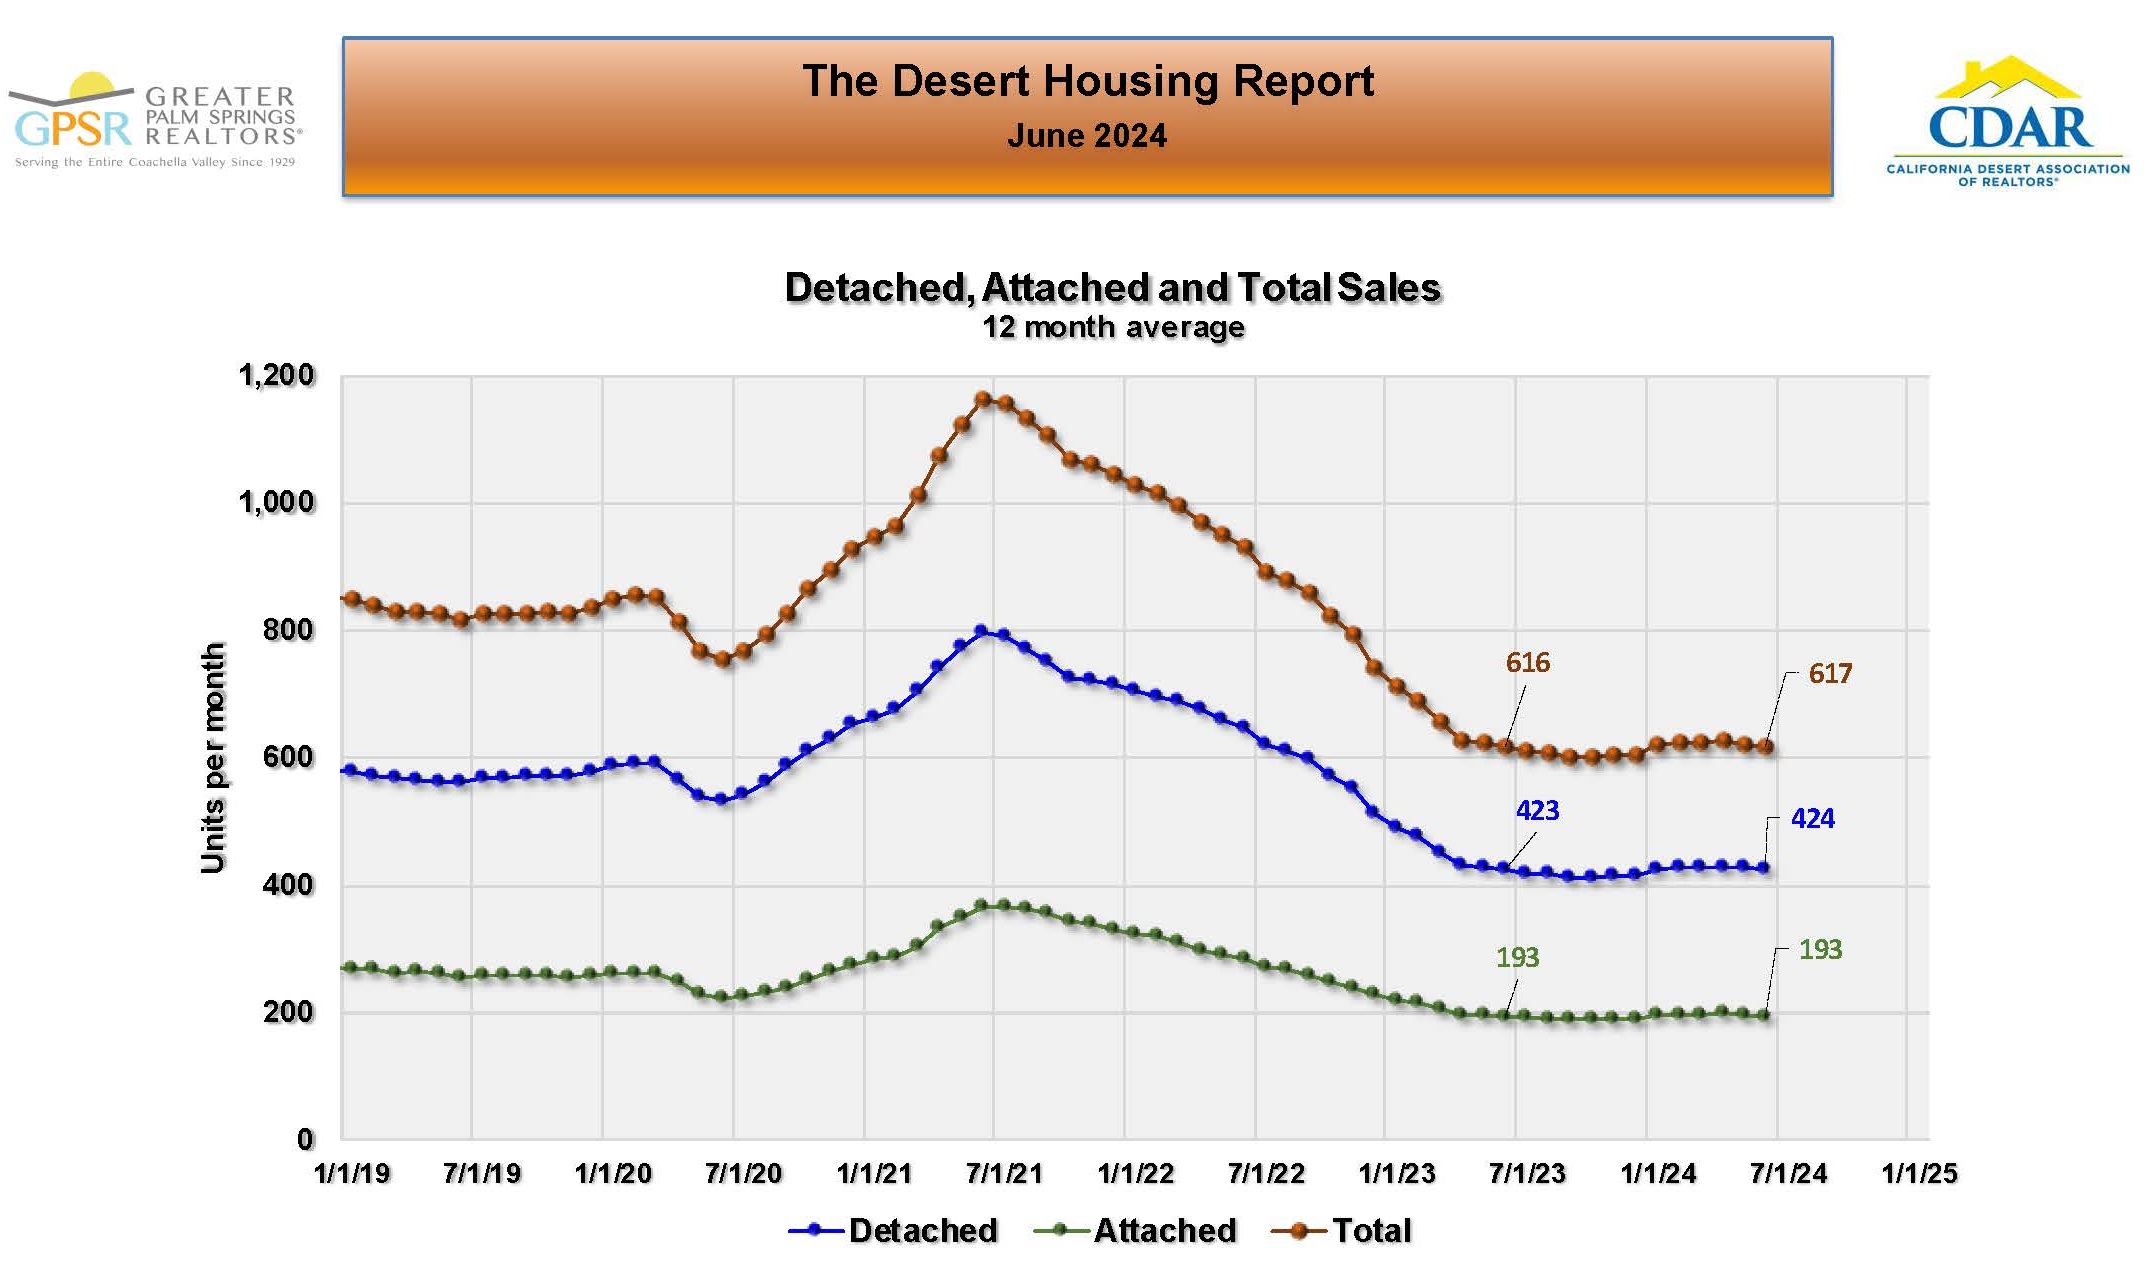 COACHELLA VALLEY JUNE MONTHLY HOME SALES – TWELVE MONTH AVEAGE: In June, the 12-month average of Coachella Valley home sales, which removes seasonality from the data, was 617 sales per month (effectively the same as in June 2023). Market Watch noted that for 15 months, long-term Coachella Valley home sales have been hovering between 600 and 620 home sales per month. They went on to state that although the inflation rate has declined, the Federal Reserve Board seemed reluctant to lower interest rates until the evidence is stronger that inflation would remain low. They hope that will be soon be the case since lower interest rates should stimulate home sales.
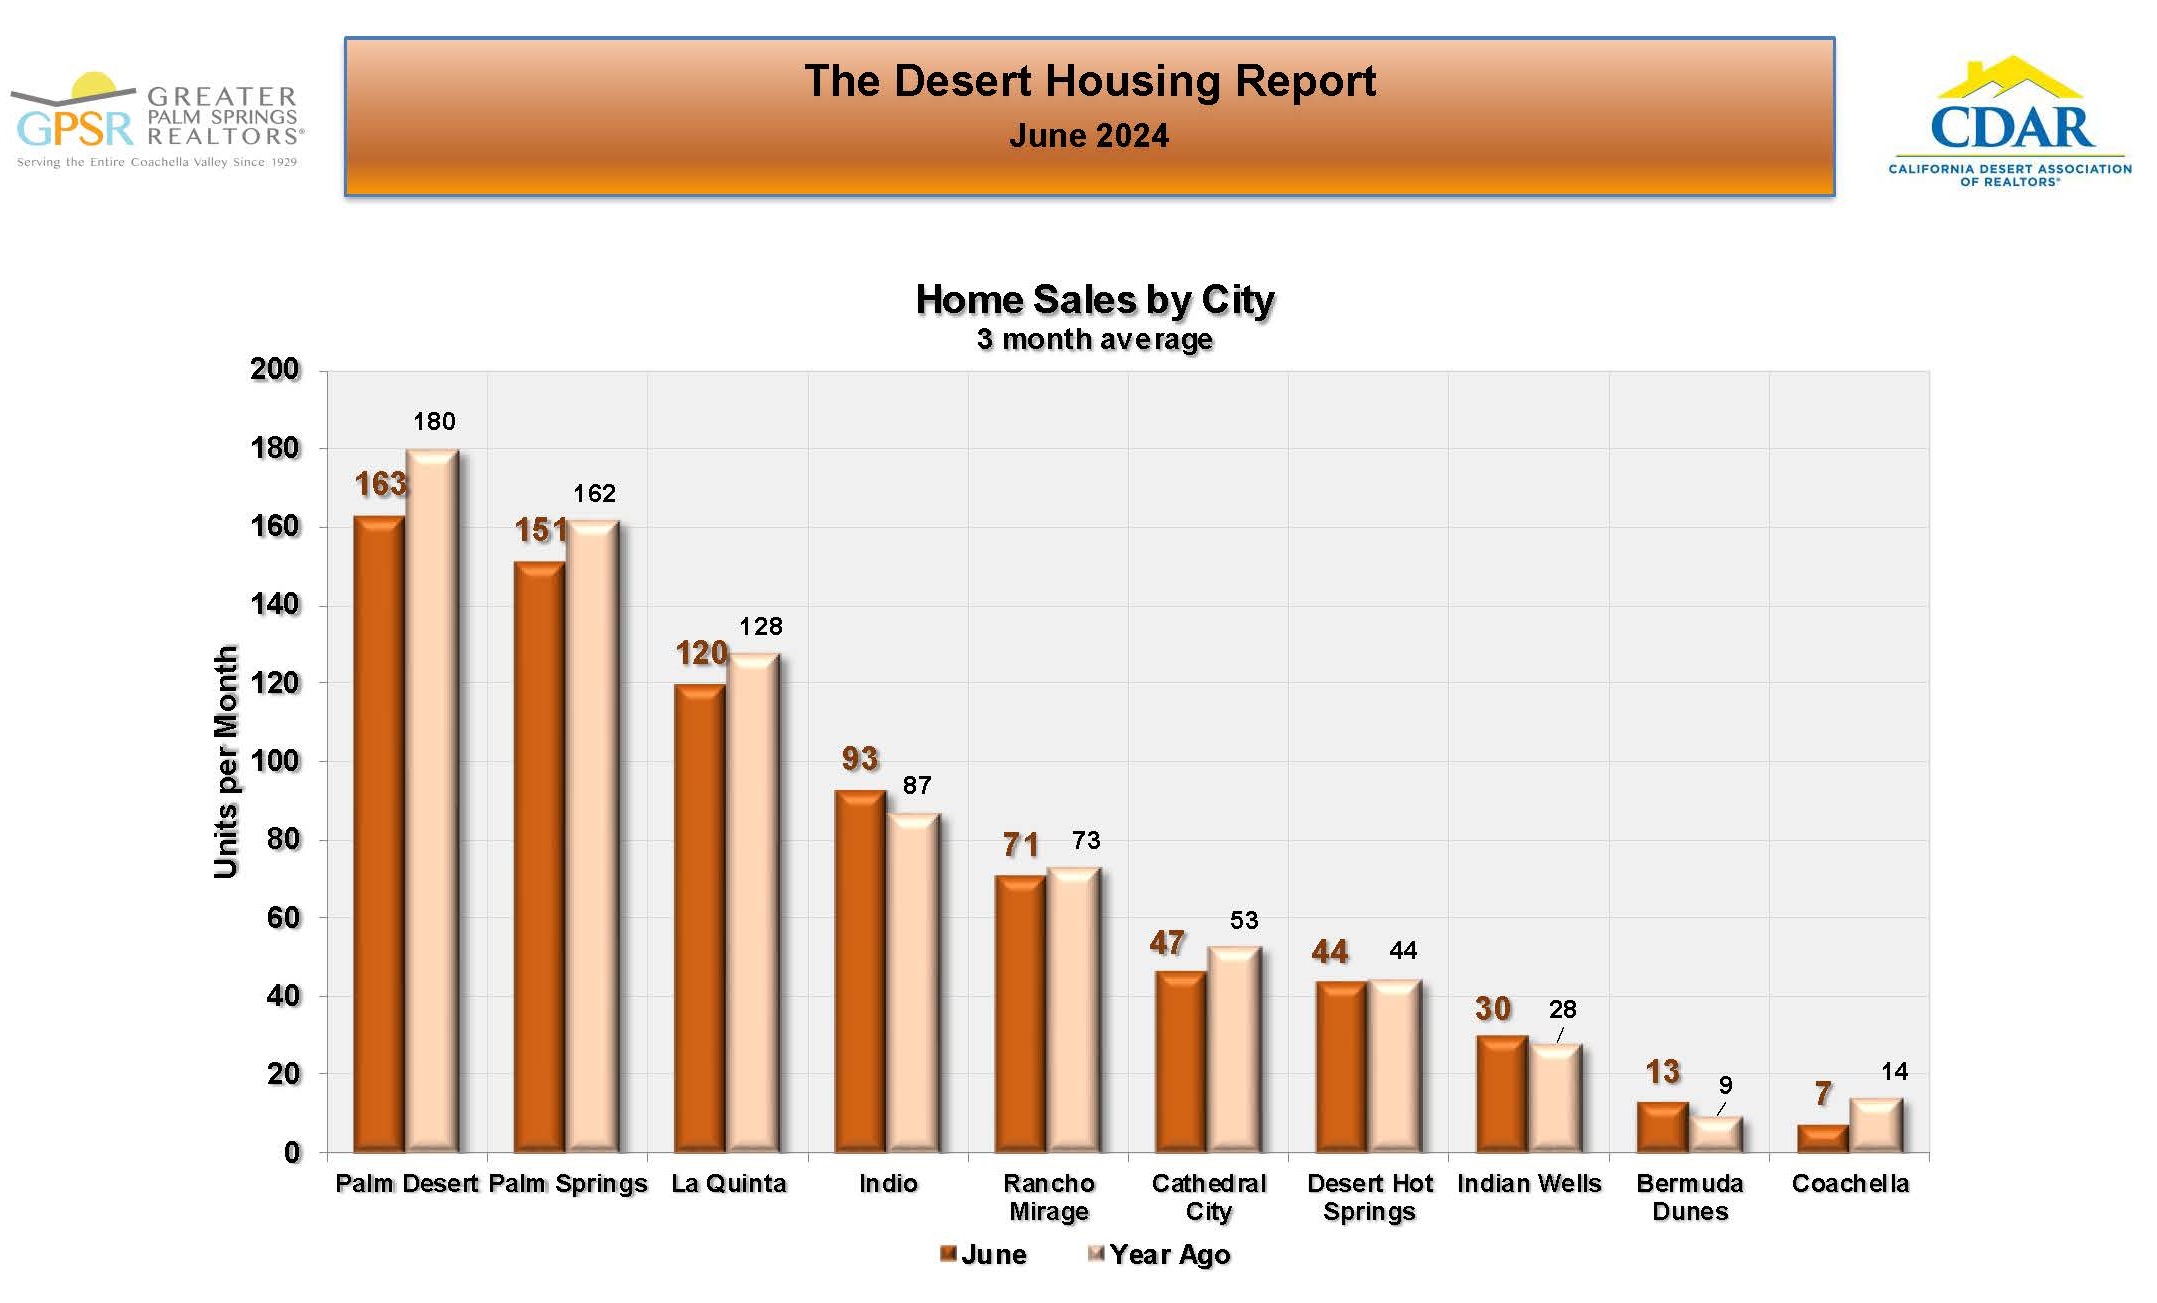
COACHELLA VALLEY JUNE HOME SALES BY CITY: In June, Palm Desert had the highest average monthly home sales at 163 sales per month (down 9.4% from 180 sales per month in June 2023), followed by Palm Springs with an average of 151 home sales per month (down 7% from 162 home sales per month in June 2023). In June, three Coachella Valley cities (Indio, Indian Wells and Bermuda Dunes) had higher average monthly home sales than in June 2023. Average monthly home sales in most of the other Coachella Valley cities were comparable to average monthly home sales in June 2023.
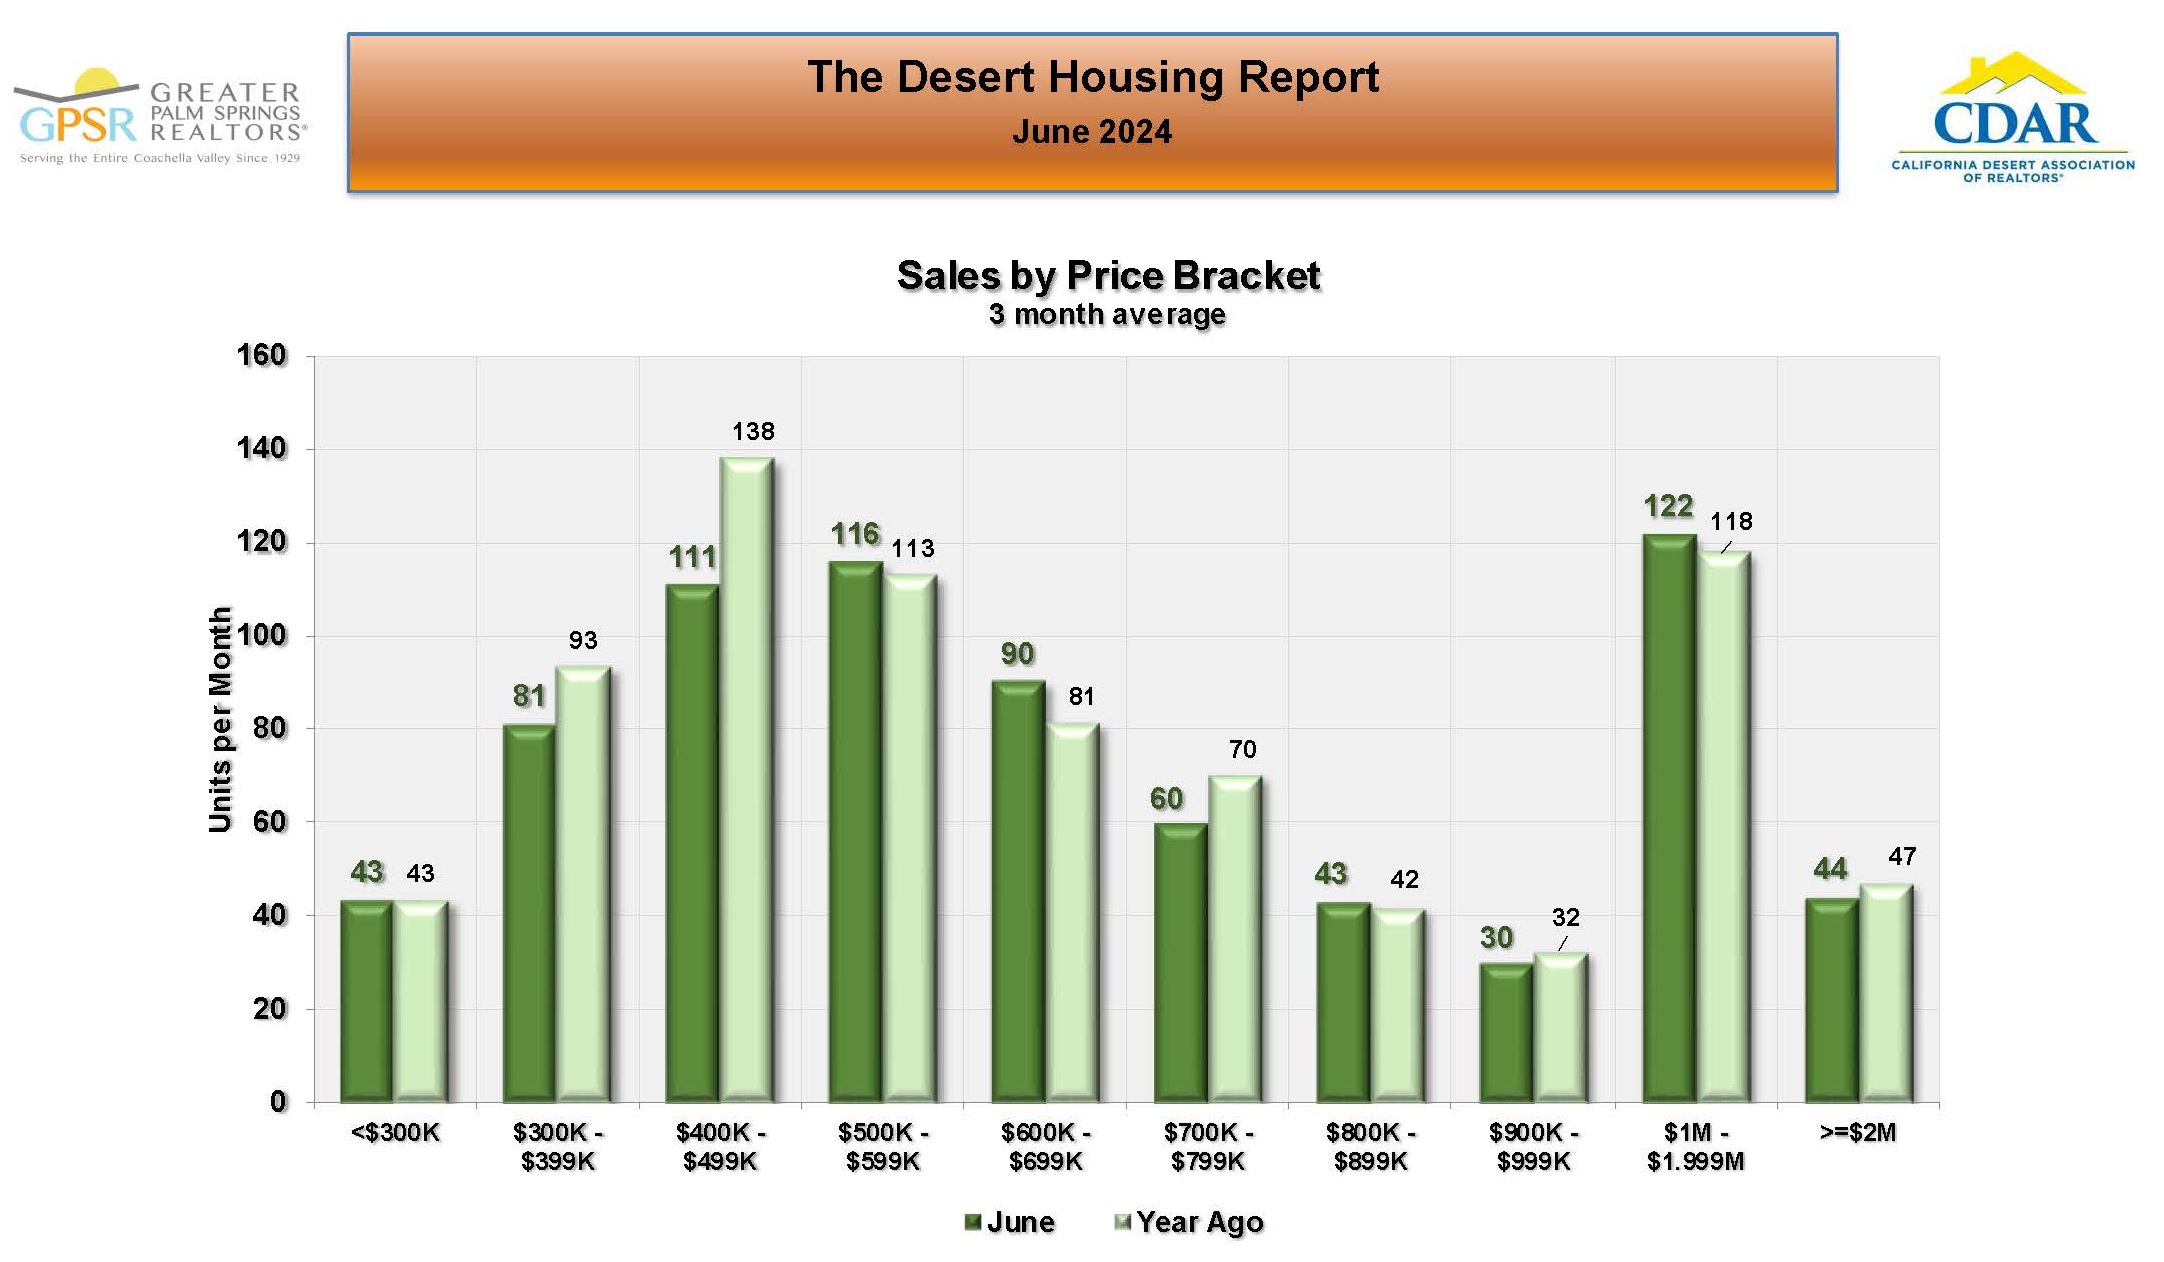
COACHELLA VALLEY JUNE HOME SALES BY PRICE RANGE: In June, average home sales in all price ranges were equal to or lower than in June 2023 other than for homes priced between $1 million and $1.999 million. In this price range, average monthly home sales of 122 sales were up 3.4% from average home sales of 118 in June 2023. Market Watch observed that average monthly home sales were comparable to average monthly home sales in June 2023 in most price ranges above $500,000. They felt that was a positive since it showed that the Coachella Valley housing market remained well balanced in most price ranges.
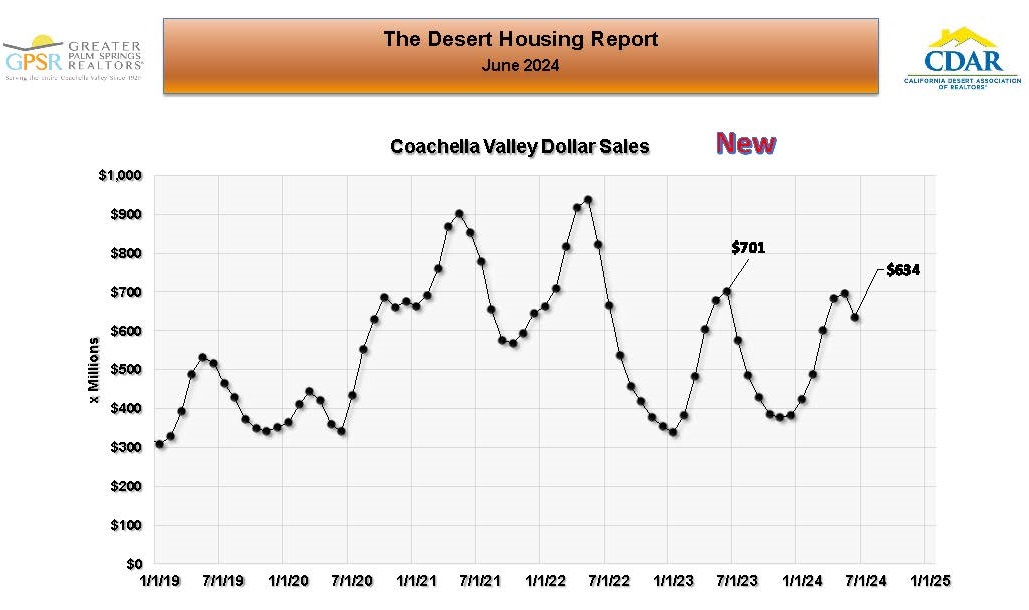 COACHELLA VALLEY JUNE HOME SALES IN DOLLARS: In June, Coachella Valley monthly home sales in dollars averaged $634 million (down 9.6% from average monthly home sales of $701 million in June 2023).
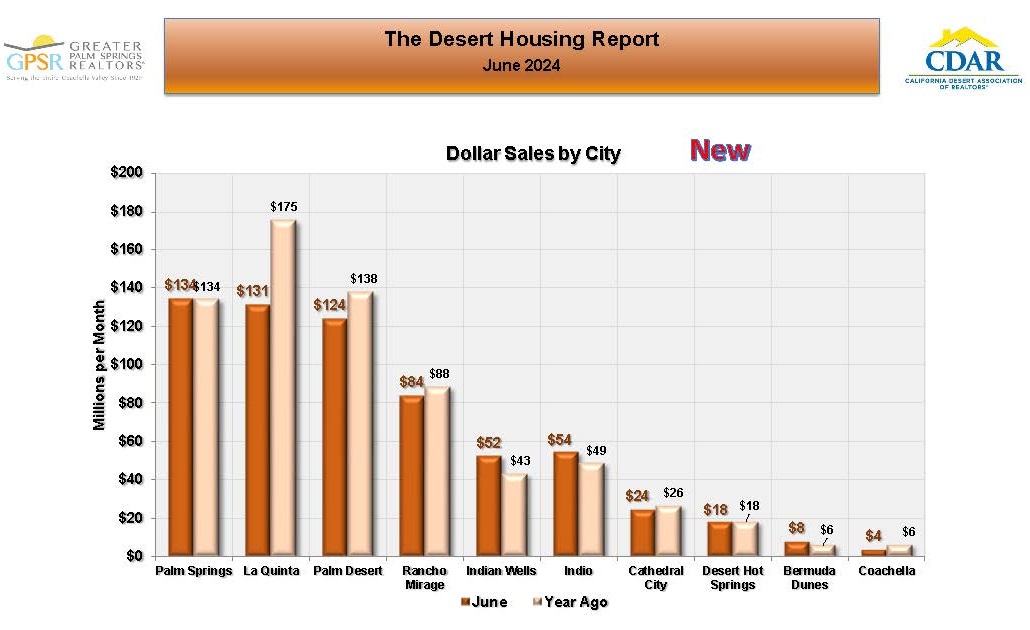 COACHELLA VALLEY JUNE HOME SALES IN DOLLARS BY CITY: In June, Palm Springs had the highest average monthly home sales in dollars at $134 million (the same as in June 2023), followed by La Quinta with average monthly home sales by dollar of $131 million (down 25.1% from $175 million in June 2023). In June, three Coachella Valley cities (Indian Wells, Indio and Bermuda Dunes) had higher home sales in dollars than in June 2023. Average monthly home sales in dollars in most of the other Coachella Valley cities were comparable to average monthly home sales in dollars in June 2023
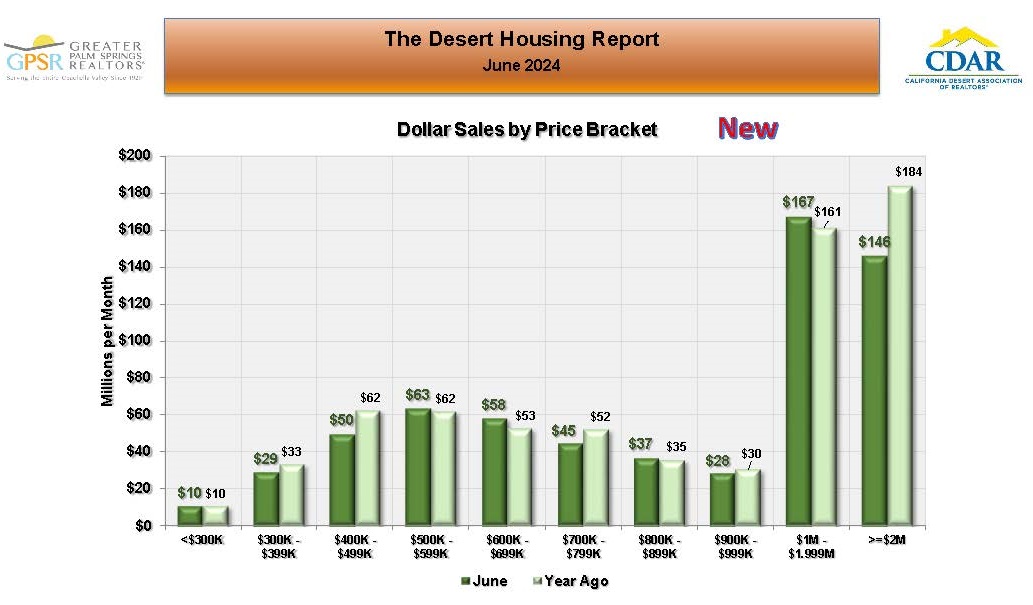 COACHELLA VALLEY JUNE HOME SALES IN DOLLARS BY PRICE RANGE: In June, home sales in dollars increased year-over-year in the $500K-$599K, $600K-$699K, $800K-$899K and $1M-$1.999M price ranges. Market Watch pointed out that average monthly home sales in the $1M-$1.999M and at or above $2M prices ranges accounted for roughly 50% of all dollar sales in the Coachella Valley.
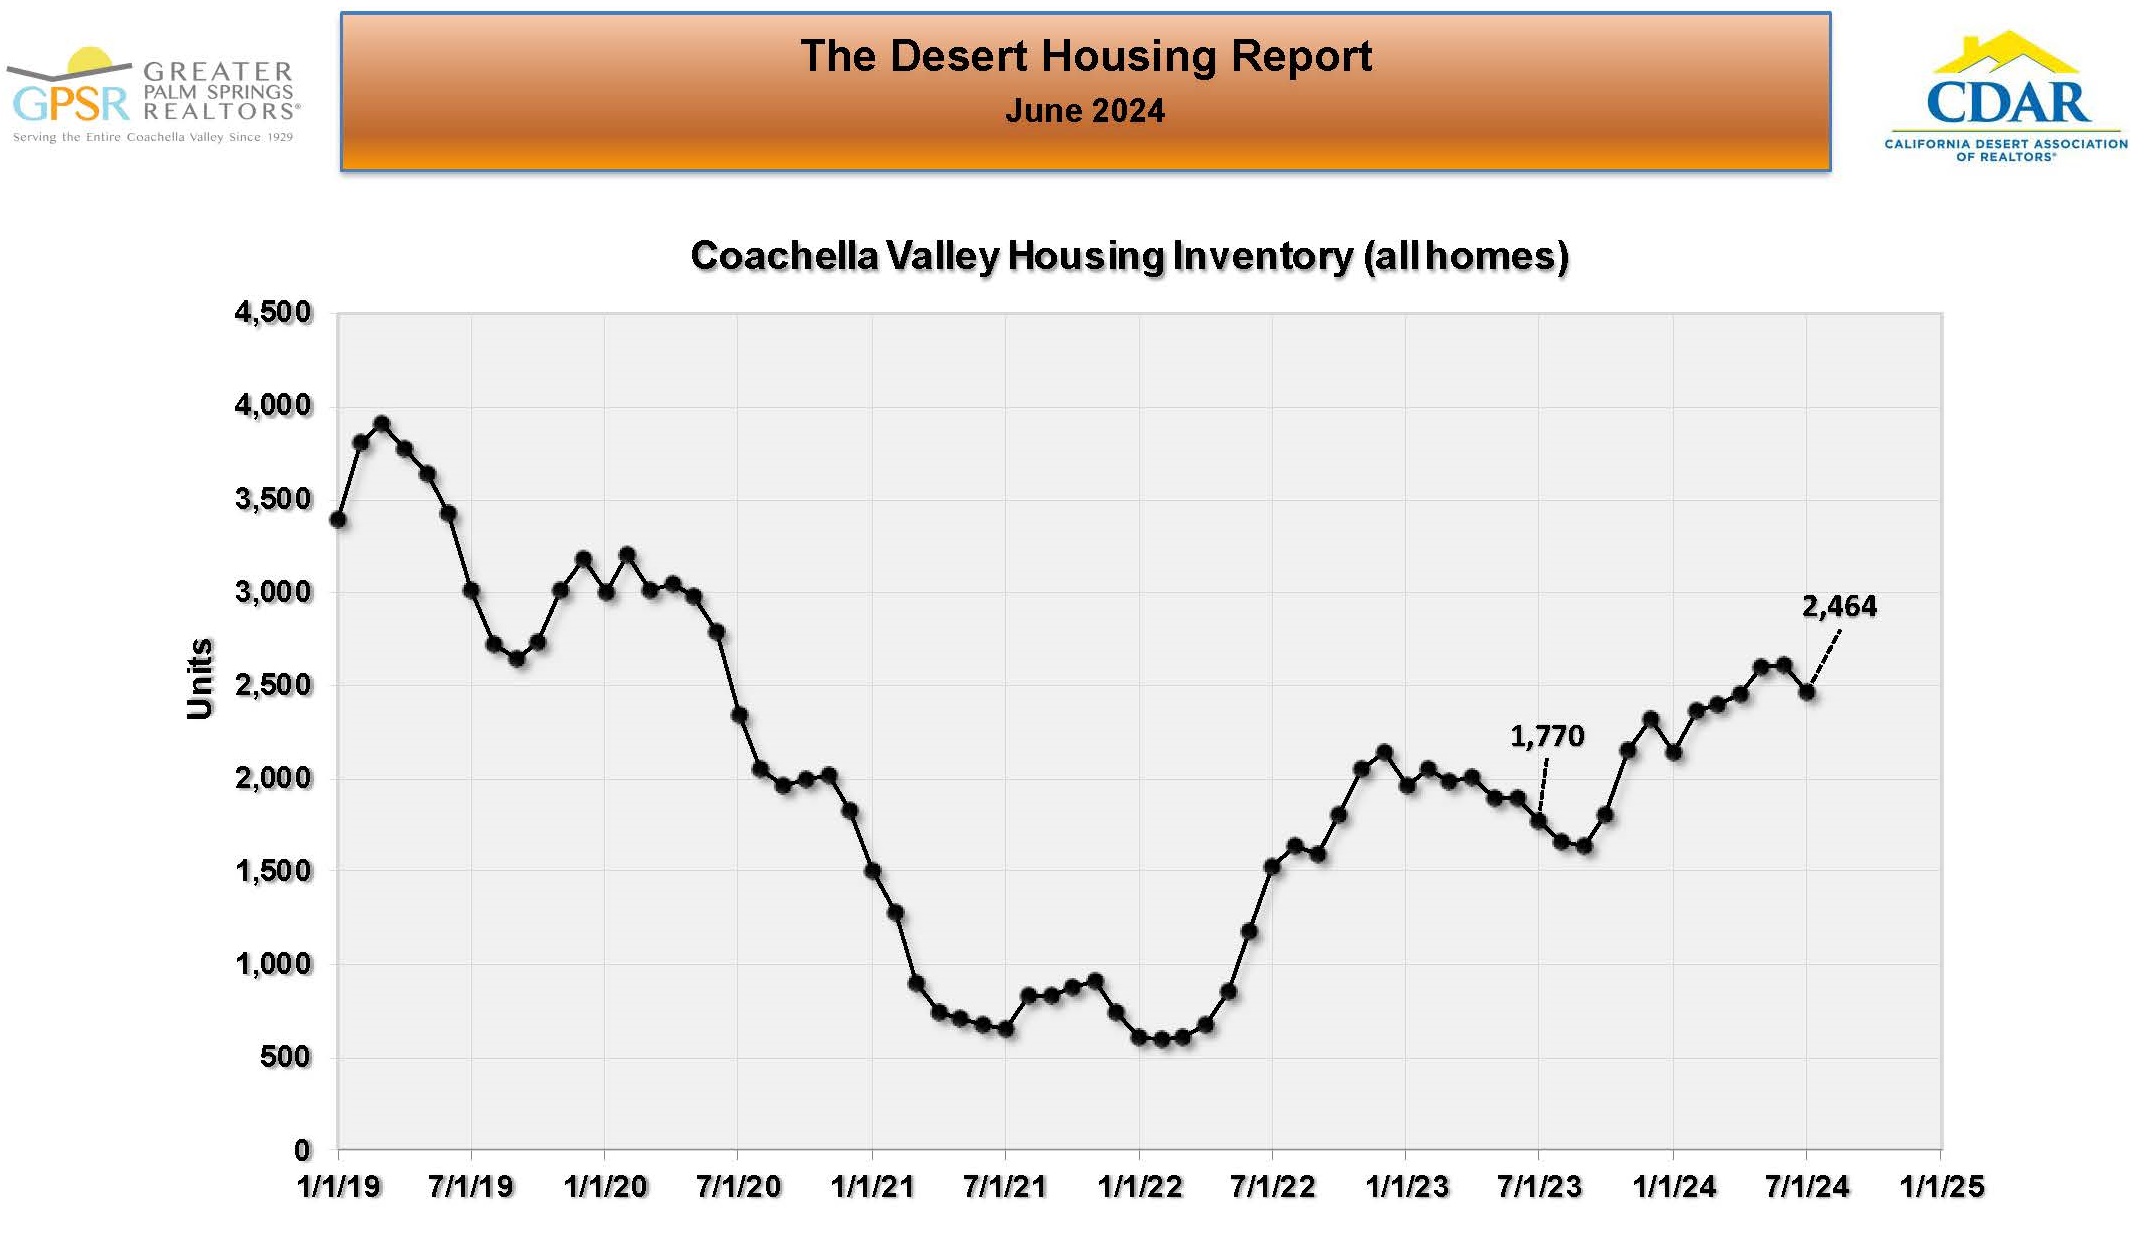 COACHELLA VALLEY JULY 1ST TOTAL HOME SALES INVENTORY: On July 1st, the Coachella Valley home sales inventory was 2,464 homes (down 5.6% from 2,610 homes on June 1st but up 39.2% from 1,770 homes on July 1st, 2023). Market Watch stated that the usual seasonal pattern now suggested that inventory would continue to decline entering the summer months. They further noted that while inventory had gradually improved, the current level continued to be about 1,000 units below pre-pandemic norms for this time of year.
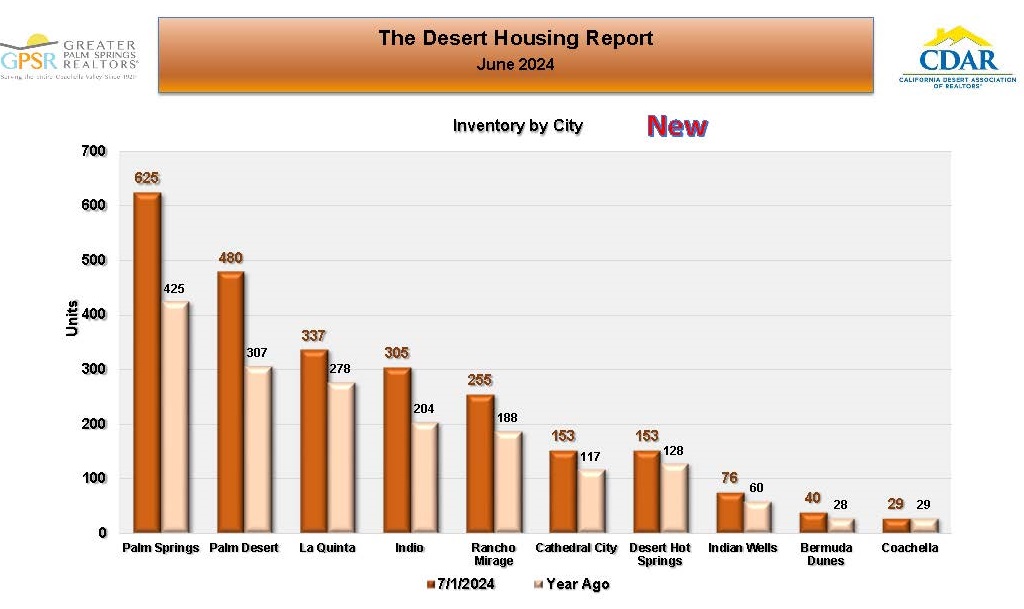 COACHELLA VALLEY JULY 1ST HOME SALES INVENTORY BY CITY: On July 1st, the largest home sales inventory was 625 homes in Palm Springs (up 47.1% from 425 homes on July 1st, 2023) followed by Palm Desert at 480 homes (up 56.4% from 307 homes on July 1st, 2023). Market Watch noted that this data helps agents know what cities have homeowners with the greatest selling interest compared to last year.
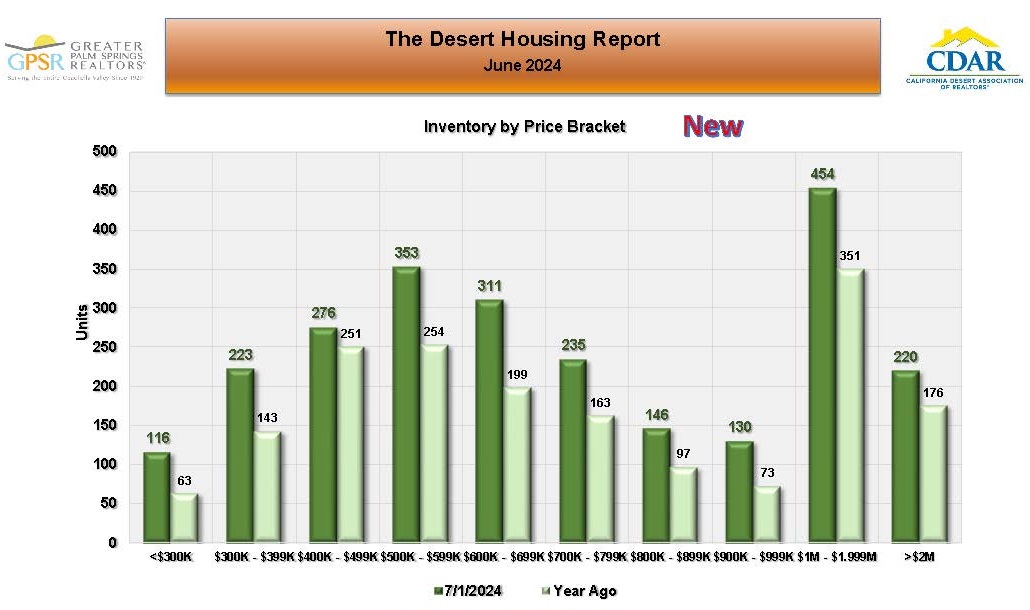 COACHELLA VALLEY JULY 1ST HOME SALES INVENTORY BY PRICE RANGE: On July 1st, Coachella Valley home inventory was up in every price range. Market Watch noted that this data helps locate what price brackets might be responsible for the growth or contraction of inventory.
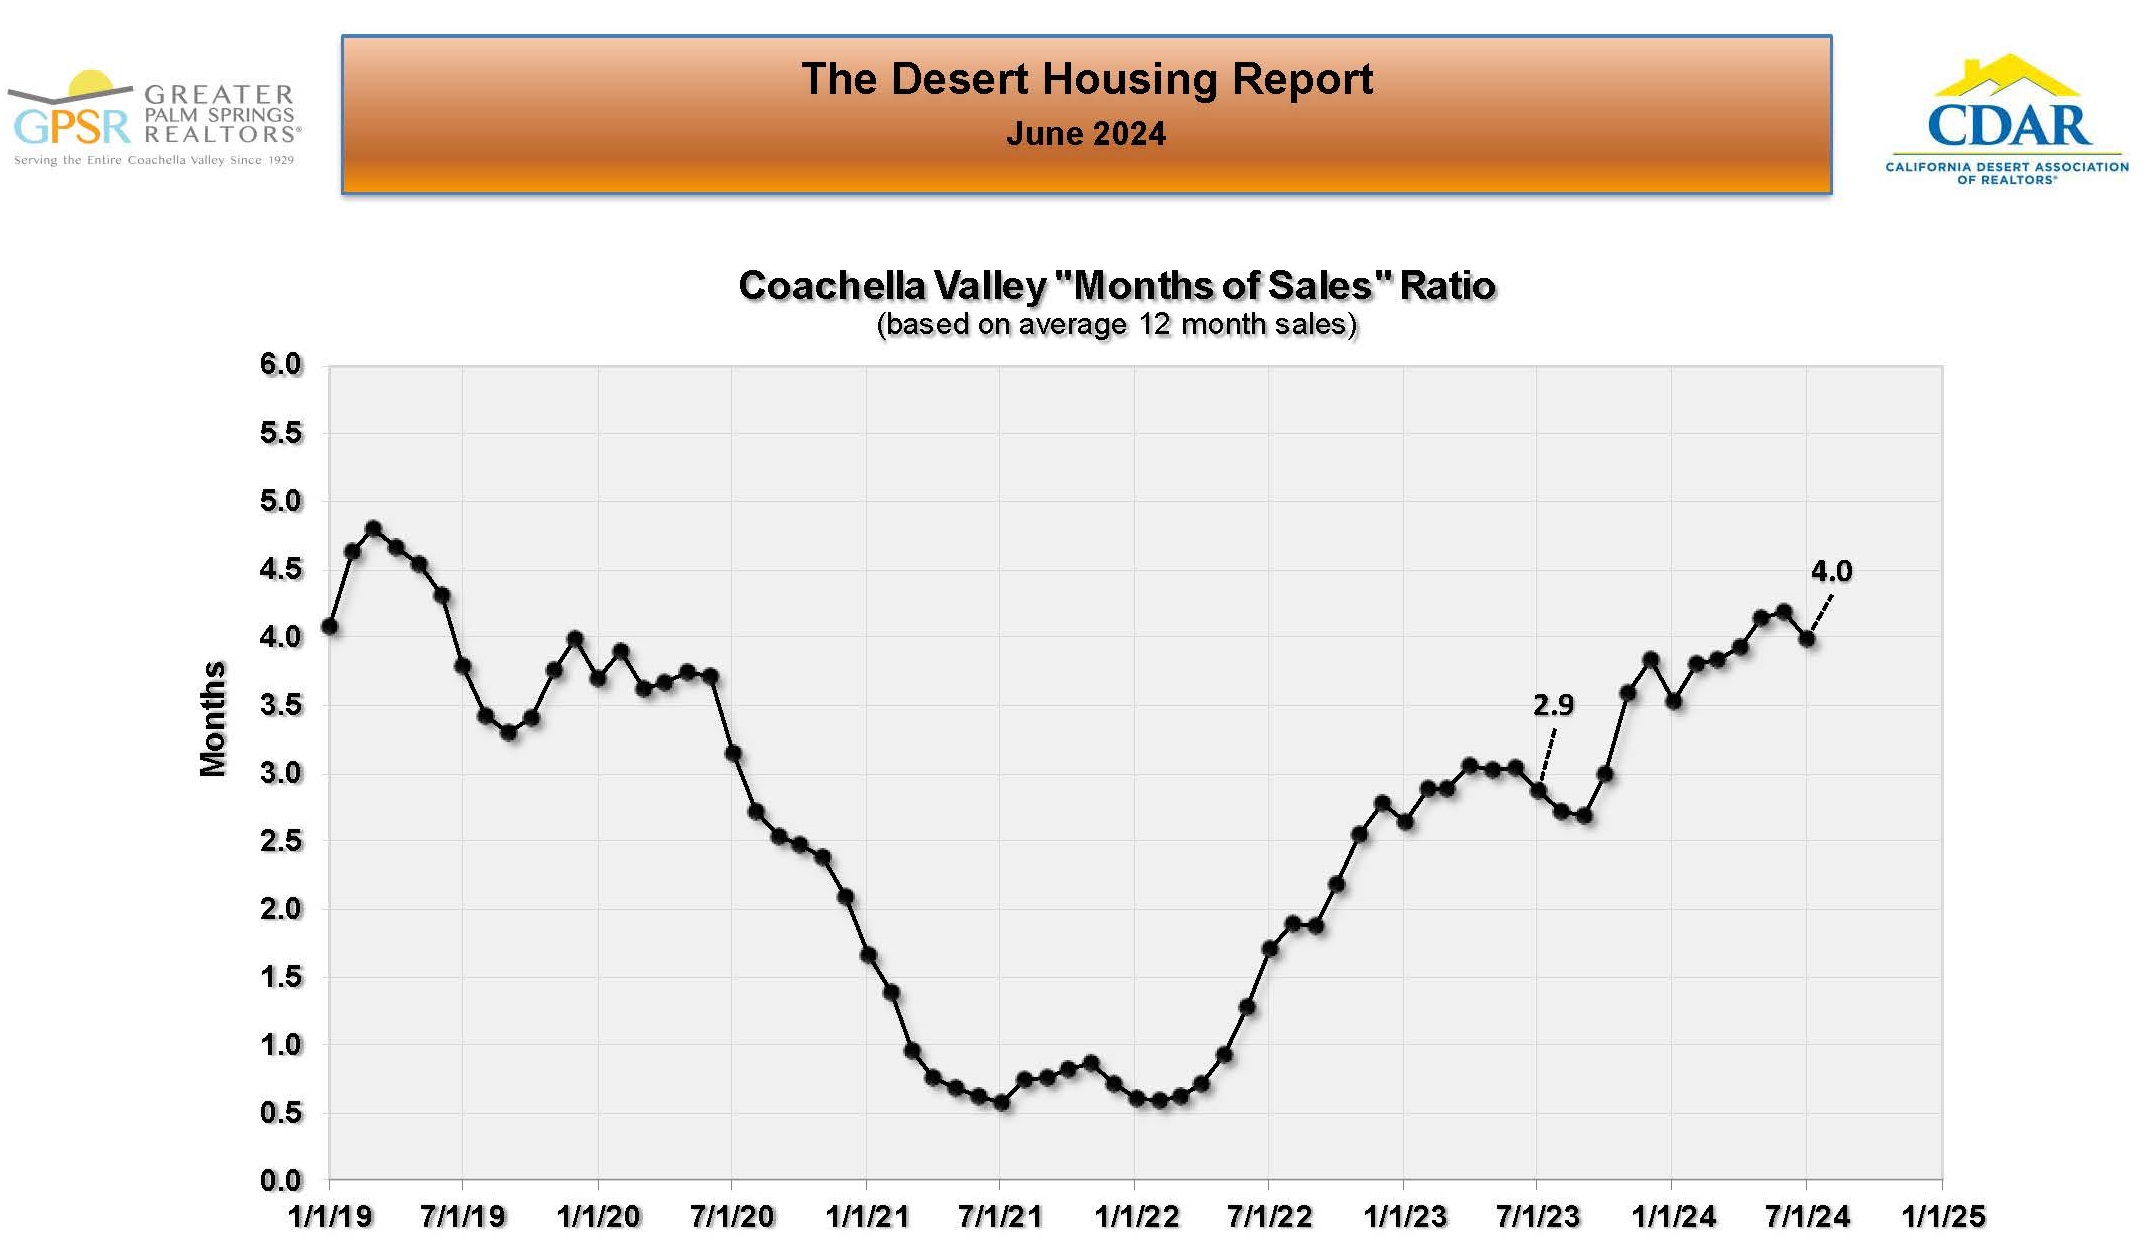 COACHELLA VALLEY JULY 1ST REGIONAL MONTHS OF SALES RATIO: On July 1st, the Coachella Valley’s months of sales ratio was 4.0 months (up 1.1 months from 2.9 months on July 1st, 2023). Market Watch noted that this fundamental ratio, which measures supply and demand, is now back to pre-pandemic levels. They added that even though inventory was still relatively low, the low sales numbers have kept supply and demand in balance, which was one major reason that home prices had remained stable over the last twelve months. Lastly, they felt that seasonal factors should help lower this ratio over the next few months.
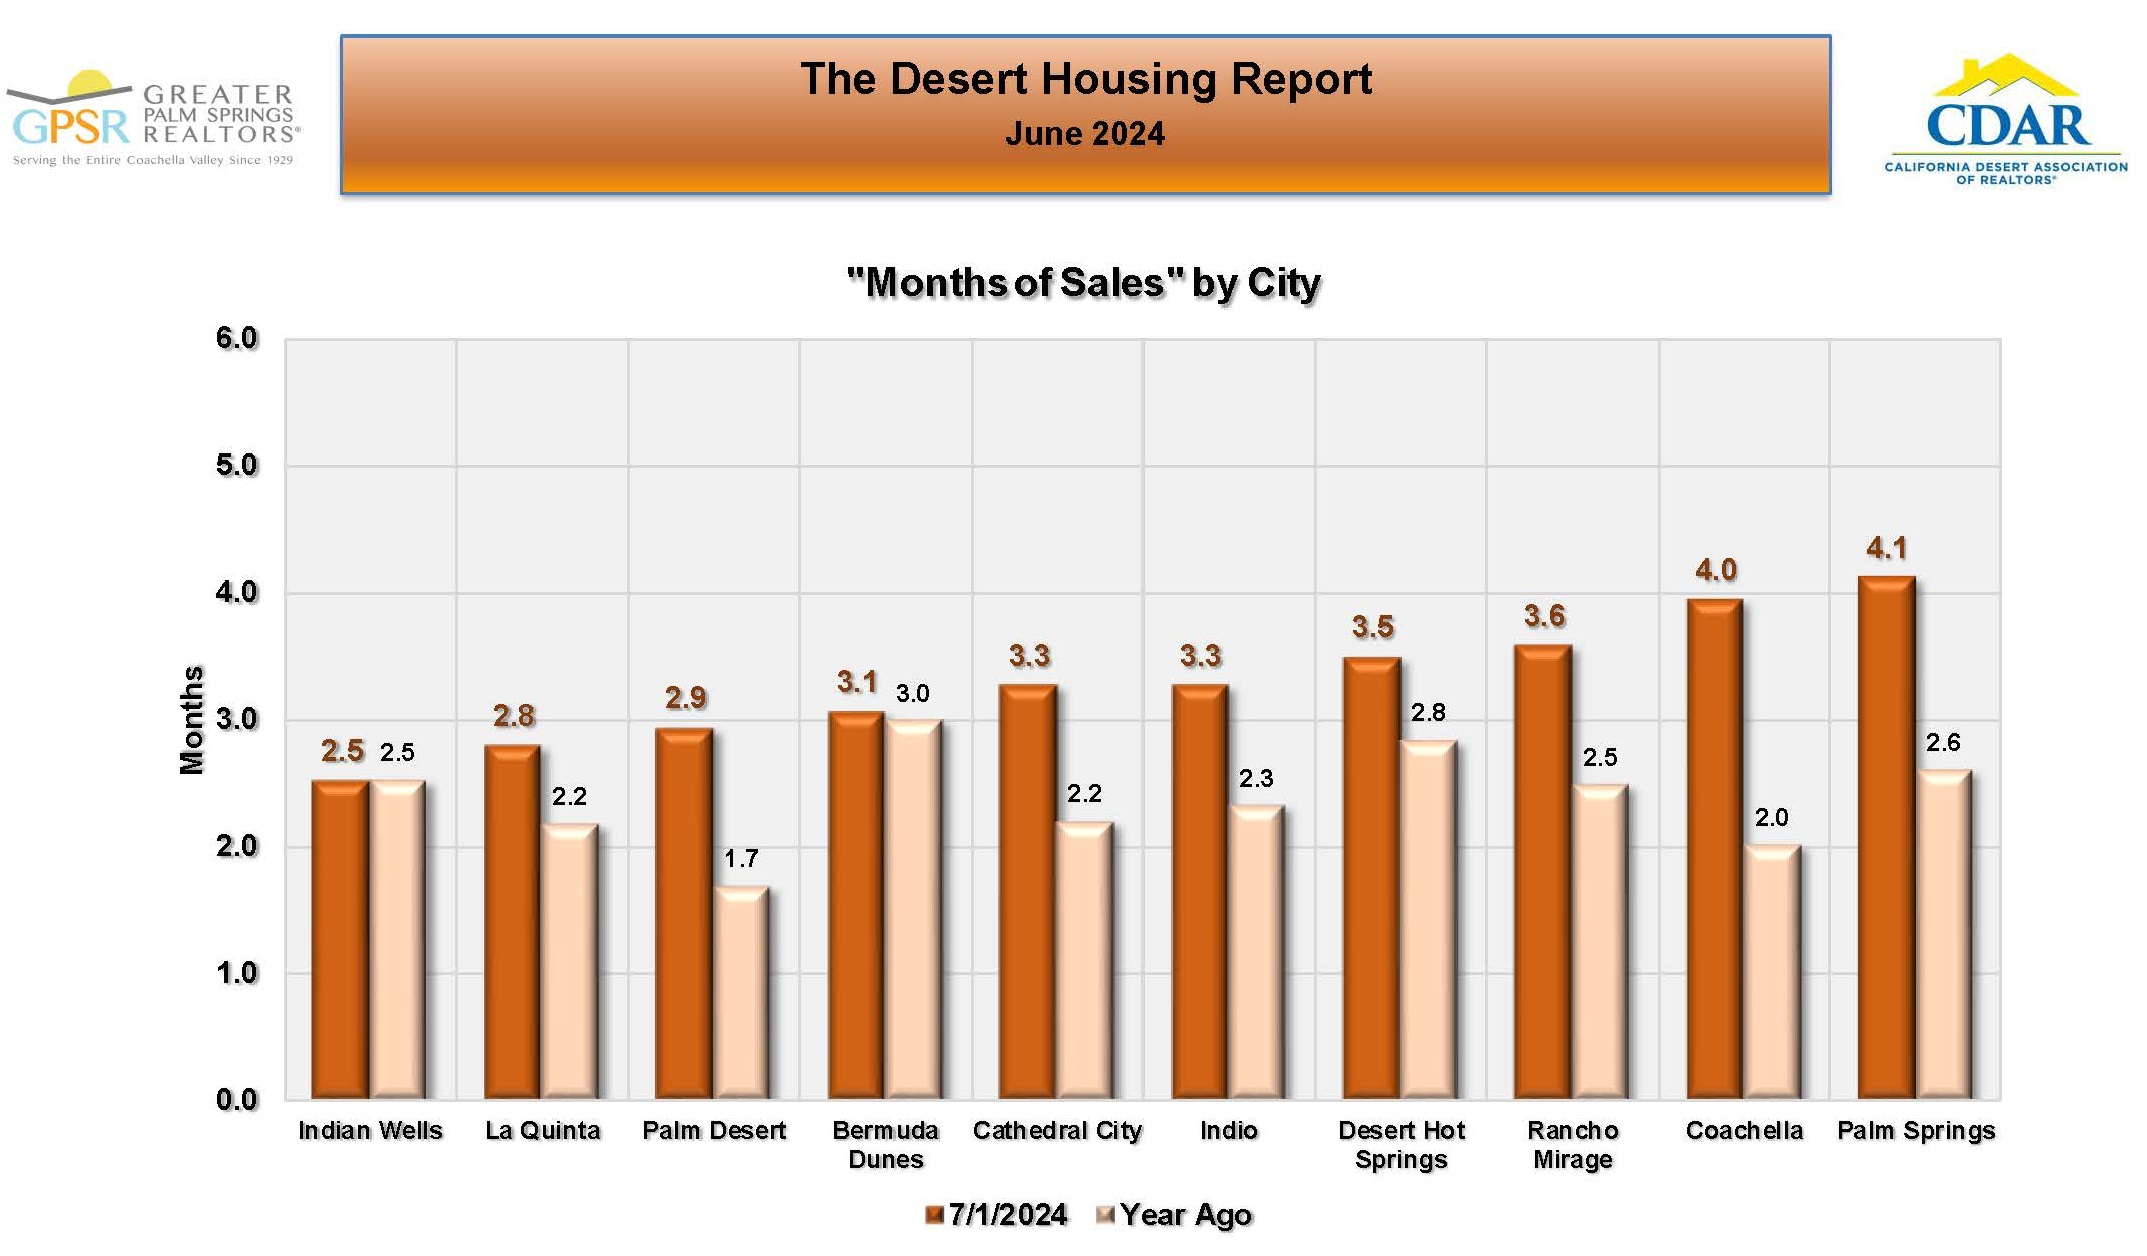 COACHELLA VALLEY JULY 1ST MONTHS OF SALES RATIO BY CITY: On July 1st, months of sales ratios by city varied from a low of 2.5 months in Indian Wells to a high of 4.1 months in Palm Springs. Market Watch stated that since months of sales is really the supply-demand equation for housing, it showed the Coachella Valley housing market remained balanced.
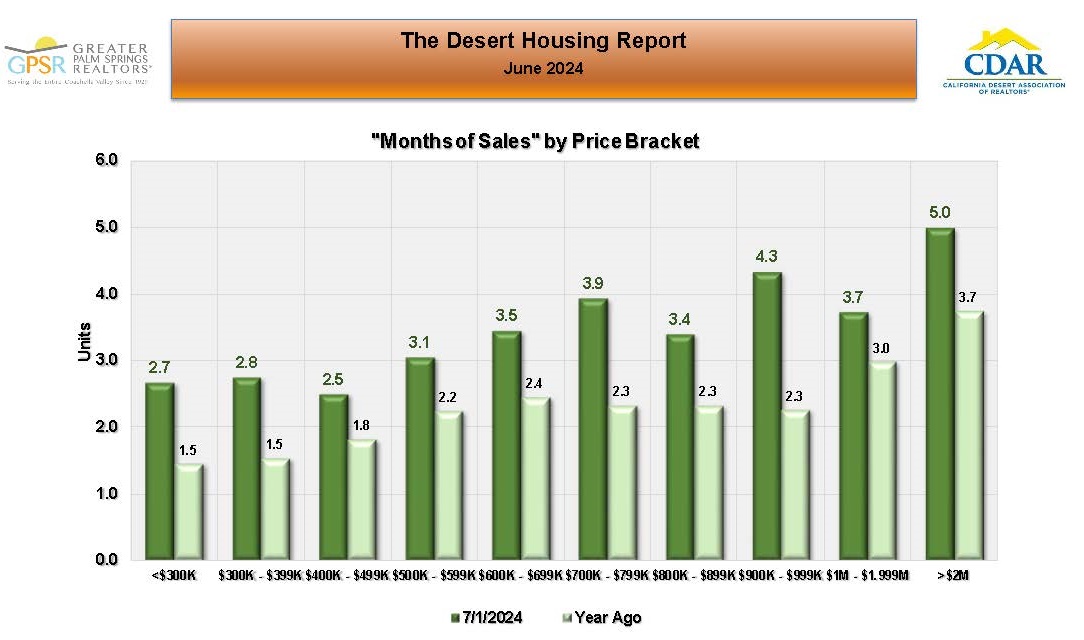 COACHELLA VALLEY JULY 1ST MONTHS OF SALES RATIO BY PRICE RANGE: On July 1st, months of sales ratios by price range varied from a low of 2.5 months for homes priced in the $400K-$499K range to a high of 5 months for homes price at or above $2M. Market Watch noted that they continued to see similar increases in year over year months of sales ratios in all price ranges. Once again they added that since months of sales is really the supply-demand equation for housing, this increase shows the supply side of the market is broadly increasing but is not yet are worrisome levels.
 COACHELLA VALLEY JUNE REGIONAL DAYS IN THE MARKET: At the end of June, the median number of days in the market in the Coachella Valley was 45 days (the same as last month but 7 days more than the 38 days in June 2023). Market Watch stated that they continued to believe the median selling time would remain around current levels continuing into the second half of the year.
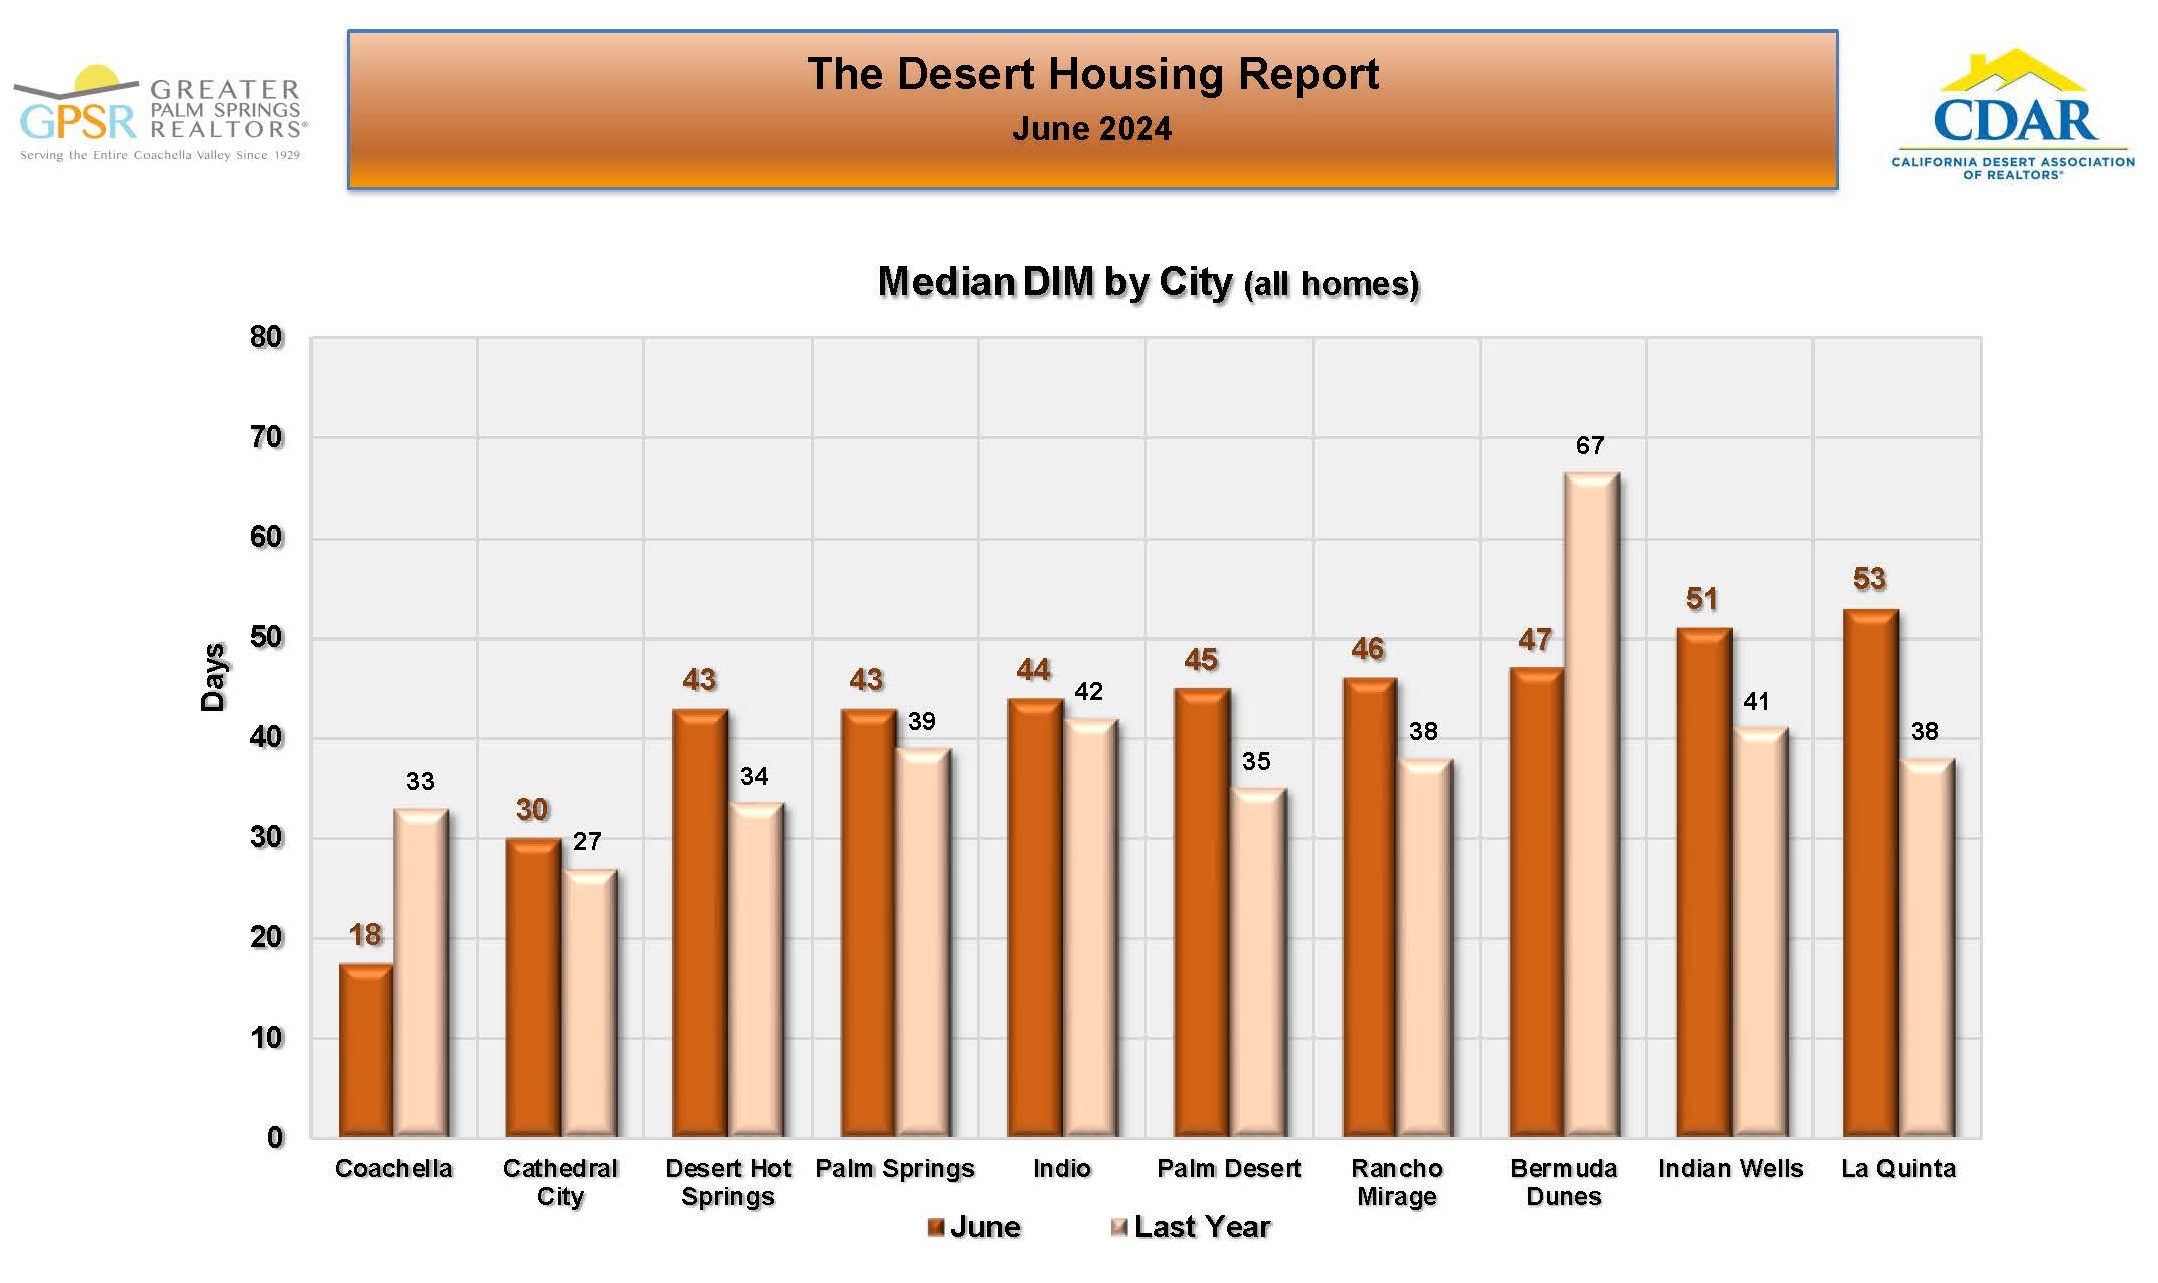 COACHELLA VALLEY JUNE DAYS IN THE MARKET BY CITY: In June, Coachella continued to have the lowest average selling time at 18 days (down from 33 days in June 2023), followed by Cathedral City at 30 days (up from 27 days in June 2023) and Desert Hot Springs at 43 days (up from 34 days in June 2023). In June, La Quinta had the highest, average selling time at 53 days (up from 38 days in June 2023).
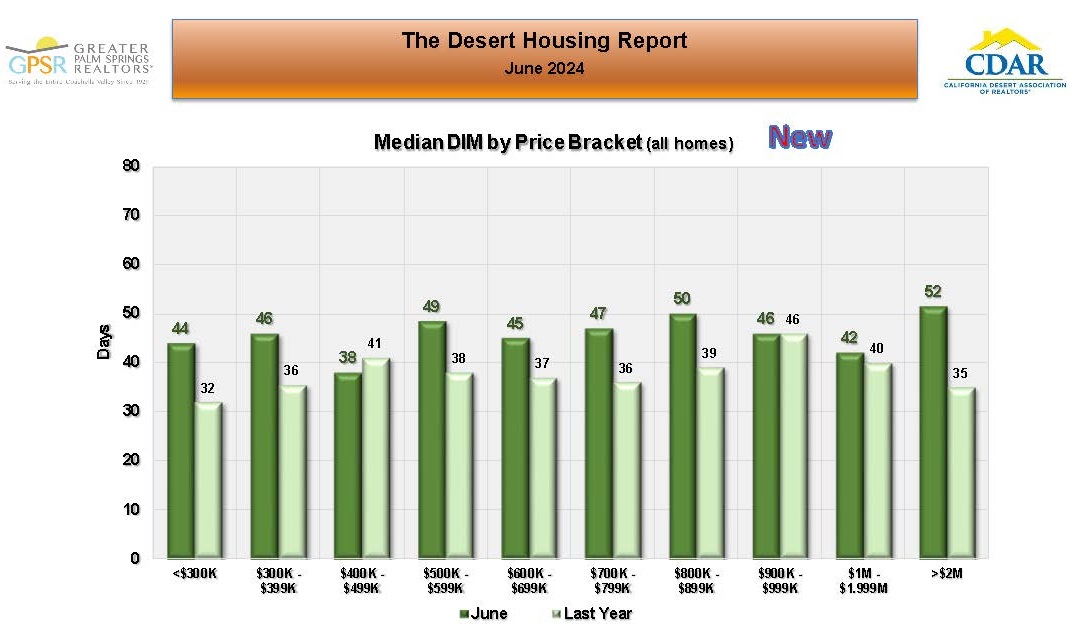
COACHELLA VALLEY JUNE DAYS IN THE MARKET BY PRICE RANGE: In June, homes in the $400K-$499K price range had the lowest average selling time at 38 days (down from 41 days in June 2023), followed by homes in the $1M to $1.999M price range at 42 days (up from 40 days in June 2023). In June, homes priced at or above $2M had the highest average selling time at 52 days (up from 35 days in June 2023). Market Watch cautioned that it was important, when looking at these numbers, to notice if any price bracket has an abnormal number of days in the market, as a high number of days in the market might show a slight market disruption in that price range.
 COACHELLA VALLEY JUNE REGIONAL PRICE PREMIUM/DISCOUNT: In June, detached homes in the Coachella Valley were selling at an average discount of 2.0% while attached homes were selling at an average discount of 2.6%. Market Watch stated that these current discounts remain in line with the pre-covid averages.
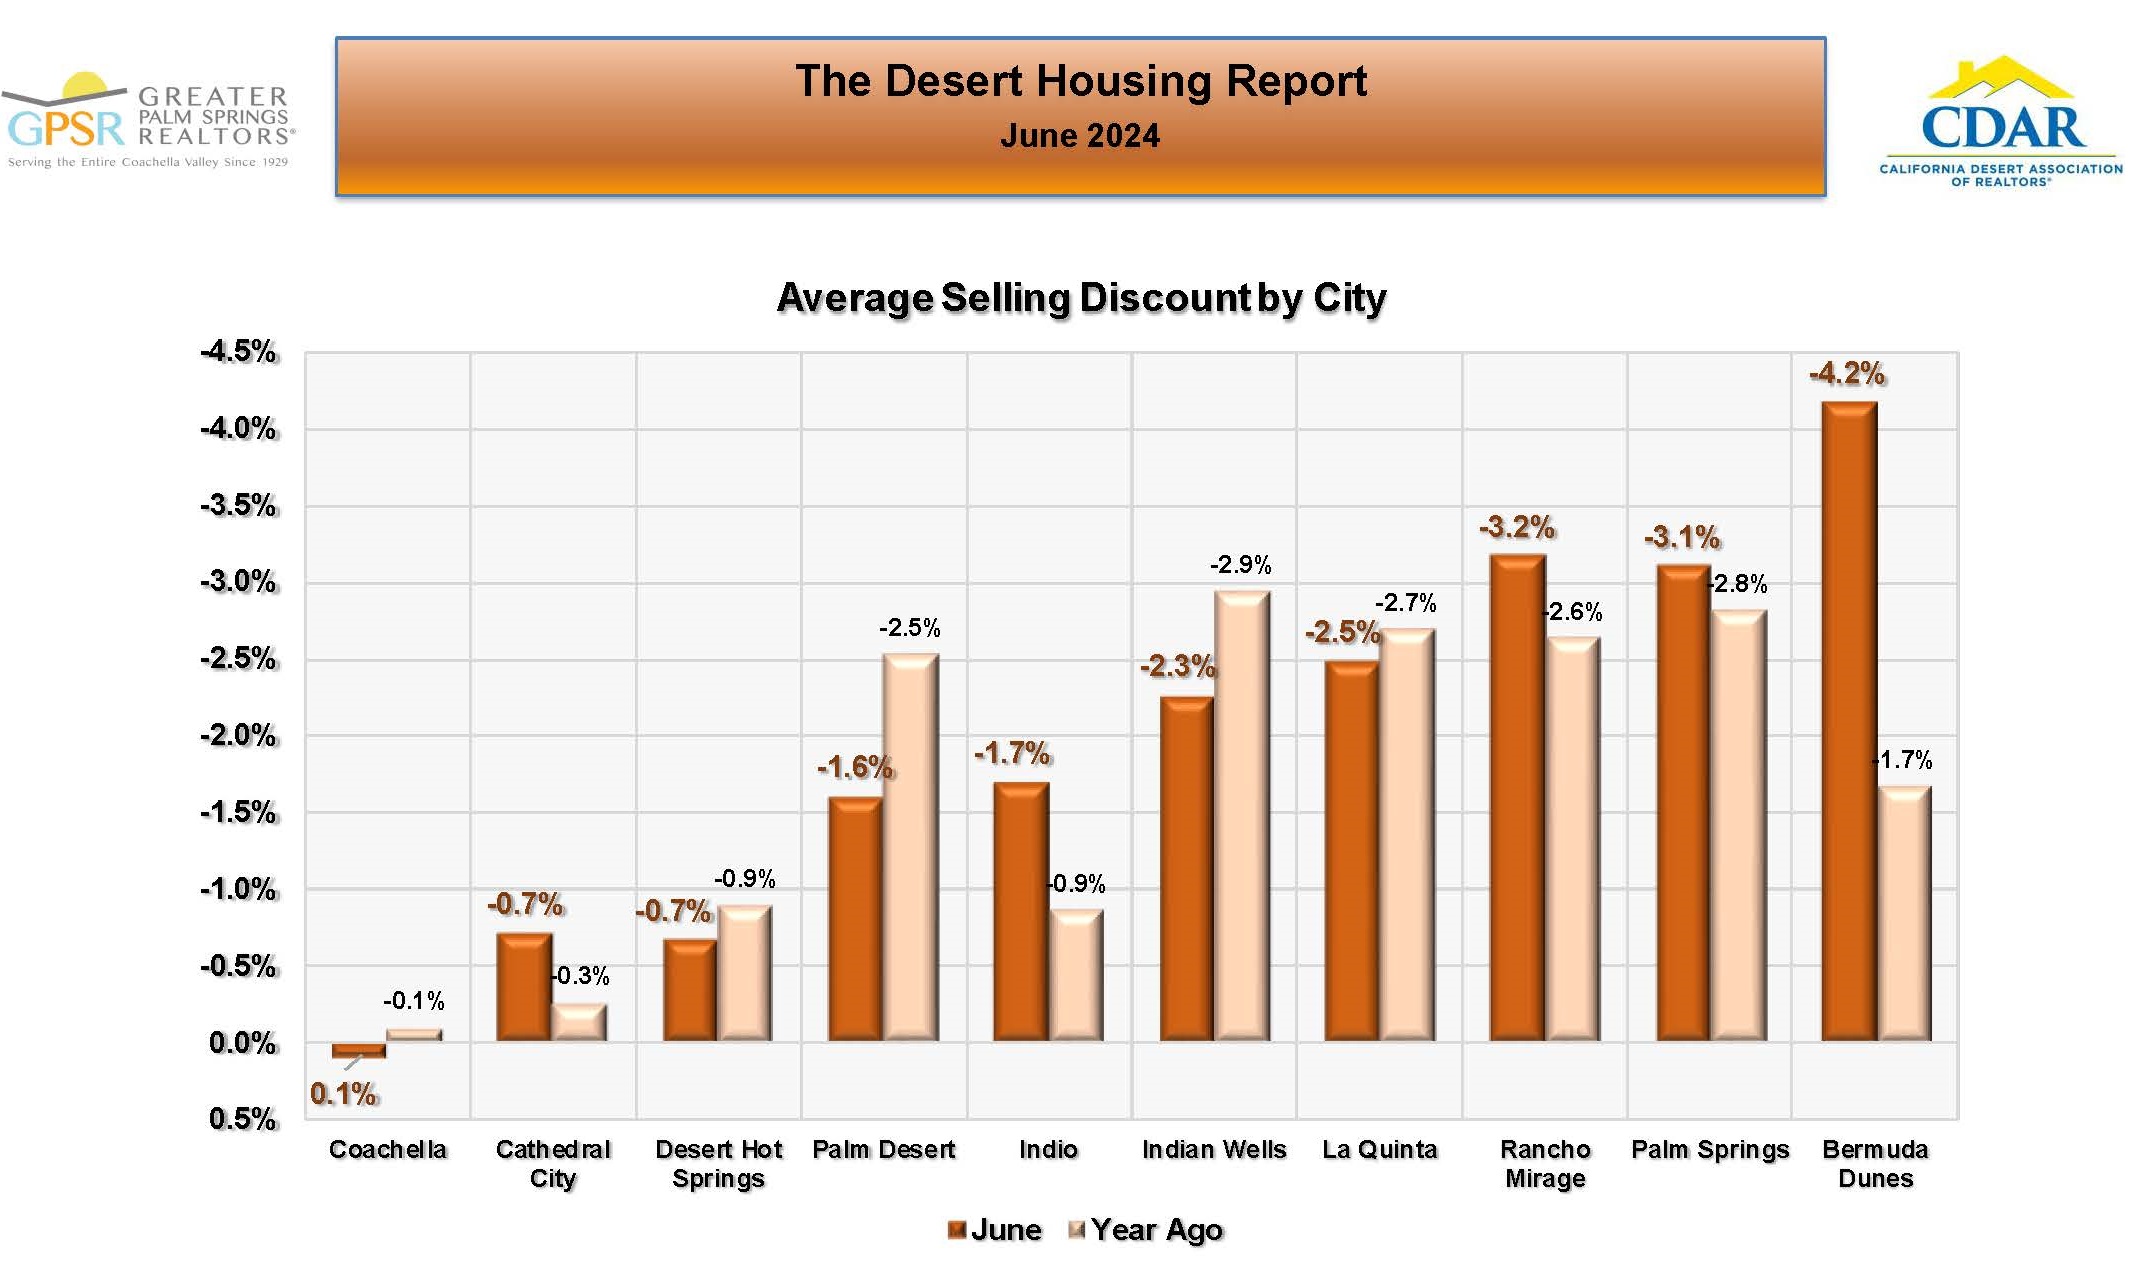 COACHELLA VALLEY JUNE PRICE DISCOUNT BY CITY: In June, Coachella was the only Coachella Valley city where homes were selling at an average premium (0.1% compared to a discount of 0.1% in June 2023). Bermuda Dunes had the largest average selling price discount at 4.2% (compared to an average discount of 1.7% in June 2023).
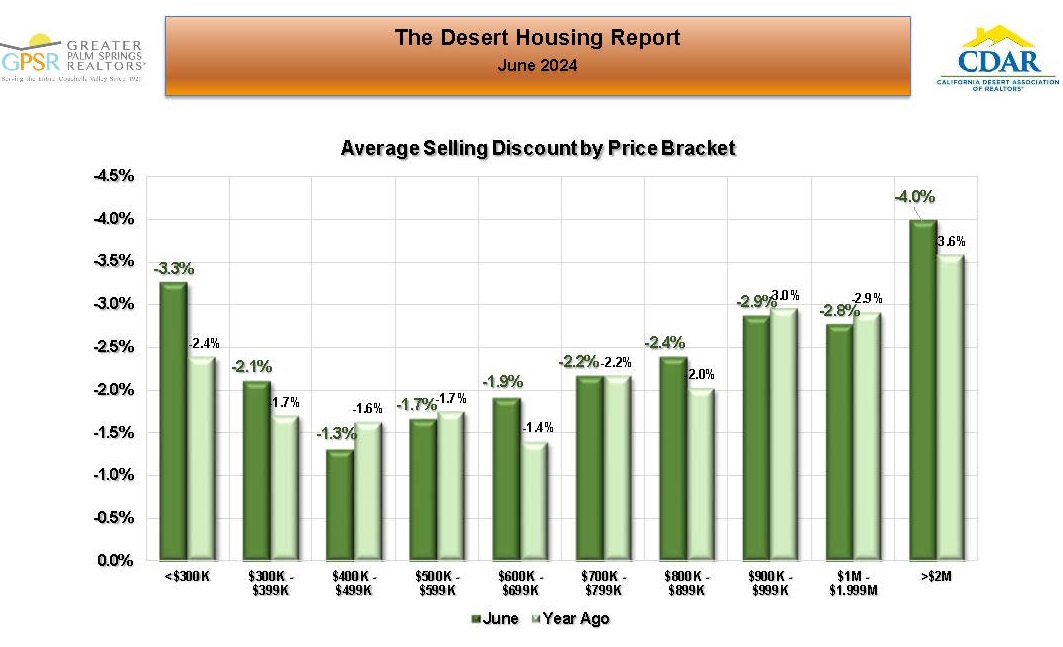 COACHELLA VALLEY JUNE PRICE DISCOUNT BY PRICE RANGE: In June, the average price discount by price range ranged from a low of 1.3% for homes priced between $400K-$499K to a high of 4% for homes priced at or above $2M. Market Watch noted that as a rule, the average price discount increases with higher priced homes.
 COACHELLA VALLEY JUNE PERCENTAGE OF HOME SELLING ABOVE LIST PRICE: In June, the percentage of homes sold in the Coachella Valley above list price was 14.8% (compared to 17.9% in June 2023). Market Watch stated that they continued to expect the number of homes in the Coachella Valley selling above list price to remain at approximately one out of seven (or 14.3%).
 THE BRIGGS GROUP | COLDWELL BANKER | Laurie Briggs - DRE# 01896117 | Tim Briggs - DRE# 01898254 | Coldwell Banker Realty - DRE# 00616212