
Our local real estate market experts, Market Watch LLC, have just released their Desert Housing Report for September 2024. Some highlights:
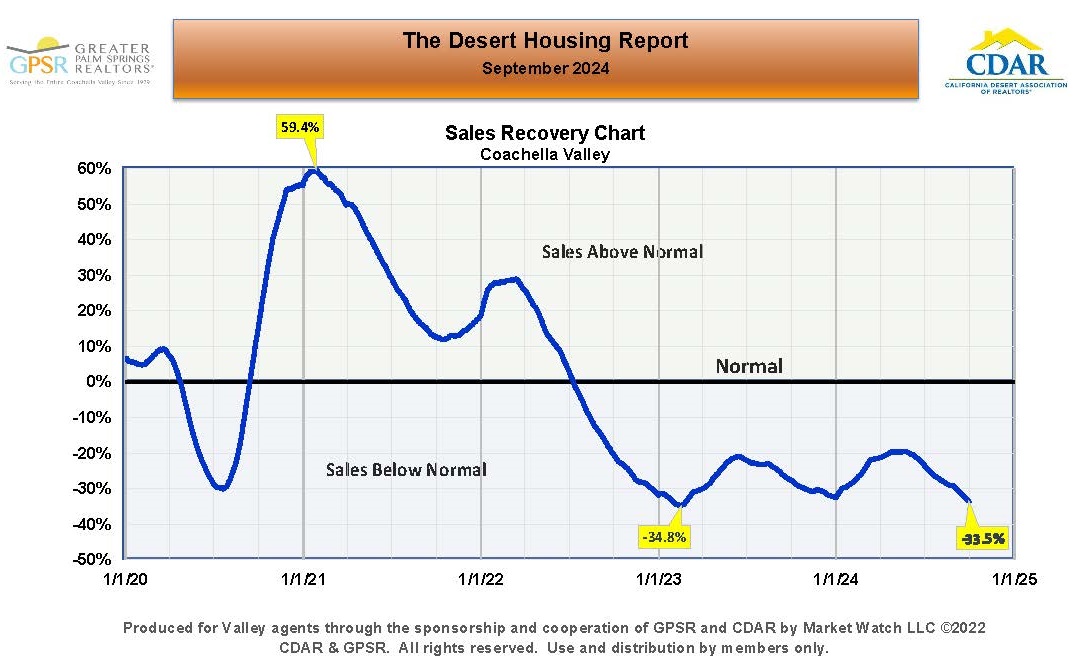 SEPTEMBER COACHELLA VALLEY SALES RECOVERY FROM PRE-PANDEMIC NORM: In September, home sales in the Coachella Valley averaged 33.5% below pre-pandemic September norm (where the norm was calculated from Coachella September home sales over the years 2016, 2017, 2018 and 2019). Market Watch noted that the Coachella Valley’s sales recovery was approaching its lowest level, indicating that home sales hadn’t increased in September, even with lower mortgage rates.
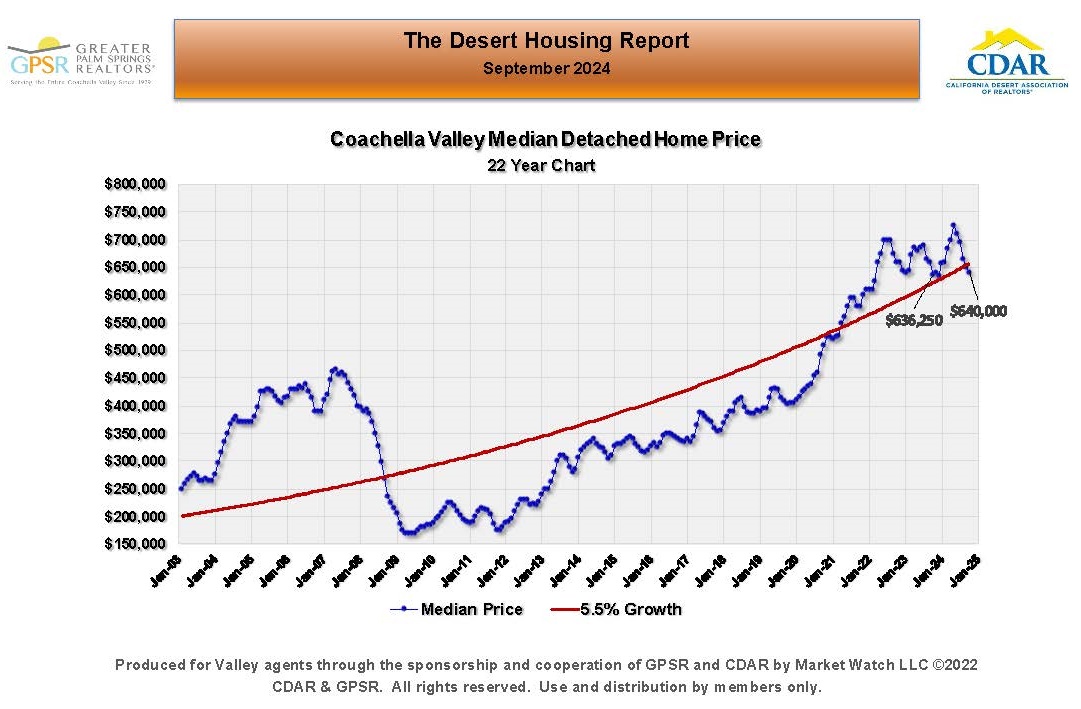 SEPTEMBER COACHELLA VALLEY DETACHED HOME MEDIAN PRICE: In September, the median price of a detached home in the Coachella Valley declined again for the fifth consecutive month to $640,000 (up $3,750 or 0.59% from $636,250 in September 2023). Market Watch noted that the detached home median price in the Coachella Valley typically reaches its seasonal low between September and December. With both low inventory and very low home sales, Market Watch felt that home supply and demand in the Coachella Valley would remain relatively balanced.
 SEPTEMBER COACHELA VALLEY ATTACHED HOME MEDIAN PRICE: In September, the median price of an attached home in the Coachella Valley was $436,500 (up $1,500 or 0.34% from $435,000 in September 2023). Market Watch noted that attached home median prices seemed to be following their normal seasonal pattern, which should result in the attached home median price reaching its seasonal low between now and the end of the year.
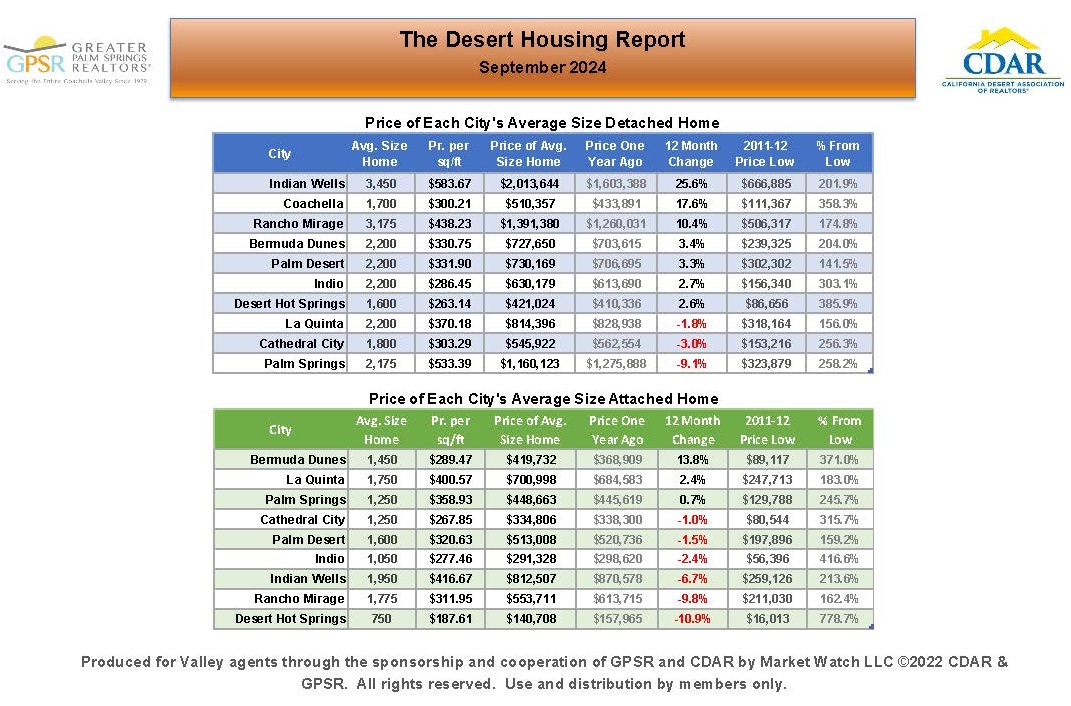 SEPTEMBER COACHELLA VALLEY TWELVE MONTH CHANGE IN THE PRICE OF THE AVERAGE SIZE HOME BY CITY: In September, year-over-year changes in the average prices for detached homes in the Coachella Valley ranged from an increase of +25.6% for the average size 3,450 sq ft detached home in Indian Wells to a decrease of -9.1% for the average size 2,173 sq ft detached home in Palm Springs. In September, year-over-year changes in the average prices for attached homes in the Coachella Valley ranged from an increase of +13.8% for the average size 1,450 sq ft attached home in Bermuda Dunes to a decrease of -10.9% for the average size 750 sq ft attached home in Desert Hot Springs.
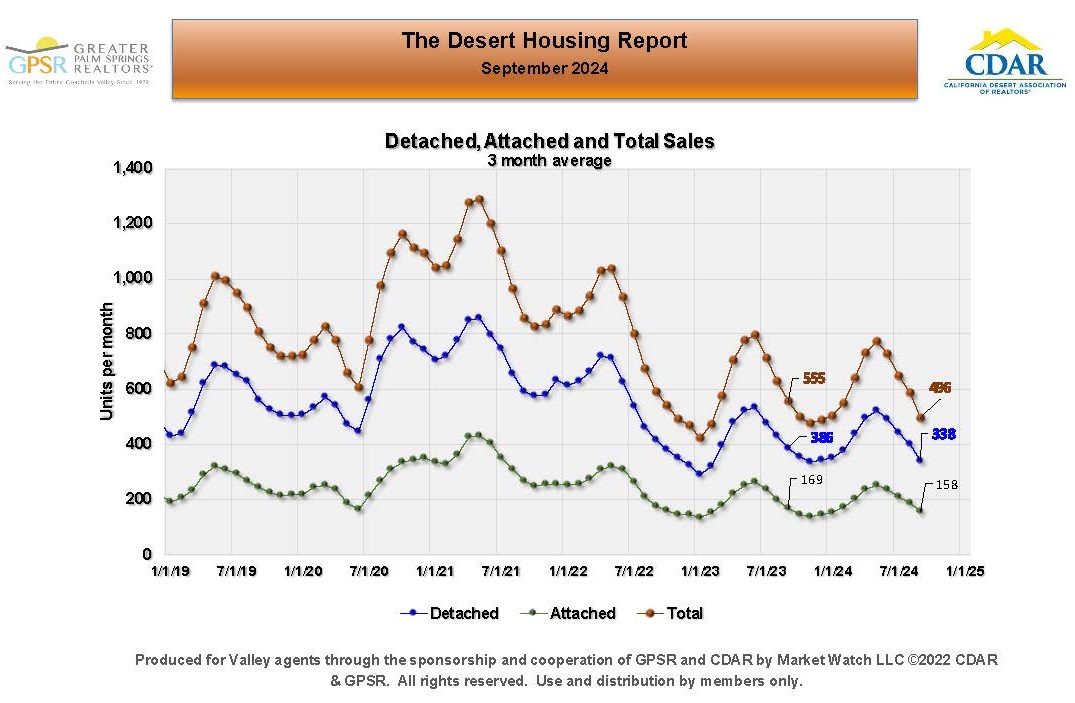 SEPTEMBER COACHELLA VALLEY MONTHLY HOME SALES – THREE MONTH AVERAGE: In September in the Coachella Valley, home sales averaged 496 home sales per month (down 59 homes or 10.6% from 555 home sales in September 2023). Market Watch noted that because of the seasonality in Coachella Valley home sales, it was difficult to determine where sales stood on a historical basis. The added that the Sales Recovery data showed that Coachella Valley home sales were below pre-pandemic norms by 33.5%.
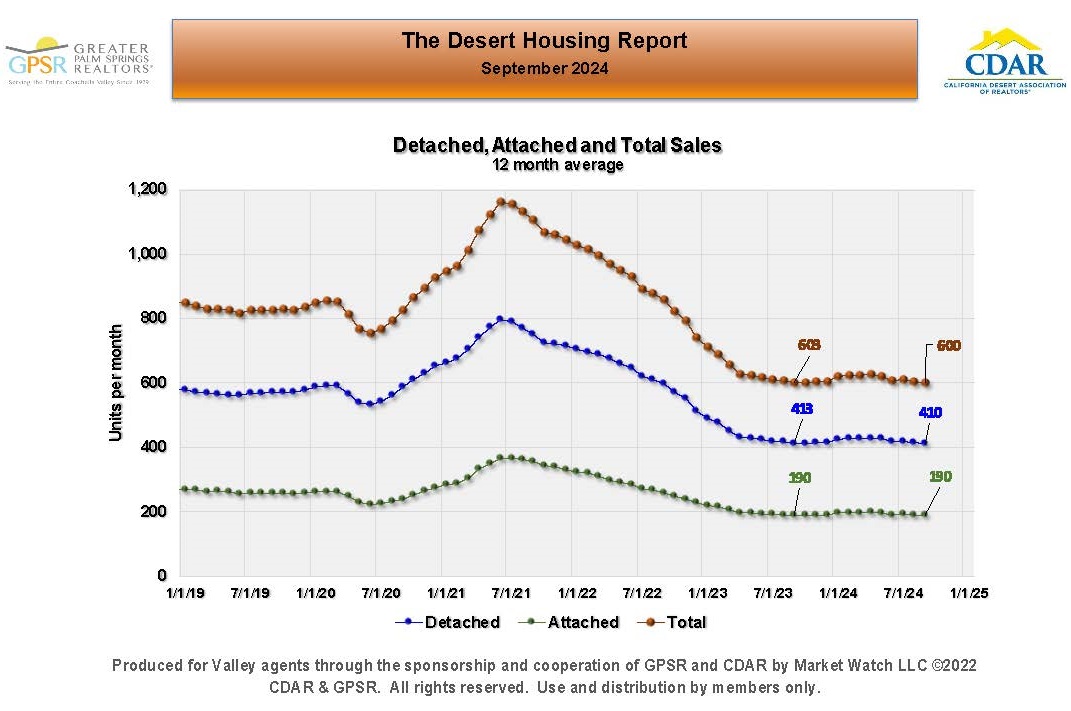 SEPTEMBER COACHELLA VALLEY MONTHLY HOME SALES – TWELVE MONTH AVERAGE: In September in the Coachella Valley, the 12-month average of monthly home sales (which removes seasonality from the data) was 600 home sales per month. Market Watch noted that this long-term home sales average was about the same as last year and has been hovering at roughly 600 home sales per month now for over a year. Further, they noted that while the Federal Reserve Board has finally begun to lower short term interest rates, this hasn’t done much to lower longer term fixed mortgage rates.
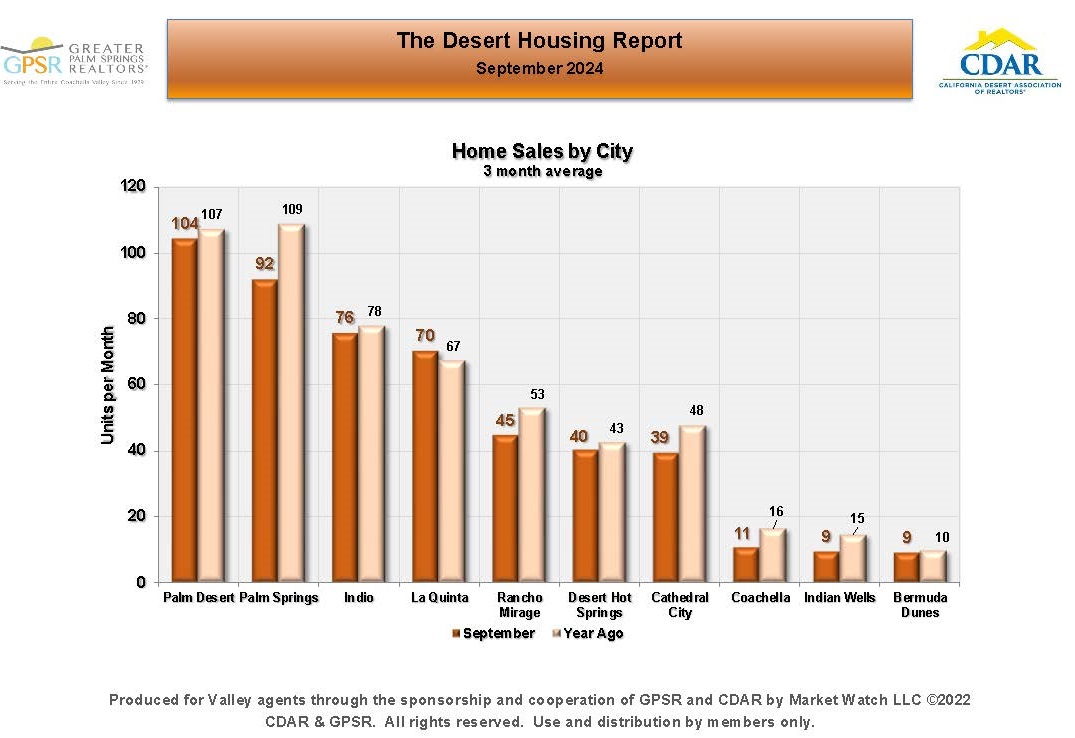 SEPTEMBER COACHELLA VALLEY MONTHLY HOME SALES BY CITY: Market Watch noted that monthly home sales were lower in most Coachella Valley cities than they were in September 2023. Palm Desert had the highest monthly home sales at 104 (compared with 107 home sales in September 2023), followed by Palm Springs with 92 monthly home sales (compared with 109 monthly home sales in September 2023). Only one city, La Quinta, with average monthly home sales of 70 in September, was higher than last year (compared with 67 monthly home sales in September 2023).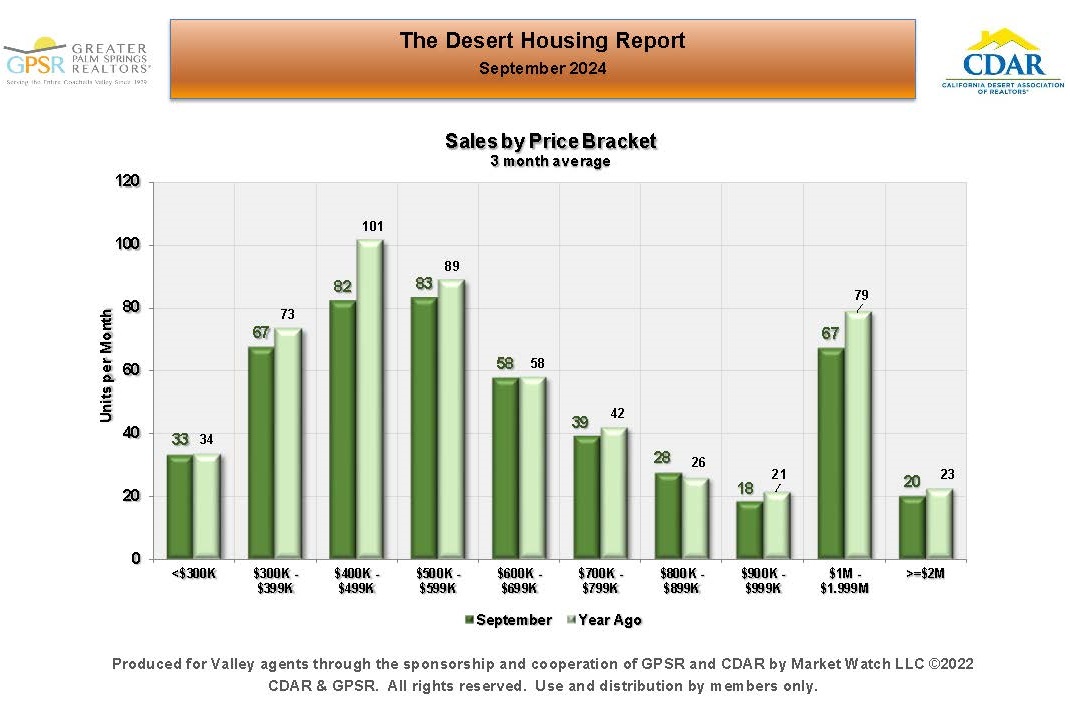
SEPTEMBER COACHELLA VALLEY HOME SALES BY PRICE RANGE: Monthly home sales were the same or decreased in almost all price ranges across the Coachella Valley in September. The largest overall sales decline appeared to be sales of homes in two price brackets: (i) homes priced between $400K and $499K, with sales of 82 homes (down 19 homes or 18.8% from 101 homes in September 2023), and (ii) homes priced between $1M and $1.999M with sales of 67 homes (down 12 homes or 15.2% from 79 homes in September 2023).
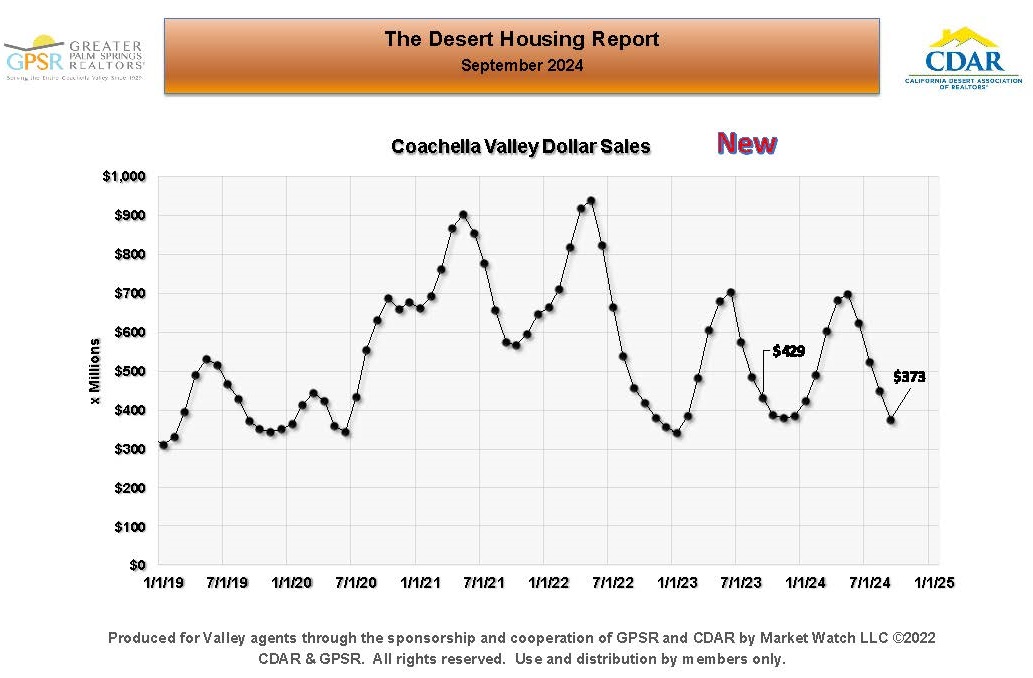 SEPTEMBER COACHELLA VALLEY MONTHLY HOME SALES IN DOLLARS: In September, total home sales in the Coachella Valley were $373M (down $56M or 13.1% from sales of $429M in September 2023).
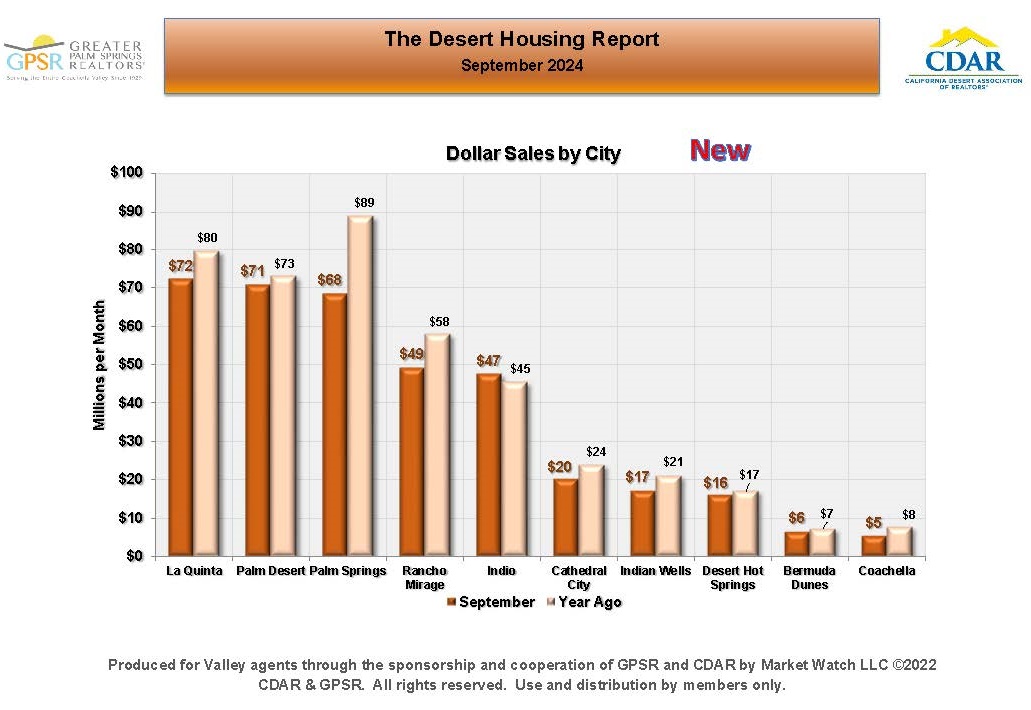 SEPTEMBER COACHELLA VALLEY HOME SALES IN DOLLARS BY CITY: In September, monthly home sales in dollars appeared to be comparable to September 2023 home sales in every city except La Quinta and Palm Springs. In La Quinta, September home sales were $72 M (down $8M or 10% from sales of $80M in September 2023). In Palm Springs, September home sales were $68M (down $21M or 23.6% from sales of $89M in September 2023).
 SEPTEMBER COACHELLA VALLEY HOME SALES IN DOLLARS BY PRICE RANGE: In September, for homes priced between $1M and $1.999M September home sales were $90M (down $18M or 16.7% from sales of $108M in September 2023). For homes priced at or above $2M, September home sales were $61M (down $13M or 17.6% from sales of $74M in September 2023).
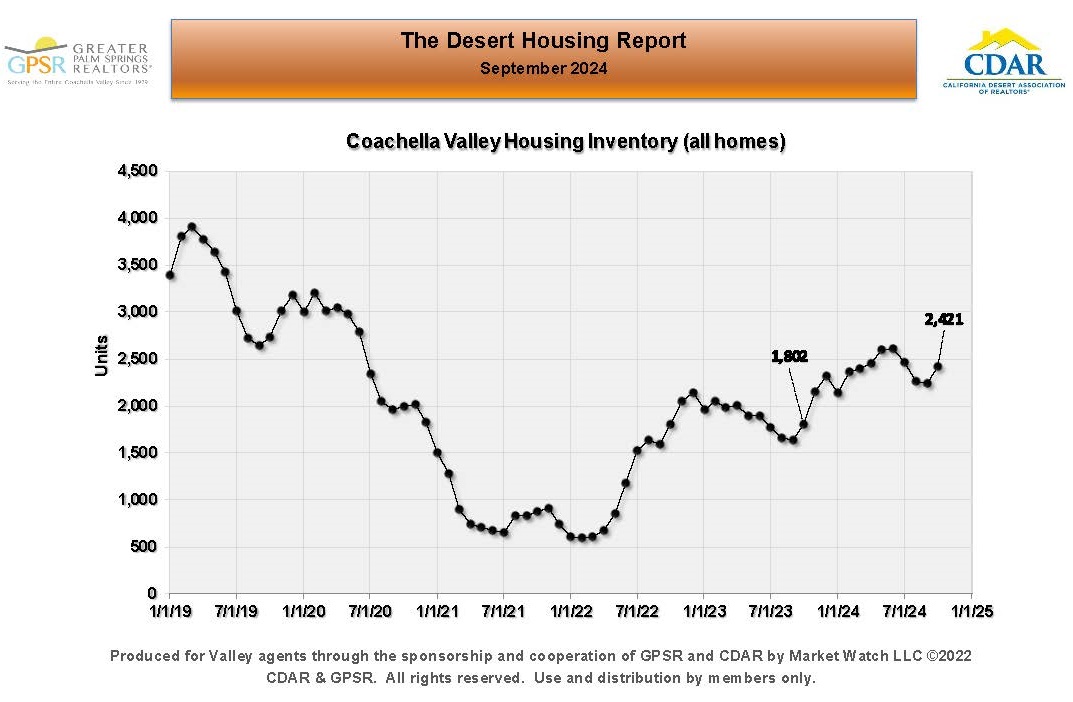 OCTOBER 1ST COACHELLA VALLEY HOME INVENTORY: On October 1st, the Coachella Valley home inventory was 2,421 homes (up 619 homes or 34.4% from 1,802 homes on October 1st, 2023). Market Watch stated that the usual seasonal pattern suggested that home inventory would begin an increase that would continue through February. While inventory had gradually improved, Market Watch felt that the current home inventory level continued to be about 1,000 units under what was normal at this time of year before the pandemic.
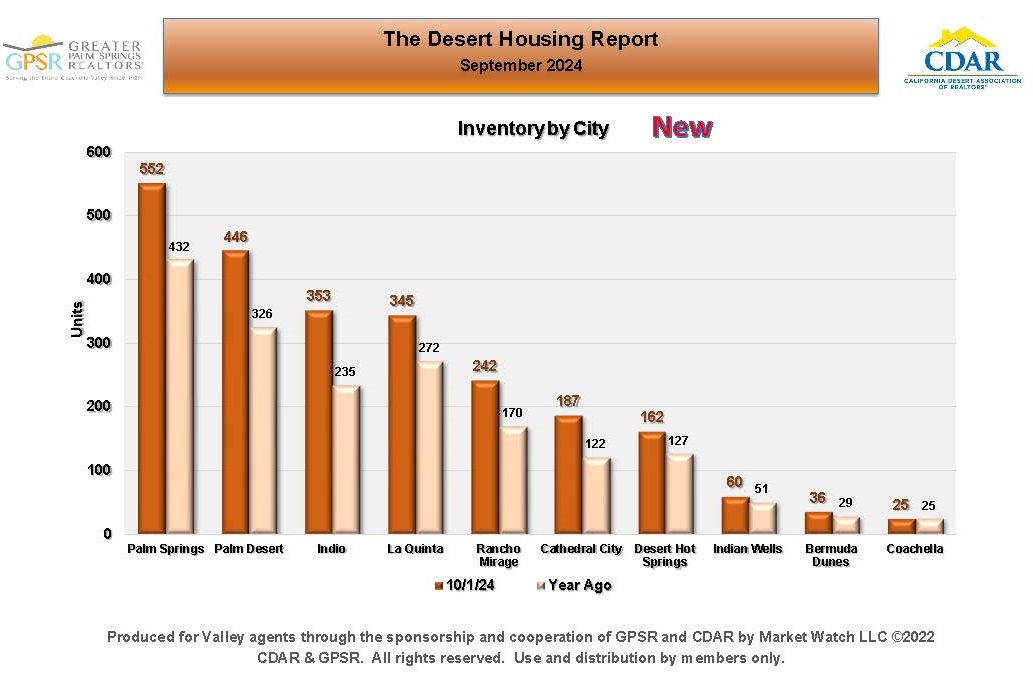 OCTOBER 1ST COACHELLA VALLEY HOME INVENTORY BY CITY: The highest home inventory level was in Palm Springs with 552 homes on October 1st (up 120 homes or 27.8% from 432 homes on October 1st, 2023). The lowest home inventory level was in Coachella with 25 homes (the same as on October 1st, 2023). Market Watch noted that this data could help agents know what cities have homeowners with the greatest selling interest and how it compares to last year.
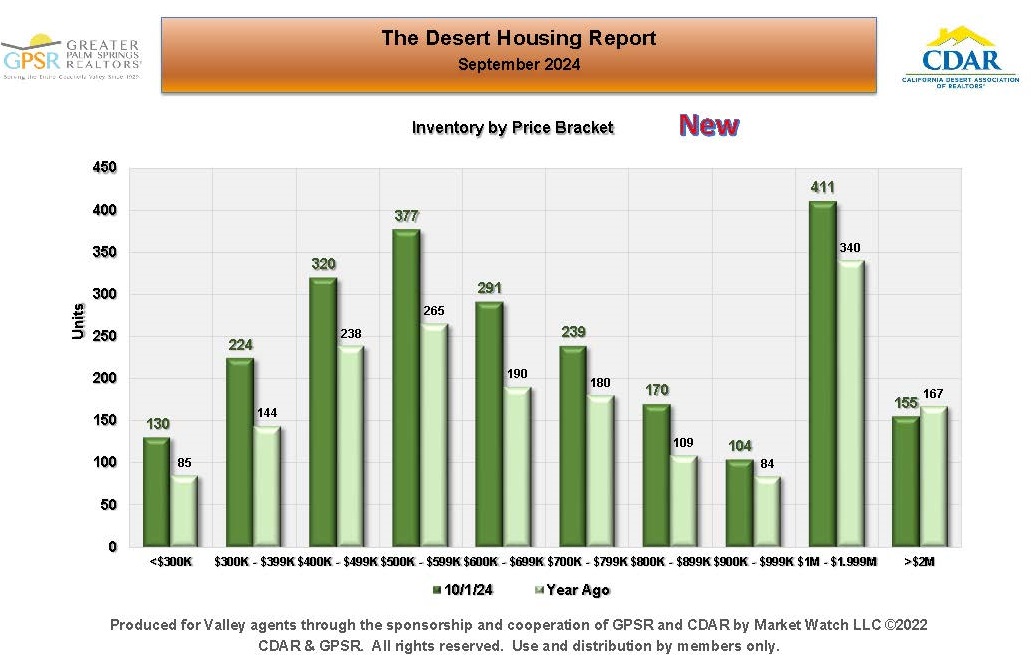 OCTOBER 1ST COACHELLA VALLEY HOME INVENTORY BY PRICE RANGE:The highest home inventory level on October 1st was 411 homes for homes priced between $1M and $1.999M (up 71 homes or 20.9% from 340 homes on October 1st, 2023). The second highest home inventory level was 377 homes for homes priced between $500K and $599K (up 112 homes or 42.3% from 265 homes on October 1st, 2023). Market Watch commented that this data helps locate what price ranges might be responsible for the growth or contraction of home inventory.
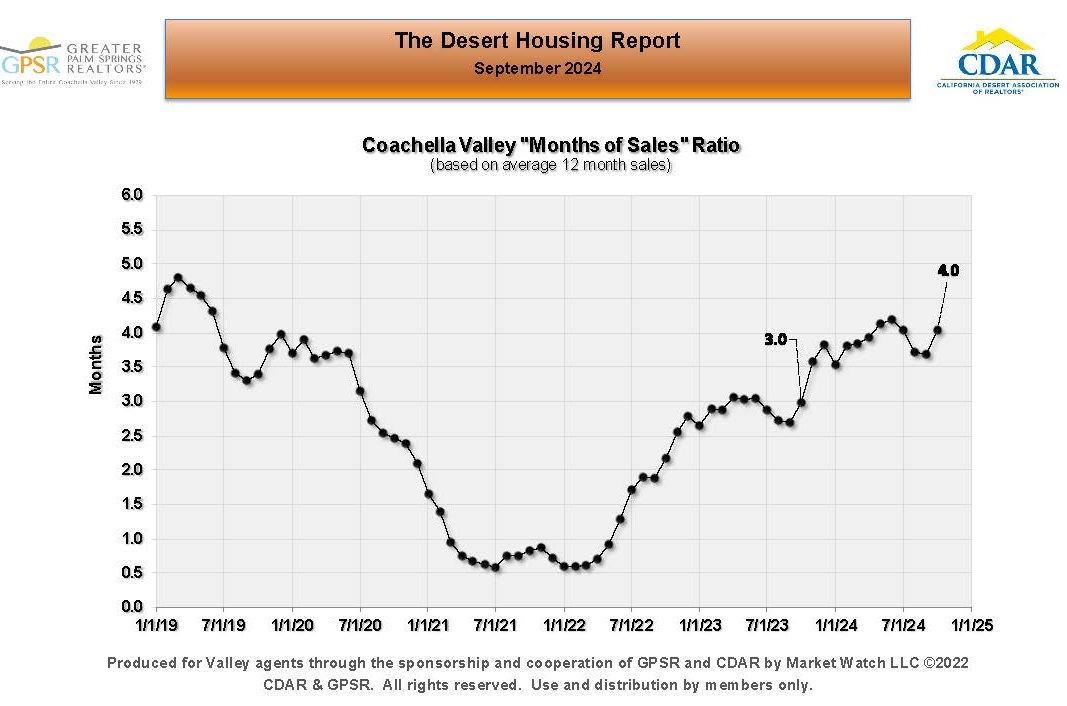 OCTOBER 1ST COACHELLA VALLEY MONTHS OF SALES RATIO: On October 1st, the Coachella Valley’s months of sales ratio was 4.0 months (up from 3.0 months on October 1st, 2023). Market Watch commented that the months of sales ratio, which measures supply and demand, was now back to pre-pandemic levels. Further, they noted that even though inventory was still relatively low, the low sales numbers had kept supply and demand relatively balanced, leading to stable home prices over the last twelve months.
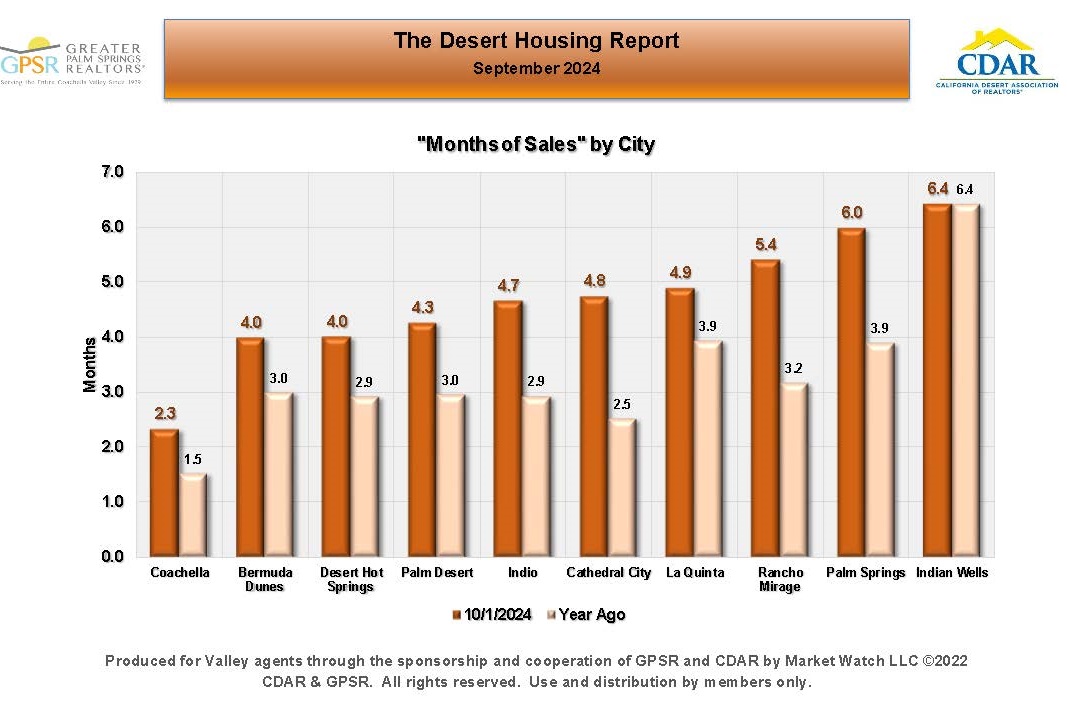 OCTOBER 1st COACHELLA VALLEY MONTHS OF SALES RATIO BY CITY: Market Watch noted consistent months of sales ratios between 4.0 and 5.0 months in most of the Coachella Valley’s nine cities on October 1st. The months of sales ratio in Indian Wells on October 1st was the highest at 6.4 months followed by Palm Springs at 6.0 months. Market Watch explained that since months of sales is really the supply-demand equation for housing, it showed that the Coachella Valley housing market remained balanced on October 1st. They further noted that if the months of sales ratios were to increase by one or two months, the market would begin to favor buyers over sellers.
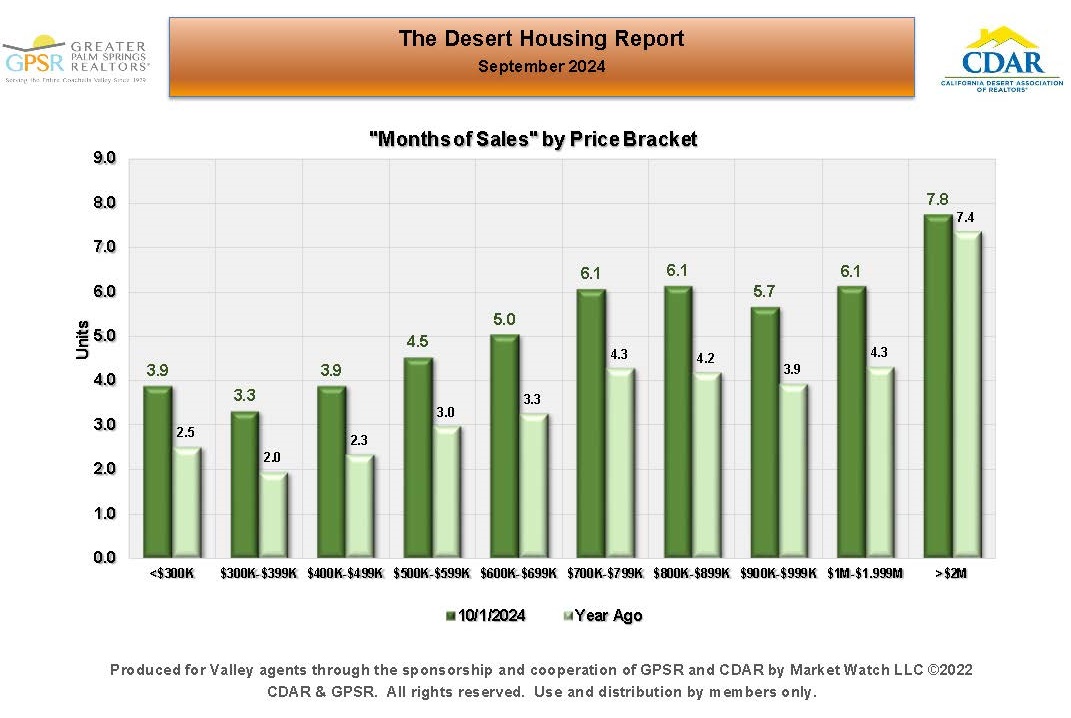 OCTOBER 1st COACHELLA VALLEY MONTHS OF SALES RATION BY PRICE RANGE: On October 1st, the highest months of sales ratio was 7.8 months (up from 7.4 months on October 1st, 2023) for homes priced at or above $2M. The lowest months of sales ratio was 3.3 months (up from 2 months on October 1st 2023) for homes priced between $300K and $399K. Market Watch noted that since months of sales is really the supply-demand equation for housing, the large year-over-year increases in the months of supply ratios showed that the supply side of the market was slowly increasing in all price brackets.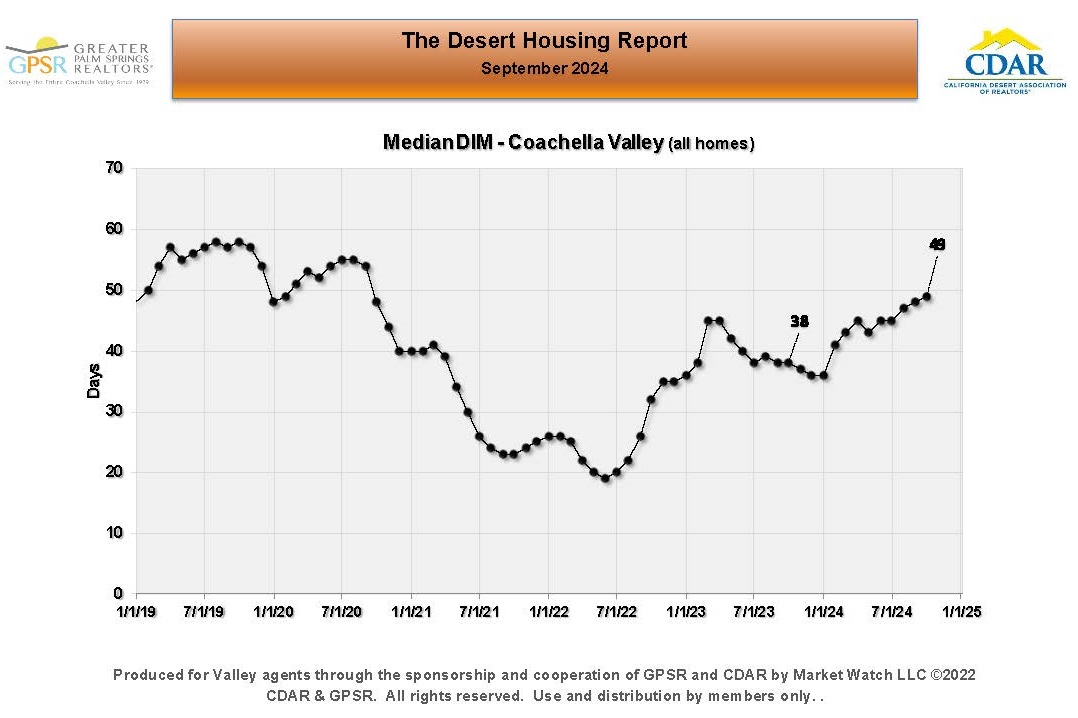
SEPTEMBER COACHELLA VALLEY DAYS IN THE MARKET: At the end of September, the median number of days in the market in the Coachella Valley was 49 days (up 11 days from 38 days at the end of September 2023). Market Watch noted that the median selling time had been gradually increasing over the last nine months and selling times were now back to pre pandemic levels.
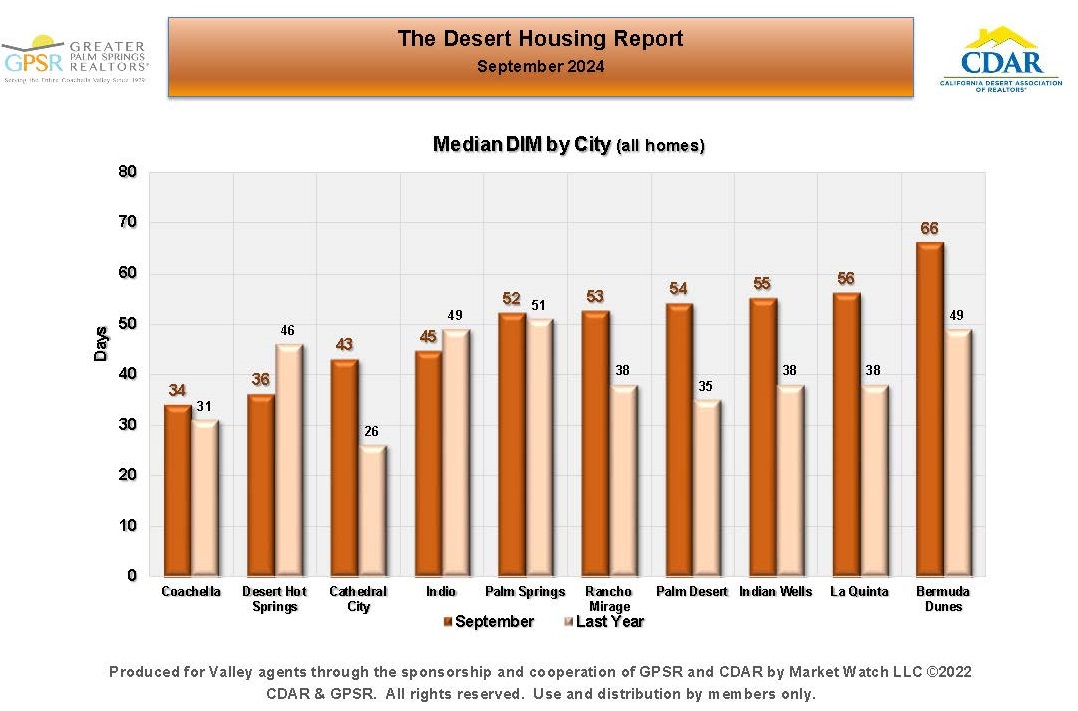 SEPTEMBER COACHELLA VALLEY DAYS IN THE MARKET BY CITY: At the end of September, Coachella continued to have the lowest average selling time in the Coachella Valley at 34 days (up from 31 days at the end of September 2023). This was followed by Desert Hot Springs at 36 days (down from 46 days at the end of September 2023) and Cathedral City at 43 days (up from 26 days at the end of September 2023). At the end of September, Bermuda Dunes had the highest average selling time at 66 days (up from 49 days at the end of September 2023).
 SEPTEMBER COACHELLA VALLEY DAYS IN THE MARKET BY PRICE RANGE: At the end of September, the longest average selling time was 71 days (up from 41 days at the end of September 2023) for homes priced between $900K and $999K. The lowest average selling time was 37 days (the same as at the end of September 2023) for homes priced between $400K and $499K. Market Watch commented that selling times usually increase with higher priced homes. However, they didn’t see that in the current market, which they felt was a positive feature for higher priced homes.
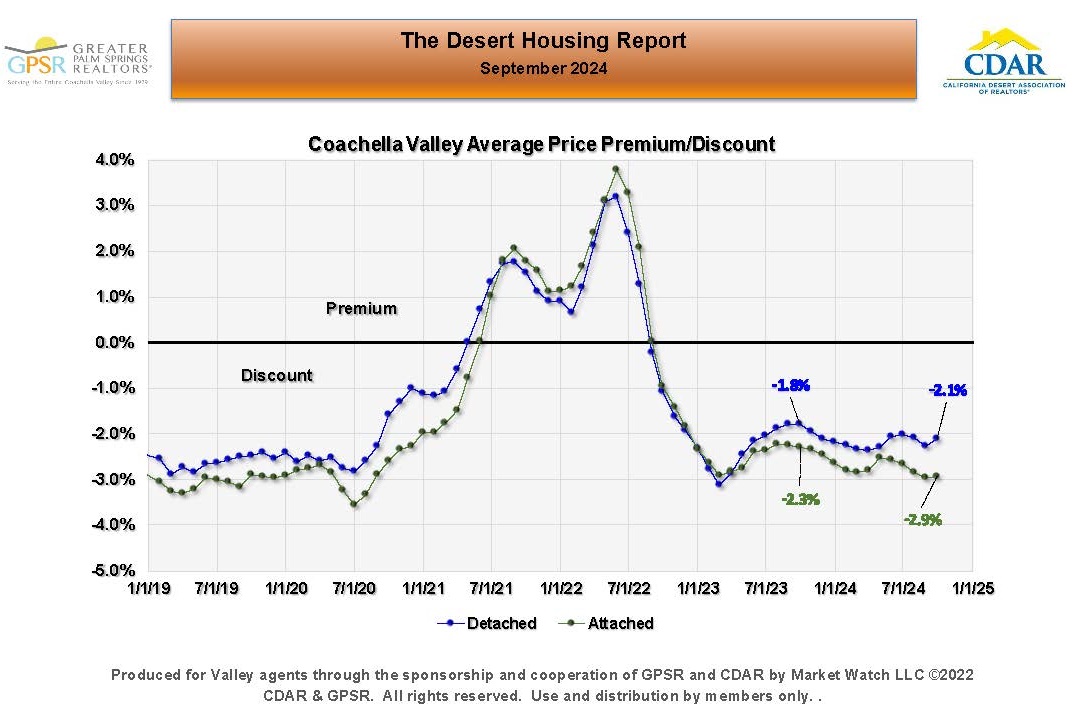 SEPTEMBER COACHELLA VALLEY AVERAGE PRICE PREMIUM/DISCOUNT: In September in the Coachella Valley, detached homes sold at an average discount of 2.1% (up from an average discount of 1.8% in September 2023). Attached homes sold at an average discount of 2.9% (up from an average discount of 2.3% in September 2023). Market Watch noted that the current average discounts were now in line with pre-covid levels.
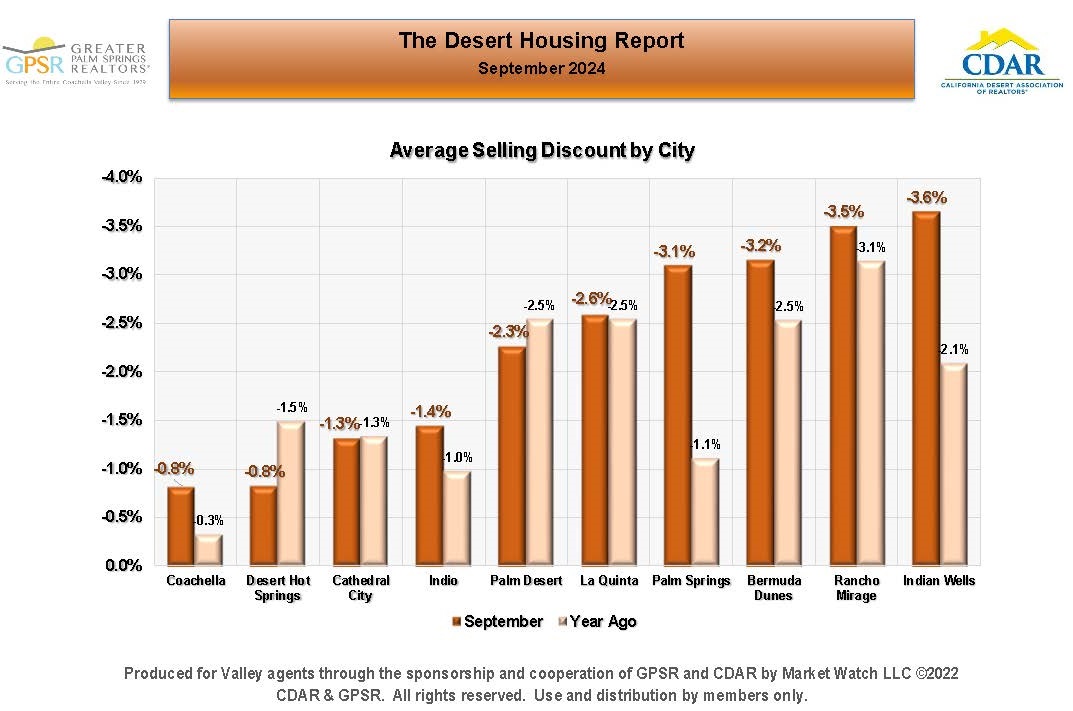 SEPTEMBER COACHELLA VALLEY AVERAGE SELLING DISCOUNT BY CITY: In September in the Coachella Valley, Coachella had the smallest average selling discount at 0.8% (increasing from 0.3% in September 2023). Indian Wells had the highest average selling discount at 3.6% (increasing from 2.1% in September 2023).
SEPTEMBER COACHELLA VALLEY AVERAGE SELLING DISCOUNT BY PRICE RANGE: In September in the Coachella Valley, the smallest average selling discount was 1.2% (decreasing from an average discount of 1.3% in September 2023), for homes priced between $500K and $599K. The highest average selling discount was 6.2% (increasing from 3.7% in September 2023), for homes priced at or above $2M. Market Watch noted that as a general rule, price discounts increase as home prices increase. However, in the Coachella Valley in September, the lowest average discounts occurred in the middle price ranges. 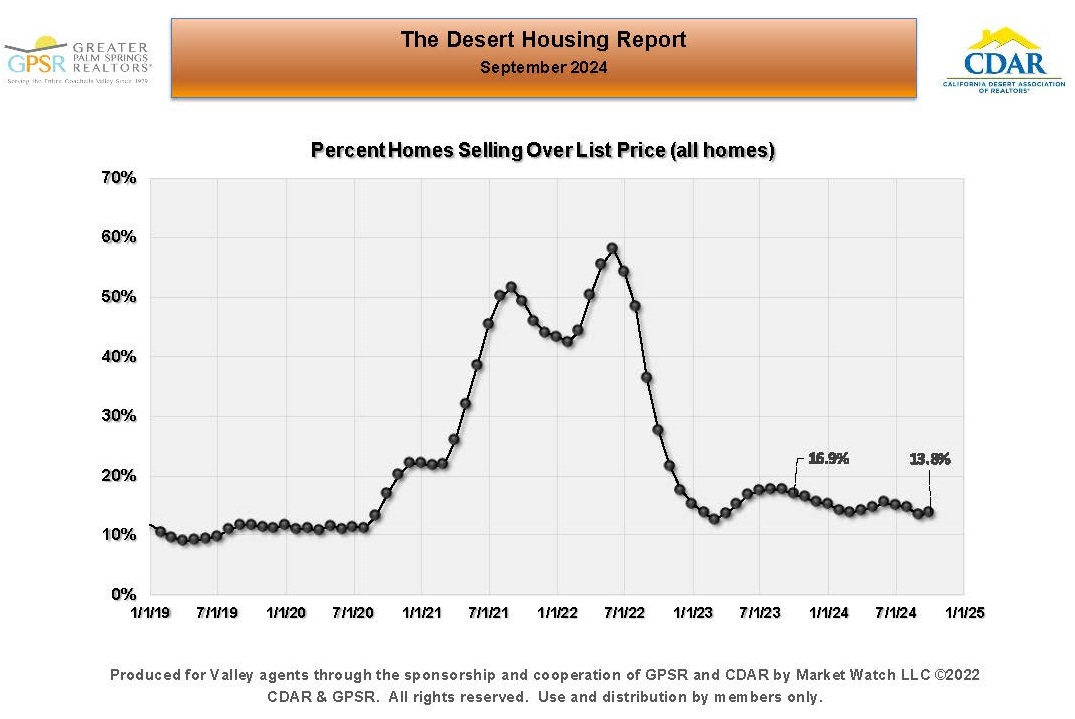
SEPTEMBER COACHELLA VALLEY PERCENTAGE OF HOMES SELLING ABOVE LIST PRICE: In September in the Coachella Valley, the percentage of homes selling over list price was 13.8% (down from 16.9% in September 2023). Market Watch expected the number of Coachella Valley homes selling above list price to remain at about one out of seven (or 14.3%).
 THE BRIGGS GROUP | COLDWELL BANKER | Laurie Briggs - DRE# 01896117 | Tim Briggs - DRE# 01898254 | Coldwell Banker Realty - DRE# 00616212


 AUGUST COACHELLA VALLEY HOME SALES RECOVERY: Coachella Valley home sales in August were 29.7% below normal (where normal is calculated from August home sales over the years 2016 through 2019). Market Watch is hopeful that the anticipated drop in interest rates in September will stimulate buyers.
 AUGUST COACHELLA VALLEY DETACHED HOME MEDIAN PRICE: After reaching an all-time high five months ago, in August the median price of a detached home in the Coachella Valley decreased again to $653,726 (down $5,274 or 0.8% from $659,000 in August 2023). Market Watch explained that this is the period of the year (between September and December) when the median home price usually hits its seasonal low. However, with both lower inventory and home sales, they felt that supply and demand would remain relatively balanced.
 AUGUST COACHELLA VALLEY ATTACHED HOME MEDIAN PRICE: In August, the median price of an attached home in the Coachella Valley was $445,000 (down $5,000 or 1.1% from $450,000 in August 2023). Market Watch noted that the seasonal price swing for attached homes was much larger than for detached homes and that the median price of attached homes seemed to be following the normal seasonal pattern. Market Watch added that if this is true, then the median price of attached homes should reach its seasonal low sometime in the next two months.
 AUGUST YEAR-OVER-YEAR CHANGE IN THE PRICE OF THE AVERAGE SIZE HOME BY CITY: In August, the year-over-year price change for detached homes in the Coachella Valley ranged from an increase of 22.2% for the average size 1,700 sq ft detached home in Coachella to a decrease of 6.1% for the average size 2,175 sq ft detached home in Palm Springs. In August, the year-over-year price change for attached homes in the Coachella Valley ranged from an increase of 10.9% for the average size 1,450 sq ft attached home in Bermuda Dunes to a decrease of 11.8% for the average size 750 sq ft attached home in Desert Hot Springs.
 AUGUST COACHELLA VALLEY MONTHLY HOME SALES (THREE-MONTH AVERAGE): In August, monthly home sales in the Coachella Valley averaged 578 home sales per month (down 8.1% or 51 homes from 629 home sales per month in August 2023). Market Watch noted that while the seasonality of our market makes it difficult to determine where home sales stand on a historical basis, the sales recovery data showed that home sales in August home sales were lower against past norms by 29.7%.
 AUGUST COACHELLA VALLEY MONTHLY HOME SALES (TWELVE-MONTH AVERAGE): In August, the 12-month average of home sales in the Coachella Valley (which Market Watch claims removes the seasonality from home sales data) was 604 home sales per month (down 5 home sales per month from 609 home sales per month in August 2023). Market Watch noted that the long-term average of monthly home sales has been hovering at just over 600 units per month now for over a year. Market Watch stated that although the inflation rate has declined, the Federal Reserve Board has been reluctant to lower rates. But this appears to be changing, with the FED stating they plan to lower rates in September.
 AUGUST COACHELLA VALLEY MONTHLY HOME SALES BY CITY: Year-over-year, home sales in August were lower in all Coachella Valley cities other than Indio and Bermuda Dunes. The highest monthly home sales in August were in Palm Desert with 129 monthly home sales (down from 138 home sales in August 2023), followed by Palm Springs with 103 monthly home sales in August (down from 131 monthly home sales in August 2023).
 AUGUST COACHELLA VALLEY HOME SALES BY PRICE RANGE: Market Watch noted that the largest overall monthly home sales decline in August appeared to be in sales of homes priced between $300K to $500K, and those priced over a million dollars. For homes priced between $300K and $399K, home sales were 72 home sales per month (down 11.1% from 81 homes sales per month in August 2023). For homes priced between $400K and $499K, home sales averaged 95 home sales per month (down 20.2% from 119 homes sales per month in August 2023). For homes priced between $1 million and $1,999 million, home sales averaged 79 home sales per month (down 14.1% from 92 homes sales per month in August 2023).
 AUGUST COACHELLA VALLEY HOME SALES IN DOLLARS: Home sales in dollars in August were $443 million (down 8.7% from home sales of $485 million in August 2023).
 AUGUST COACHELLA VALLEY HOME SALES BY CITY IN DOLLARS: Market Watch noted that Coachella Valley home sales in August in dollars were comparable to home sales in August 2023 in every city except La Quinta and Palm Springs. August home sales in dollars in La Quinta were $83 million (down 11.7% from $94 million in August 2023). August home sales in dollars in Palm Springs were $79 million (down 28.2% from $110 million in August 2023).
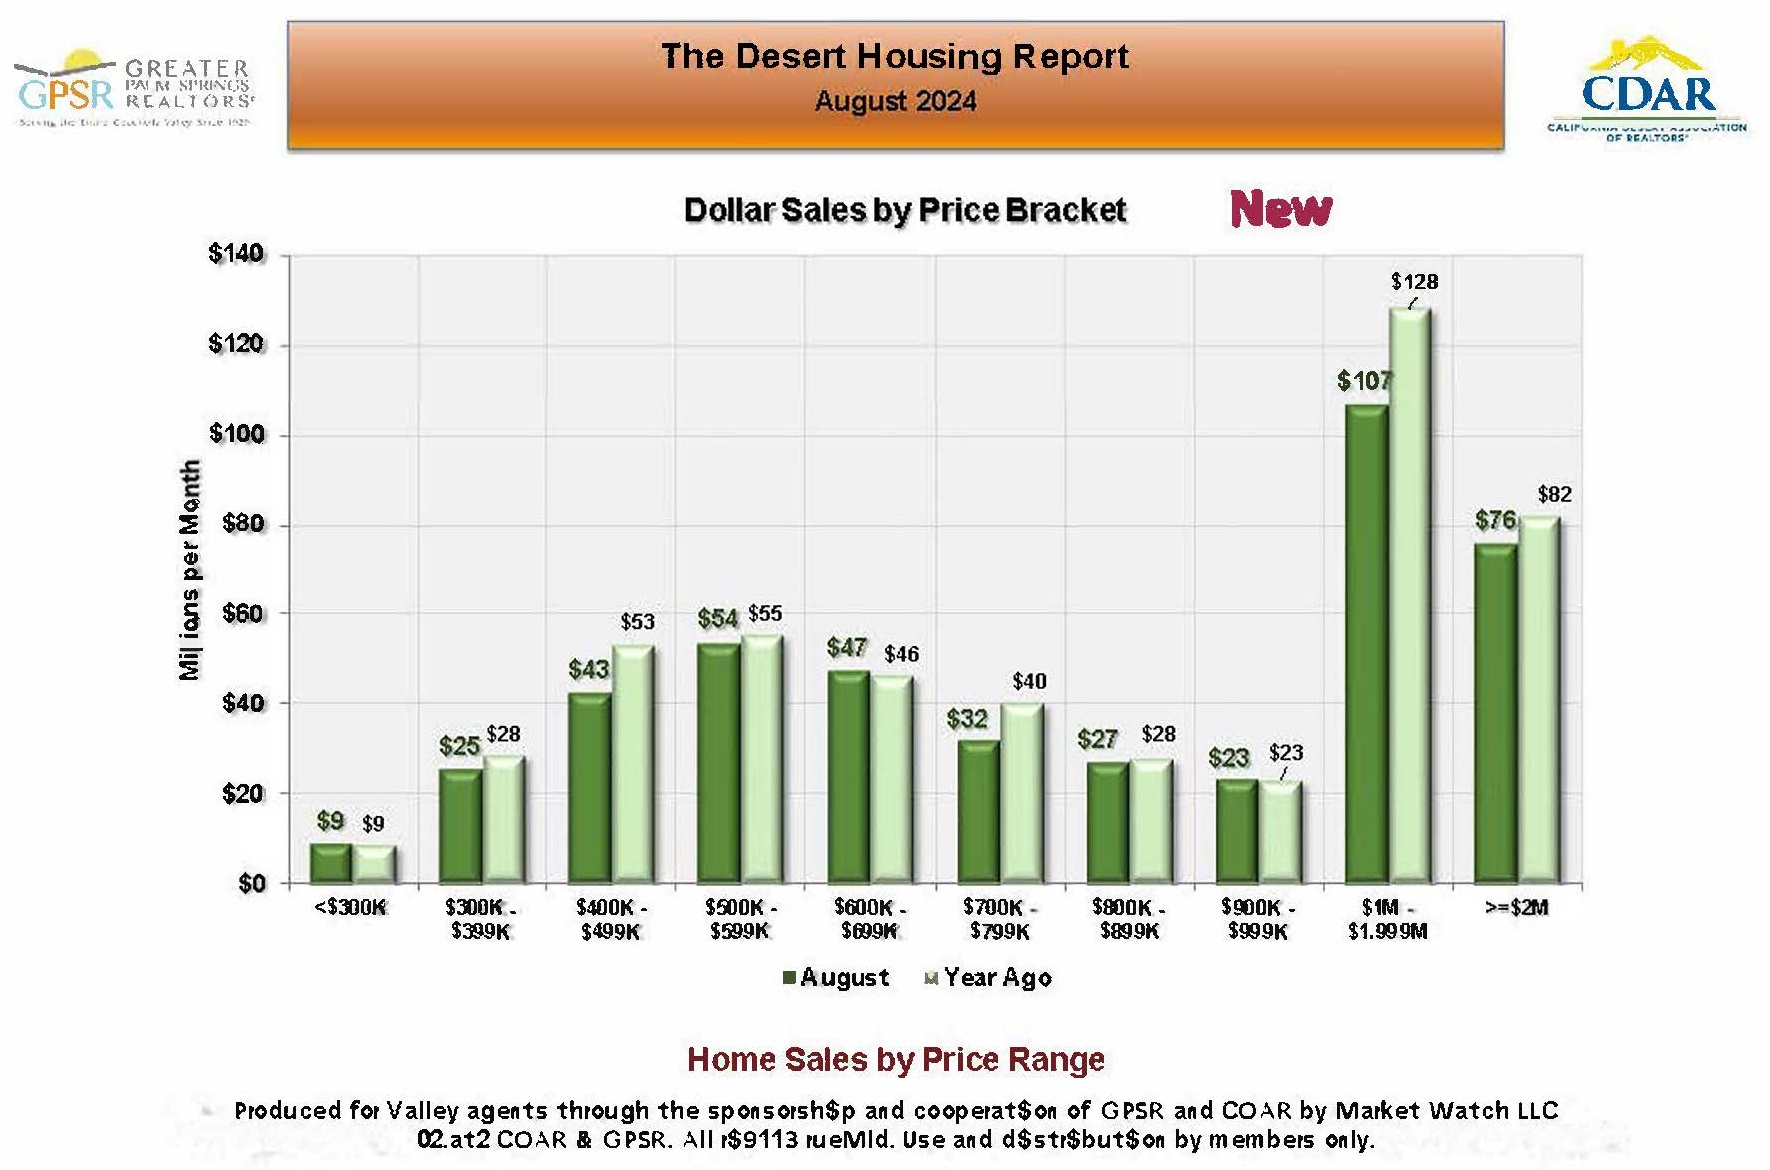 AUGUST COACHELLA VALLEY HOME SALES BY PRICE RANGE IN DOLLARS: Market Watch noted that August sales of homes priced between $1 million and $1.999 million were $107 million (down 16.4% from $128 million in August 2023). August sales of homes priced at 2 million or above were $76 million (down 7.3% from $82 million in August 2023). Market Watch also pointed out that August sales of homes priced over $1 million continued to account for roughly 50% of all home sales in dollars in the Coachella Valley.
 SEPTEMBER 1st COACHELLA VALLEY HOME SALE INVENTORY: On September 1st, the Coachella Valley home sale inventory was 2,237 homes (up 576 homes or 34.7% from 1,661 homes on September 1st, 2023). Market Watch noted that the traditional seasonal pattern suggested that inventory would begin an increase that usually carries through February. Further, they noted that while inventory has gradually improved, the current inventory level continued to be about 1,000 homes under what was normal at this time of year before the pandemic.
 SEPTEMBER 1ST COACHELLA VALLEY HOME SALE INVENTORY BY CITY: On September 1st, the highest home sale inventory level in the Coachella Valley was in Palm Springs at 548 homes (up 43.1% from 383 homes on September 1st, 2023), followed by Palm Desert at 421 homes (up 40.8% from 299 homes on September 1st, 2023). The lowest inventory level was in Coachella at 31 homes (up 6.9% from an inventory level of 29 homes on September 1st,2023). Market Watch explained that this information showed what cities have homeowners with the greatest selling interest and how it compared to last year.
 SEPTEMBER 1st COACHELLA VALLEY HOME SALE INVENTORY BY PRICE RANGE: On September 1st, the highest home sale inventory level in the Coachella Valley by price range was 388 homes, for homes priced between $1 million and $1.999 million (up 29.8% from 299 homes on September 1st 2023), followed closely with an inventory level of 335 homes for homes priced between $500K and $599K (up 34% from 250 homes on September 1st, 2023). The lowest home sale inventory level was 94 homes, for homes priced between $900K and $999K (up 30.6% from 72 homes on September 1st, 2023). Market Watch explained that this information could help locate what price ranges might be responsible for the growth or contraction of inventory.
 SEPTEMBER 1ST COACHELLA VALLEY OVERALL MONTHS OF SALES RATIO: On September 1st, the Coachella Valley’s overall months of sales ratio was 3.7 months (up from 2.7 months on September 1st, 2023). Market Watch stated that this fundamental ratio, which measures supply and demand, is now back to pre-pandemic levels. Further, they stated that even though inventory was still relatively low, the low home sales numbers kept supply and demand relatively balanced. In their opinion, this was one major reason why home prices have remained stable over the last twelve months. Lastly, they noted that this months of sales ratio could be the seasonal low for this year based on past data.
 SEPTEMBER 1ST COACHELLA VALLEY MONTHS OF SALES RATIOS BY CITY: Market Watch noted the consistent months of sales ratios in the Coachella Valley on September 1st (roughly between 3.0 and 4.0 months in the nine Coachella Valley cities). The months of sale ratio in Palm Springs was the highest at 5.0 months (up from 3 months on September 1st, 2023). The months of sale ratio in Bermuda Dunes was the lowest at 2.3 months (down from 2.7 months on September 1st, 2023). Market Watch stated that since the months of sales ratio is really the supply-demand equation for housing, it showed that the housing market remained balanced. If ratios were to move higher, however, the market would begin to favor buyers over sellers.
 SEPTEMBER 1st COACHELLA VALLEY MONTHS OF SALES RATIOS BY PRICE RANGE: Market Watch called out the increase in the months of sales ratio for homes priced between $700,000 and $900,000 as being a little above normal. For homes priced between $700K and $799K, the months of sales ratio in the Coachella Valley on September 1st was 5.1 months (up from 3 months on September 1st, 2023). For homes priced between $800K and $899K, the months of sales ratio in the Coachella Valley on September 1st was 4.4 months (up from 2.6 months on September 1st, 2023). Again, Market Watch noted that since the months of sales ratio is really the supply-demand equation for housing, the increases in months of sales ratios over last year showed that the supply side of the market was slowly increasing in all price brackets.
 AUGUST COACHELLA VALLEY OVERALL DAYS IN THE MARKET: At the end of August, the median number of days in the market in the Coachella Valley was 48 days (up from 38 days at the end of August 2023). Market Watch observed that the median selling time in the region has been stable for the last three months. Further, they stated that they continued to believe that the median selling time will remain around current levels moving toward next year.
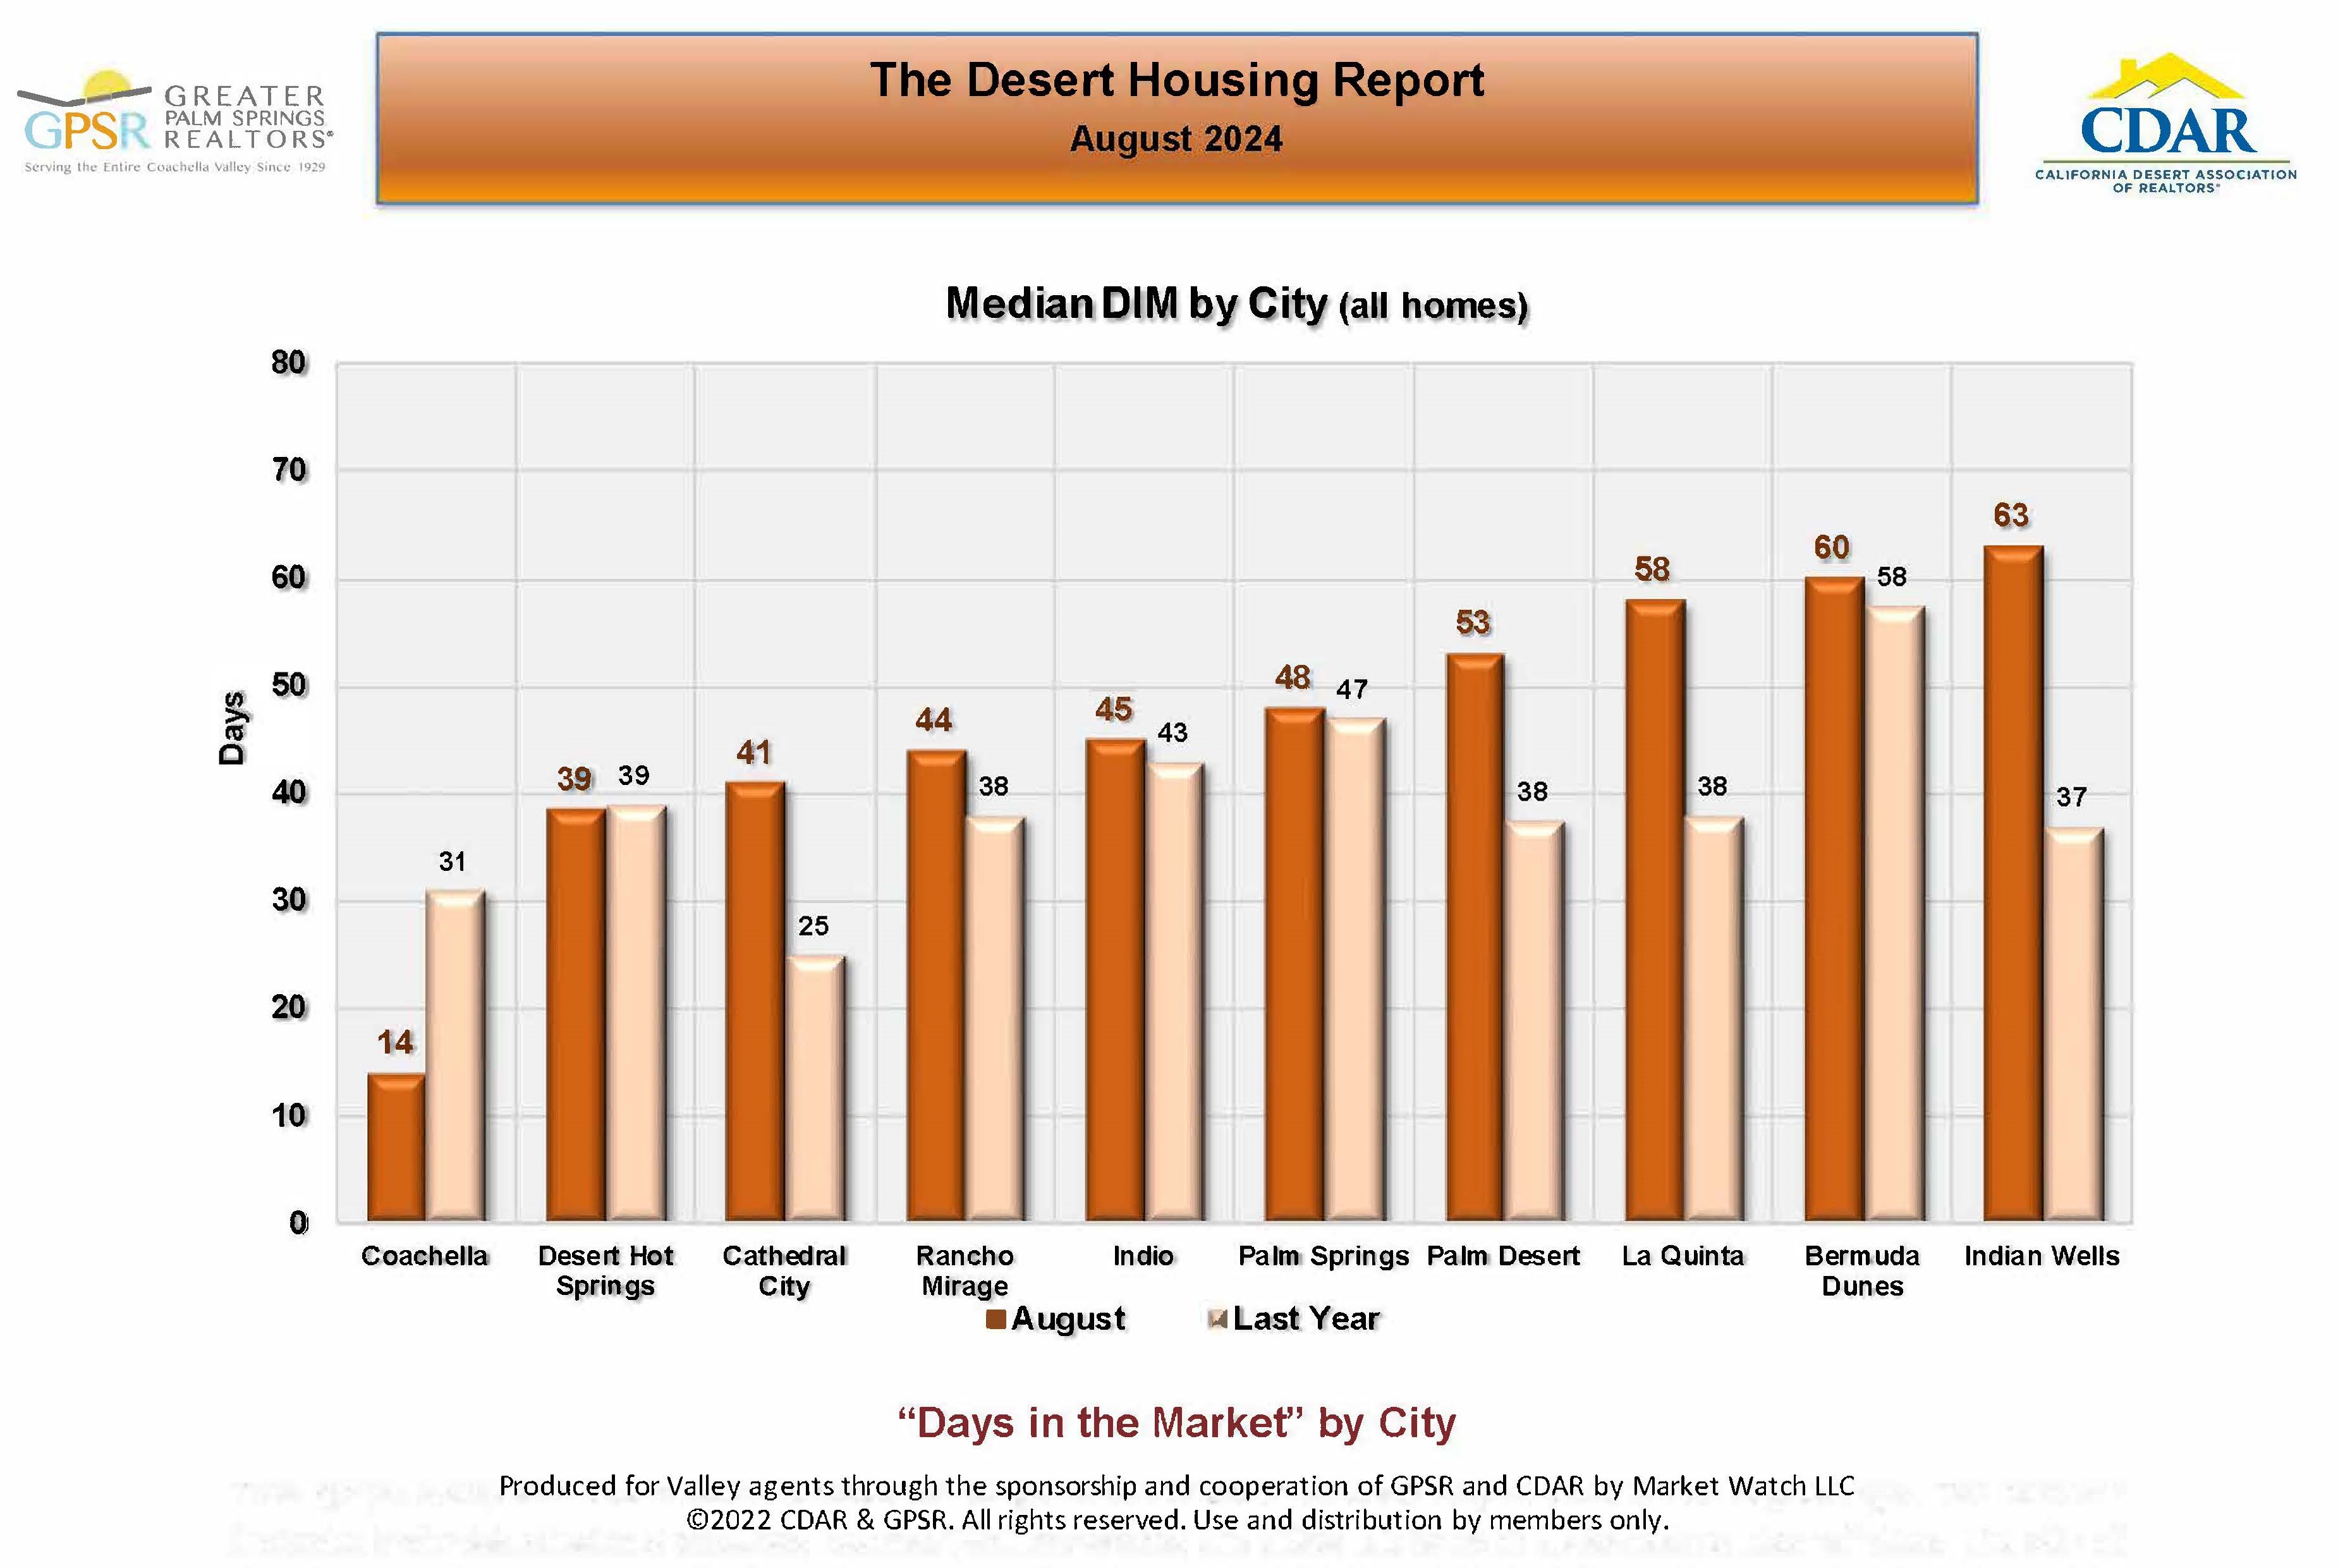 AUGUST COACHELLA VALLEY DAYS IN THE MARKET BY CITY: In the Coachella Valley in August, Coachella continued to have the lowest average selling time at just 14 days (down from 31 days in August 2023). This is followed by Desert Hot Springs at 39 days (same as in August 2023) and Cathedral City at 41 days (up from 25 days in August 2023). In August, Indian Wells had the highest average selling time at 63 days (up from 37 days in August 2023).
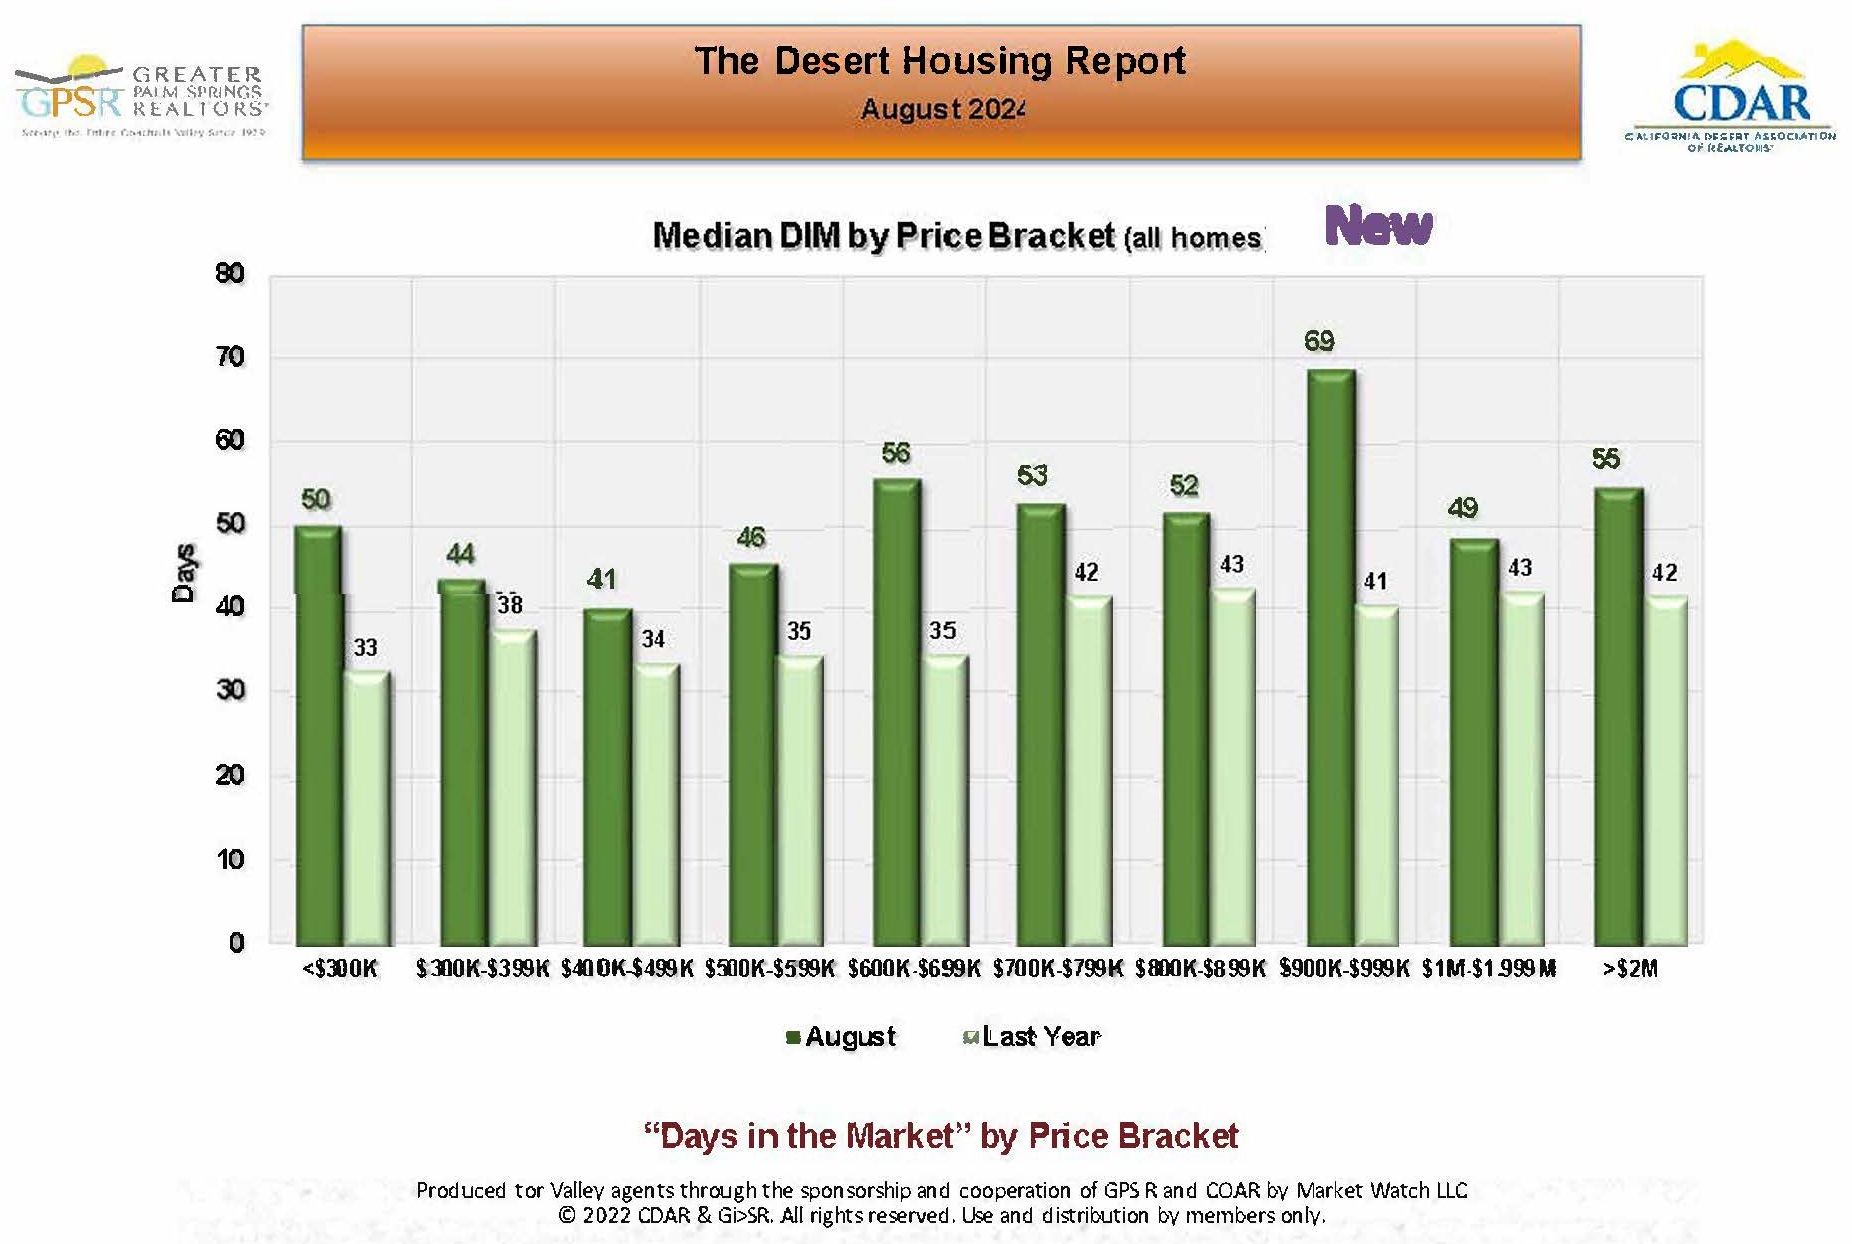 AUGUST COACHELLA VALLEY DAYS IN THE MARKET BY PRICE RANGE:. In the Coachella Valley in August, the lowest average selling time was for homes priced between $400K and $499K at 41 days (up from 34 days in August 2023). The highest average selling time at 69 days was for homes priced between $900K and $999K (up from 41 days in August 2023). Market Watch noted that it is usual for selling times to increase as the price of the home increases. However, in the current market Market Watch did not see that (which Market Watch felt was a positive feature for higher priced homes).
 AUGUST COACHELLA VALLEY OVERALL PRICE PREMIUM/DISCOUNT: In August in the Coachella Valley, detached homes were selling at an average discount of 2.3% (up from an average discount of 1.8% in August 2023). Attached homes were selling at a 3.0% average discount (up from an average discount of 2.2% in August 2023). Market Watch noted that current discounts were in line with pre-covid levels.
 AUGUST COACHELLA VALLEY AVERAGE SELLING DISCOUNT BY CITY: In August in the Coachella Valley, Coachella was the only city with homes selling at an average premium (with a sales premium of 0.4%, up from an average discount of 1% in August 2023). Bermuda Dunes continued to have the highest average selling discount for homes in August, with homes selling at an average discount of 4.1% (up from an average discount of 1.6% in August 2023).
 AUGUST COACHELLA VALLEY AVERAGE SELLING DISCOUNT BY PRICE RANGE: The highest average selling discount for homes in the Coachella Valley in August was 6% for homes priced at or above $2 million (up from an average selling discount of 3.6% in August 2023). The lowest average selling discount for homes in the Coachella Valley in August was 1.4% for homes priced between $400K and $499K (down from an average selling discount of 1.6% in August 2023).
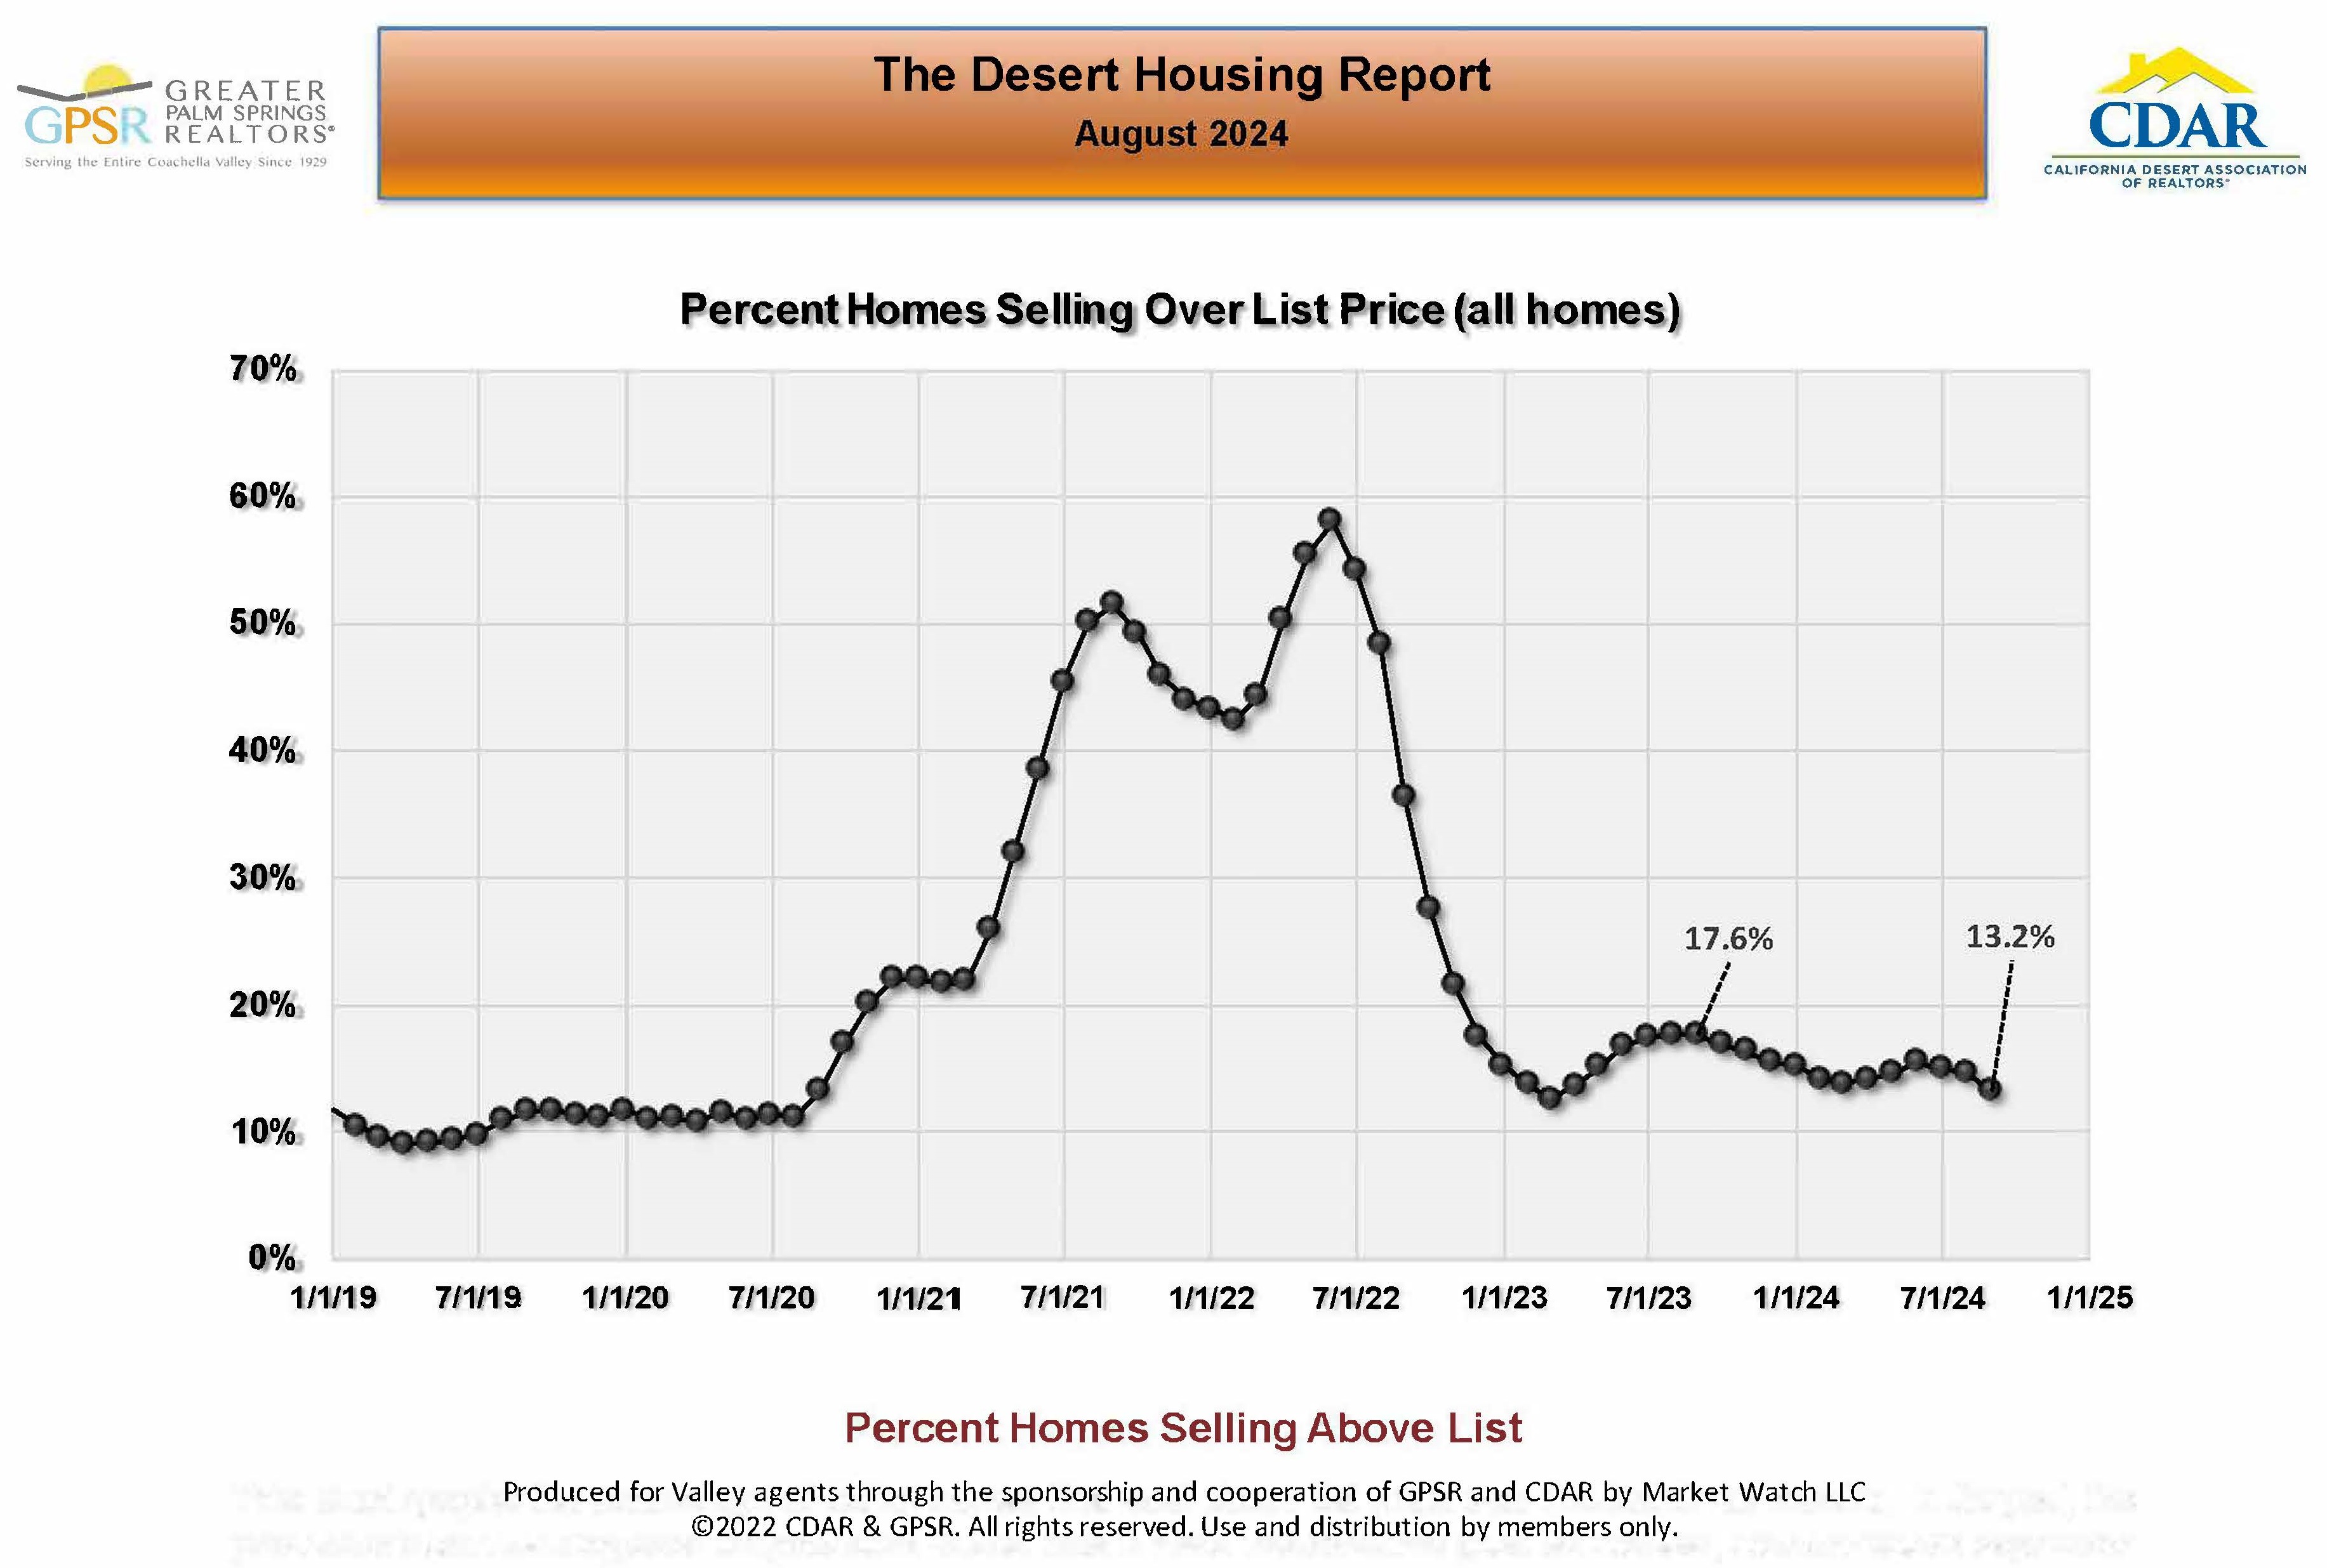 AUGUST COACHELLA VALLEY PERCENTAGE OF HOMES SELLING ABOVE LIST PRICE: In the Coachella Valley in August, the percentage of homes selling over list price was 13.2% (down from 17.6% in August 2023). Market Watch continued to expect the number of homes selling above list price to remain about one out of seven.