
 (Please click on the image above to view our short YouTube video)
Local real estate market experts, Market Watch LLC, are out with their October 2022 Desert Housing Report. Some highlights:
 COACHELLA VALLEY OCTOBER DETACHED HOME MEDIAN PRICE: The detached home median price in the Coachella Valley in October was $675,000 (up $5,000 or 0.75% from $670,000 in September and up $75,000 or 12.5% from a median price of $600,000 in October 2021). Market Watch noted that the data shows that home price correction that many have feared has been relatively mild in the Coachella Valley to date. In fact, they pointed out that some of the price correction over the last couple of months is just the historical seasonal correction at play. However, they also stated that it is hard to ignore the effect of higher interest rates on both buyers and seller.
 COACHELLA VALLEY OCTOBER ATTACHED HOME MEDIAN PRICE: The attached home median price in the Coachella Valley in October was $456,250 (down 1.9% from $465,000 in September but up 23.3% from $370,000 in October 2021). Market Watch noted that past attached home median price data shows a historical seasonal price correction of between 10% to 15% at this time of year. They do expect a larger than normal price correction for attached homes this year, with the attached home median price bottoming out around $435,000. They noted that this would be in line with the historical 4.5% price growth curve for attached homes in the Coachella Valley.
 OCTOBER TWELVE MONTH CHANGE IN PRICE OF THE AVERAGE SIZE HOME BY CITY: October year-over-year changes in the median price of the average size detached home by city in the Coachella Valley ranged from 28.9% for the average size 3,450 sq ft detached home in Indian Wells to 3.2% for the average size 2,500 sq ft detached home in Bermuda Dunes. October year-over-year changes in the median price of the average size attached home ranged from 36.8% for the average size 750 sq ft attached home in Desert Hot Springs to 14.6% for the average size 1,775 sq ft attached home in Rancho Mirage. Market Watch pointed out that median price increases were slowing in every Coachella Valley city, particularly for detached homes.
 OCTOBER MONTHLY COACHELLA VALLEY HOME SALES (THREE MONTH MOVING AVERAGE): October monthly total home sales (3-month average) averaged 534 homes (down 33.8% from average monthly total home sales of 806 homes in October 2021 and down 8.1% from average monthly total home sales of 581 homes in September). Market Watch pointed out that October’s average monthly home sales were also down 28.4% from the pre-pandemic October average of 746 home sales. Market Watch expressed their opinion that with the Federal Reserve continuing to tighten interest rates, it does not appear these home sales figures will turn around anytime soon.
 OCTOBER MONTHLY COACHELLA VALLEY HOME SALES (TWELVE MONTH MOVING AVERAGE): The 12-month average of home sales removes the seasonality from home sales data and showed average monthly total home sales of 793 in October (down 24.5% from 1,050 home sales in October 2021 and down 3.7% from an average of 823 home sales in September). Market Watch pointed out that because the shorter 3 month average monthly home sales have reached a new low, the longer 12 month average monthly home sales will also continue to decline to below the pre-pandemic averages.
 OCTOBER COACHELLA VALLEY HOME SALES BY CITY: Market Watch pointed out that home sales decreased in every Coachella Valley city other than Coachella. Home sales decreased by 48.7% year-over-year in Cathedral City, 43.4% in La Quinta and 35.3% in Palm Springs.
 OCTOBER COACHELLA VALLEY HOME SALES BY PRICE RANGE: While home sales decreased in every price range, the largest declines were in sales of homes priced under $400,000. Sales of homes priced between $200,000 and $300,000 declined by 65.3% year-over-year and sales of home priced between $300,000 and $400,000 declined by 49.3% year-over-year. Sales of homes priced between $800,000 and $900,000 were almost unchanged year-over year. Sales of homes priced over $1 million declined by 22.5% year-over-year.
 COACHELLA VALLEY HOME INVENTORY: On November 1st, Coachella Valley home inventory was 2,048 homes (up 241 homes or 13.3% from 1,807 homes on October 1st and up 1,133 homes or 123.8% from 915 homes on November 1st, 2021). Market Watch noted that this increase in home inventory was opposite to almost every other California region, where inventory generally declined slightly last month. Further, they noted that some of this increase in inventory was seasonal and that if the pattern continues, inventory would probably reach 2,500 units by February (compared to pre pandemic inventory norms of over 3,000 homes).
COACHELLA VALLEY REGIONAL MONTHS OF SALES RATIO: On November 1st, the Coachella Valley’s months of sales ratio was 2.6 months. While higher than September’s 2.2 months of sales, this ratio is still considerably below the 4.0 months that is historically normal for this time of year. Market Watch felt that even though the home inventory has been increasing and home sales have been decreasing, the changes have not been enough to bring the months of sales ratio back to normal levels. Market Watch went on to state that the months of sales ratio measures supply versus demand and a ratio of 2.6 still implies that the balance of supply and demand somewhat favors the seller. They felt that this has helped limit price corrections.
 COACHELLA VALLEY MONTHS OF SALES RATIO BY PRICE RANGE: Months of sales ratios in every price range far exceed year ago levels. Market Watch noted both the evenness of the inventory recovery and that the inventory recovery is occurring across all price ranges.
 COACHELLA VALLEY MONTHS OF SALES RATIO BY CITY: In October, Indian Wells and Bermuda Dunes had the lowest months of sales ratios at 2.2 and 2.3 months respectively. The highest months of sales ratios were in Desert Hot Springs at 2.9 months and Thousand Palms at 3.0 months. Other than these cities, the months of sales rations across the Coachella Valley were between 2.5 and 2.7 months,
 COACHELLA VALLEY REGIONAL DAYS IN THE MARKET: Average home selling times in the Coachella Valley increased in October to 35 days (compared to 25 days one year ago and 32 days in September). Market Watch felt that this metric will rapidly increase back to 50 or 60 days (the historically normal days in the market in the Coachella Valley).
 COACHELLA VALLEY DAYS IN THE MARKET BY CITY: In October, Indian Wells had the shortest median selling time for detached homes at 25 days (compared to 26 days one year ago), followed by Rancho Mirage at 29 days (compared to 26 days one year ago). In October, Desert Hot Springs had the shortest median selling time for attached home at 23 days (compared to 11 days one year ago), followed by Cathedral City at 30 days (compared to 34 days one year ago).
PERCENTAGE OF COACHELLA VALLEY HOMES SELLING ABOVE LIST PRICE: While the percentage of homes in the Coachella Valley selling above list price is rapidly declining, at the end of October, 21.6% of home sales occurred above list price (compared to 46.2% one year ago and 27.7% in September). Market Watch noted that the percentage of homes selling over list price continued to retreat in October to the historic norm of around 10%.
 AVERAGE SALES PRICE DISCOUNTS FROM LIST BY CITY: Bermuda Dunes was the only Coachella Valley city with a selling premium (0.5%) for detached homes in October. Bermuda Dunes was also the only Coachella Valley city with a selling premium (0.6%) for attached homes in October. All other Coachella Valley cities had average sale price discounts of between 0.1% to 2.9% for both detached and attached homes.

The Briggs Group at COMPASS | Laurie Briggs – CalDRE# 01896117 | Tim Briggs – CalDRE# 01898254 | COMPASS – CalDRE# 01991628


 COACHELLA VALLEY SEPTEMBER DETACHED HOME MEDIAN PRICE: The detached home median price in the Coachella Valley in September decreased to $670,000 (down 1.8% from $682,000 in August but still up 14.5% from $585,000 in September 2021). Market Watch opined that while most of this median price decrease was seasonal, some of the decrease also represents the general corrective turn currently occurring in home prices. They also warned about the need to follow the market data rather than people’s alarming comments about the market.
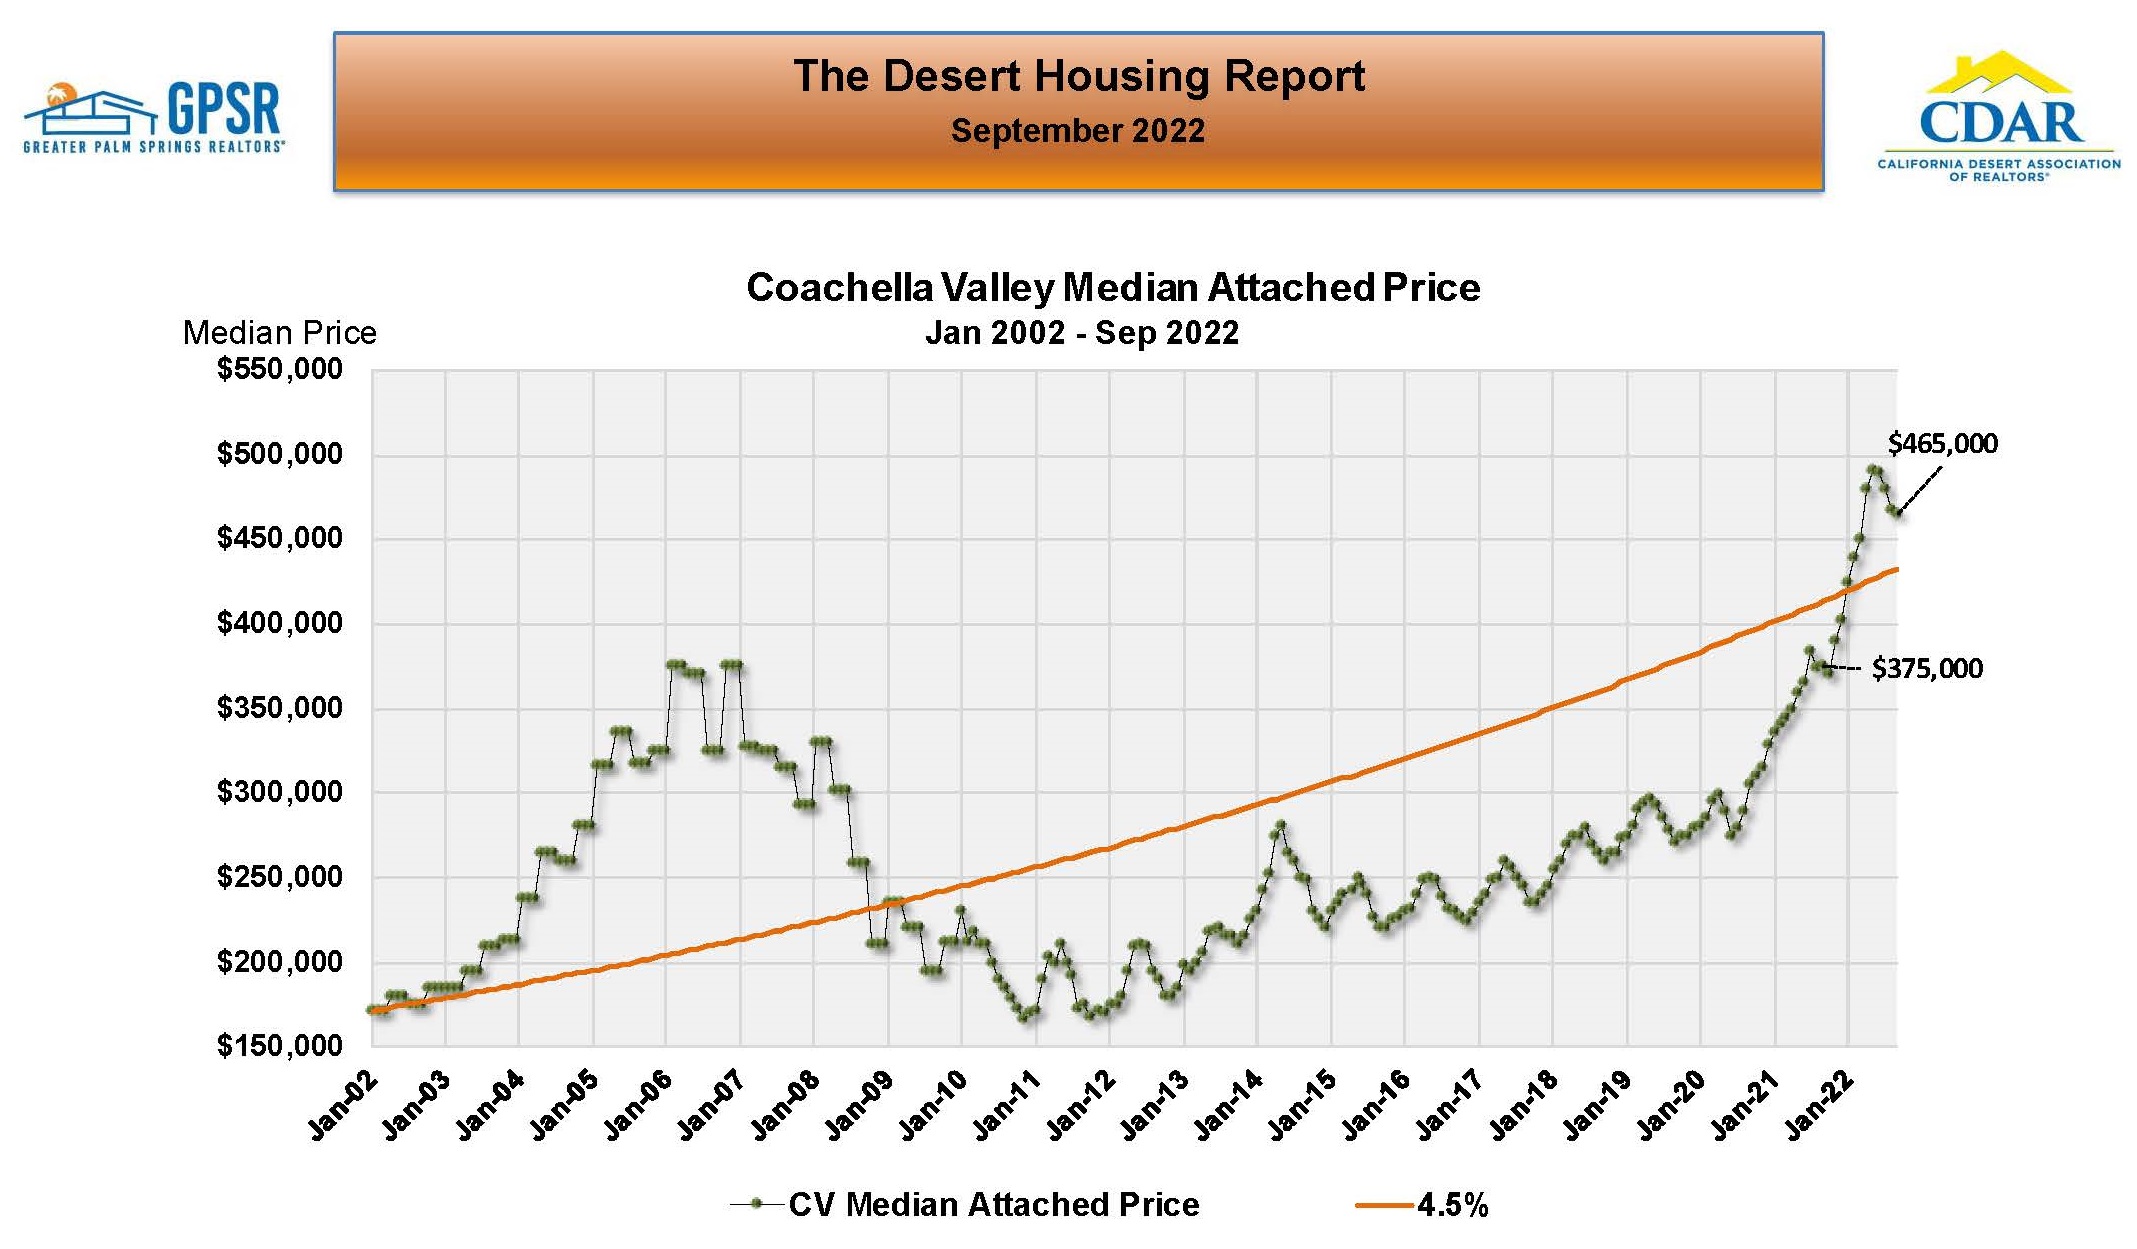 COACHELLA VALLEY SEPTEMBER ATTACHED HOME MEDIAN PRICE: The attached home median price in the Coachella Valley in September was $465,000 (down 0.5% from $467,500 in August but up 24% from $375,000 in September 2021). Market Watch noted that past median price data has showed seasonal price corrections of 10% occurring in the attached home market during the summer. However, Market Watch felt that there may be a larger than normal price correction this year (to around $435,000). This would bring attached home median prices to near the 4.5% growth curve.
 SEPTEMBER TWELVE MONTH CHANGE IN PRICE OF THE AVERAGE SIZE HOME BY CITY: September year-over-year changes in the median price of the average size detached home ranged from 34.1% for the average size 3,450 sq ft detached home in Indian Wells to 12.2% for the average size 2,500 sq ft detached home in Bermuda Dunes. September year-over-year changes in the median price of the average size attached home ranged from 59.9% for the average size 750 sq ft attached home in Desert Hot Springs to 17.7% for the average size 1,450 sq ft attached home in Bermuda Dunes.
 SEPTEMBER MONTHLY COACHELLA VALLEY HOME SALES (THREE MONTH MOVING AVERAGE): September monthly total home sales (3-month average) averaged 581 homes (down 32.4% from average monthly total home sales of 860 homes in September 2021 and down 13.8% from average monthly total home sales of 674 homes in August). Market Watch pointed out that September’s average monthly total home sales were also down 25.9% from average monthly total home sales of 784 homes over the three years before the pandemic. Market Watch expressed their opinion that with the Federal Reserve tightening interest rates as it is, it does not appear these numbers will turn around anytime soon.
 SEPTEMBER MONTHLY COACHELLA VALLEY HOME SALES (TWELVE MONTH MOVING AVERAGE): The 12-month average of home sales takes all seasonality out of the home sales data and showed average monthly total home sales of 823 homes in September (down 23.5% from 1,076 home sales in September 2021 but roughly equal to the average monthly total home sales level before the pandemic). Market Watch pointed out that long-term average monthly sales of detached homes in September continued to be above pre-pandemic levels but that long-term average monthly sales of attached homes in September were below pre-pandemic levels. However, they also noted that because shorter-term average monthly home sales continue to decline, longer-term average monthly home sales will also continue to decline for awhile.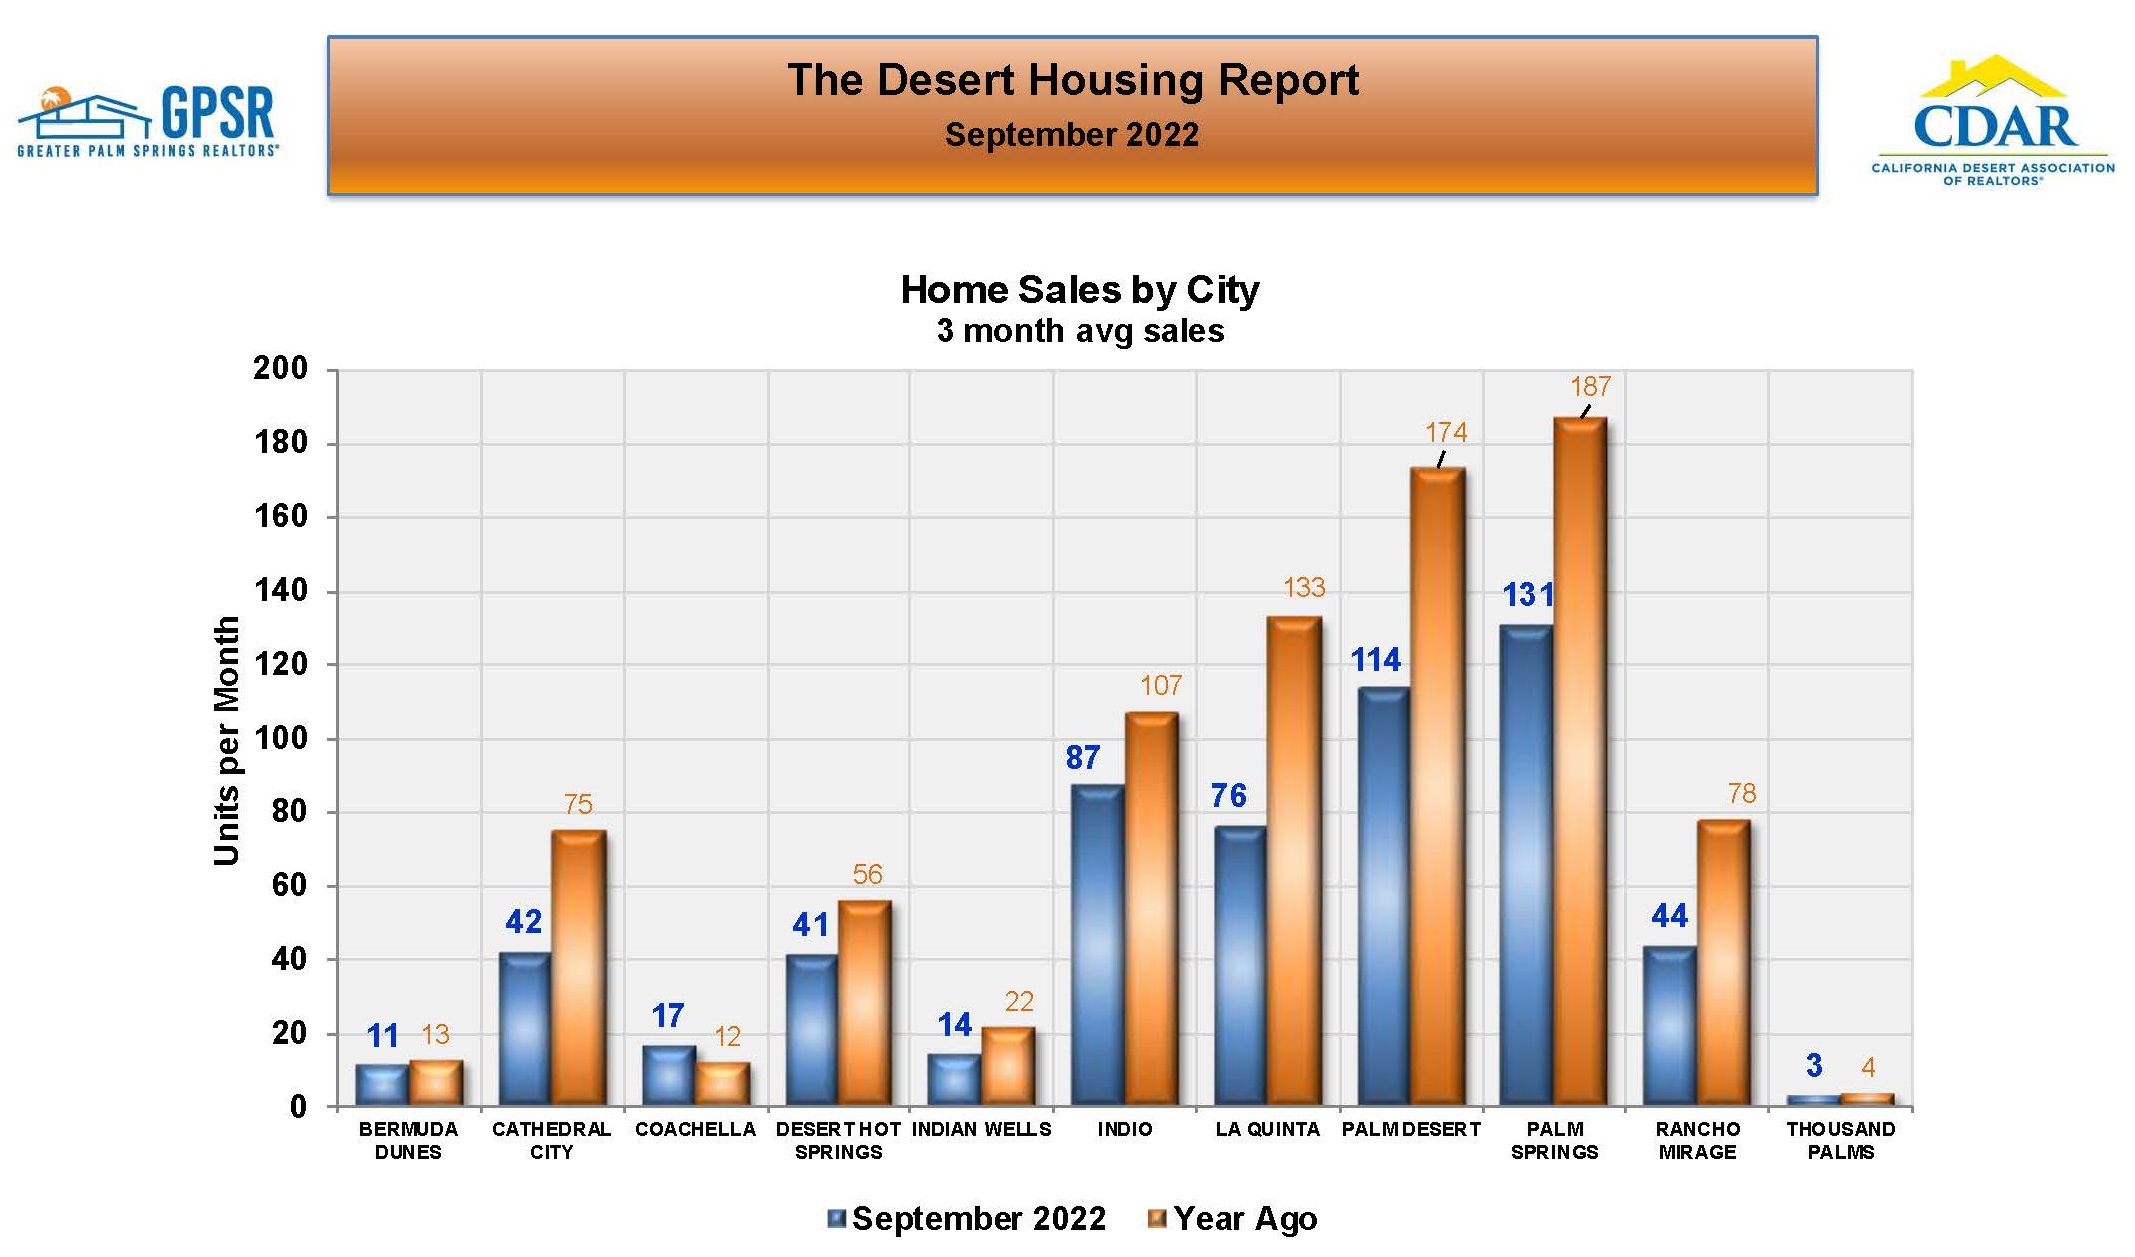
 SEPTEMBER COACHELLA VALLEY HOME SALES BY PRICE RANGE: Home sales decreased in every price range other than the $800,000 to $900,000 price range, with the largest percentage price decreases occurring in the sales of homes priced under $500, 000. For homes priced between $200,000 and $300,000, September home sales decreased by 59% year-over-year and for homes priced between $300,000 and $400,000 September home sales decreased by 53.6% year-over-year. In comparison, September sales of homes priced over one million dollars were down 12.2% year-over-year.
 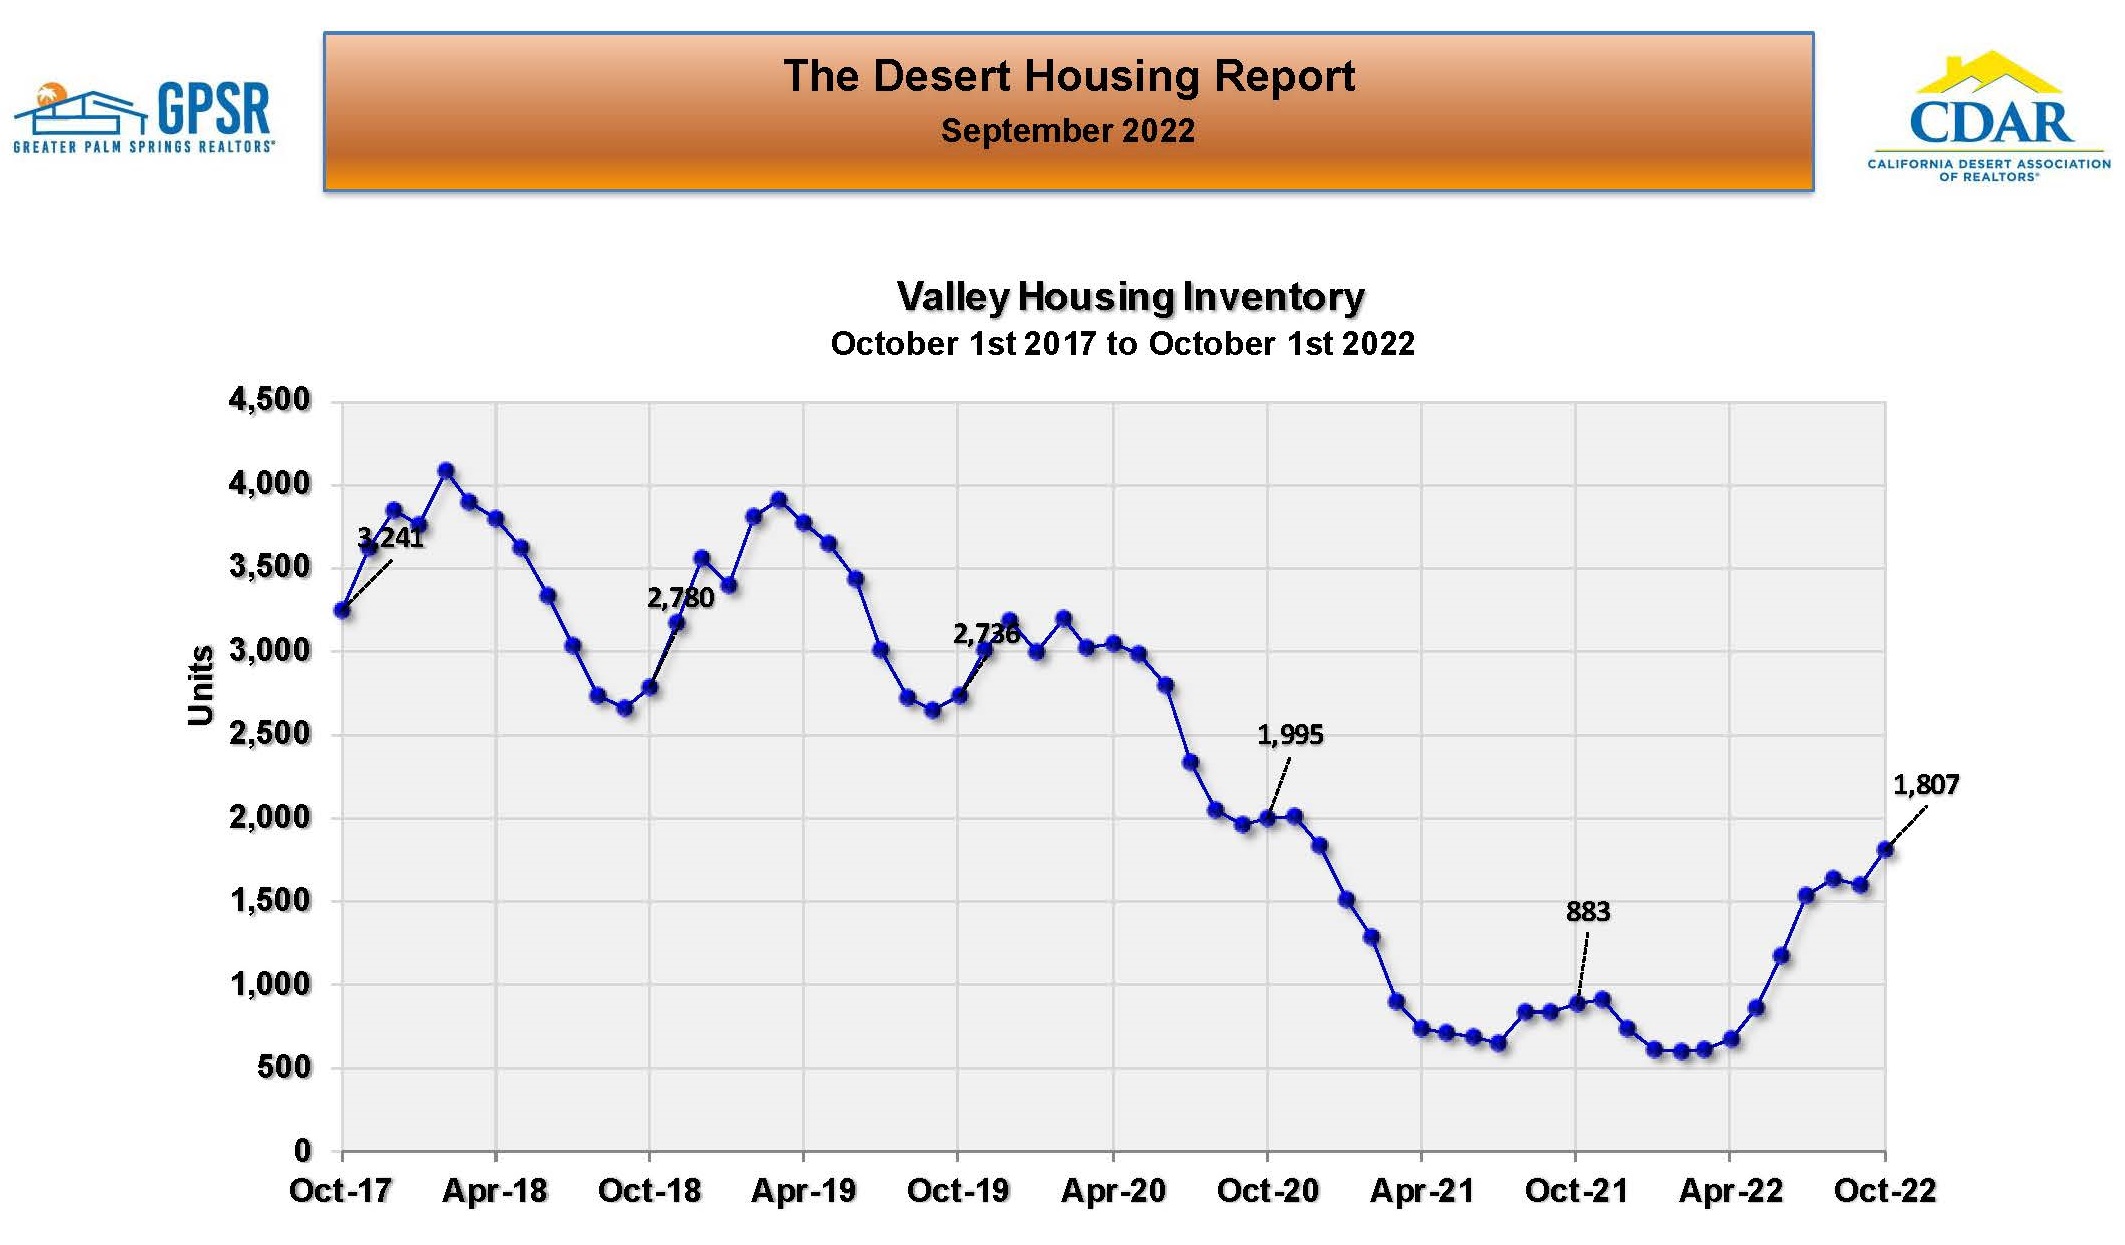 COACHELLA VALLEY HOME SALES INVENTORY: On October 1st, the Coachella Valley’s home sales inventory was 1,807 homes (up 13.4% from an inventory of 1,593 homes on September 1st and up 104.6% from an inventory of 883 homes on October 1st 2021). Market Watch noted that this inventory increase in the Coachella Valley is opposite to almost every other California region, where inventory generally contracted last month. They noted that some of this inventory increase is seasonal and if the seasonal trend continues, the inventory level might reach 2,500 homes by February (but still below past norms).
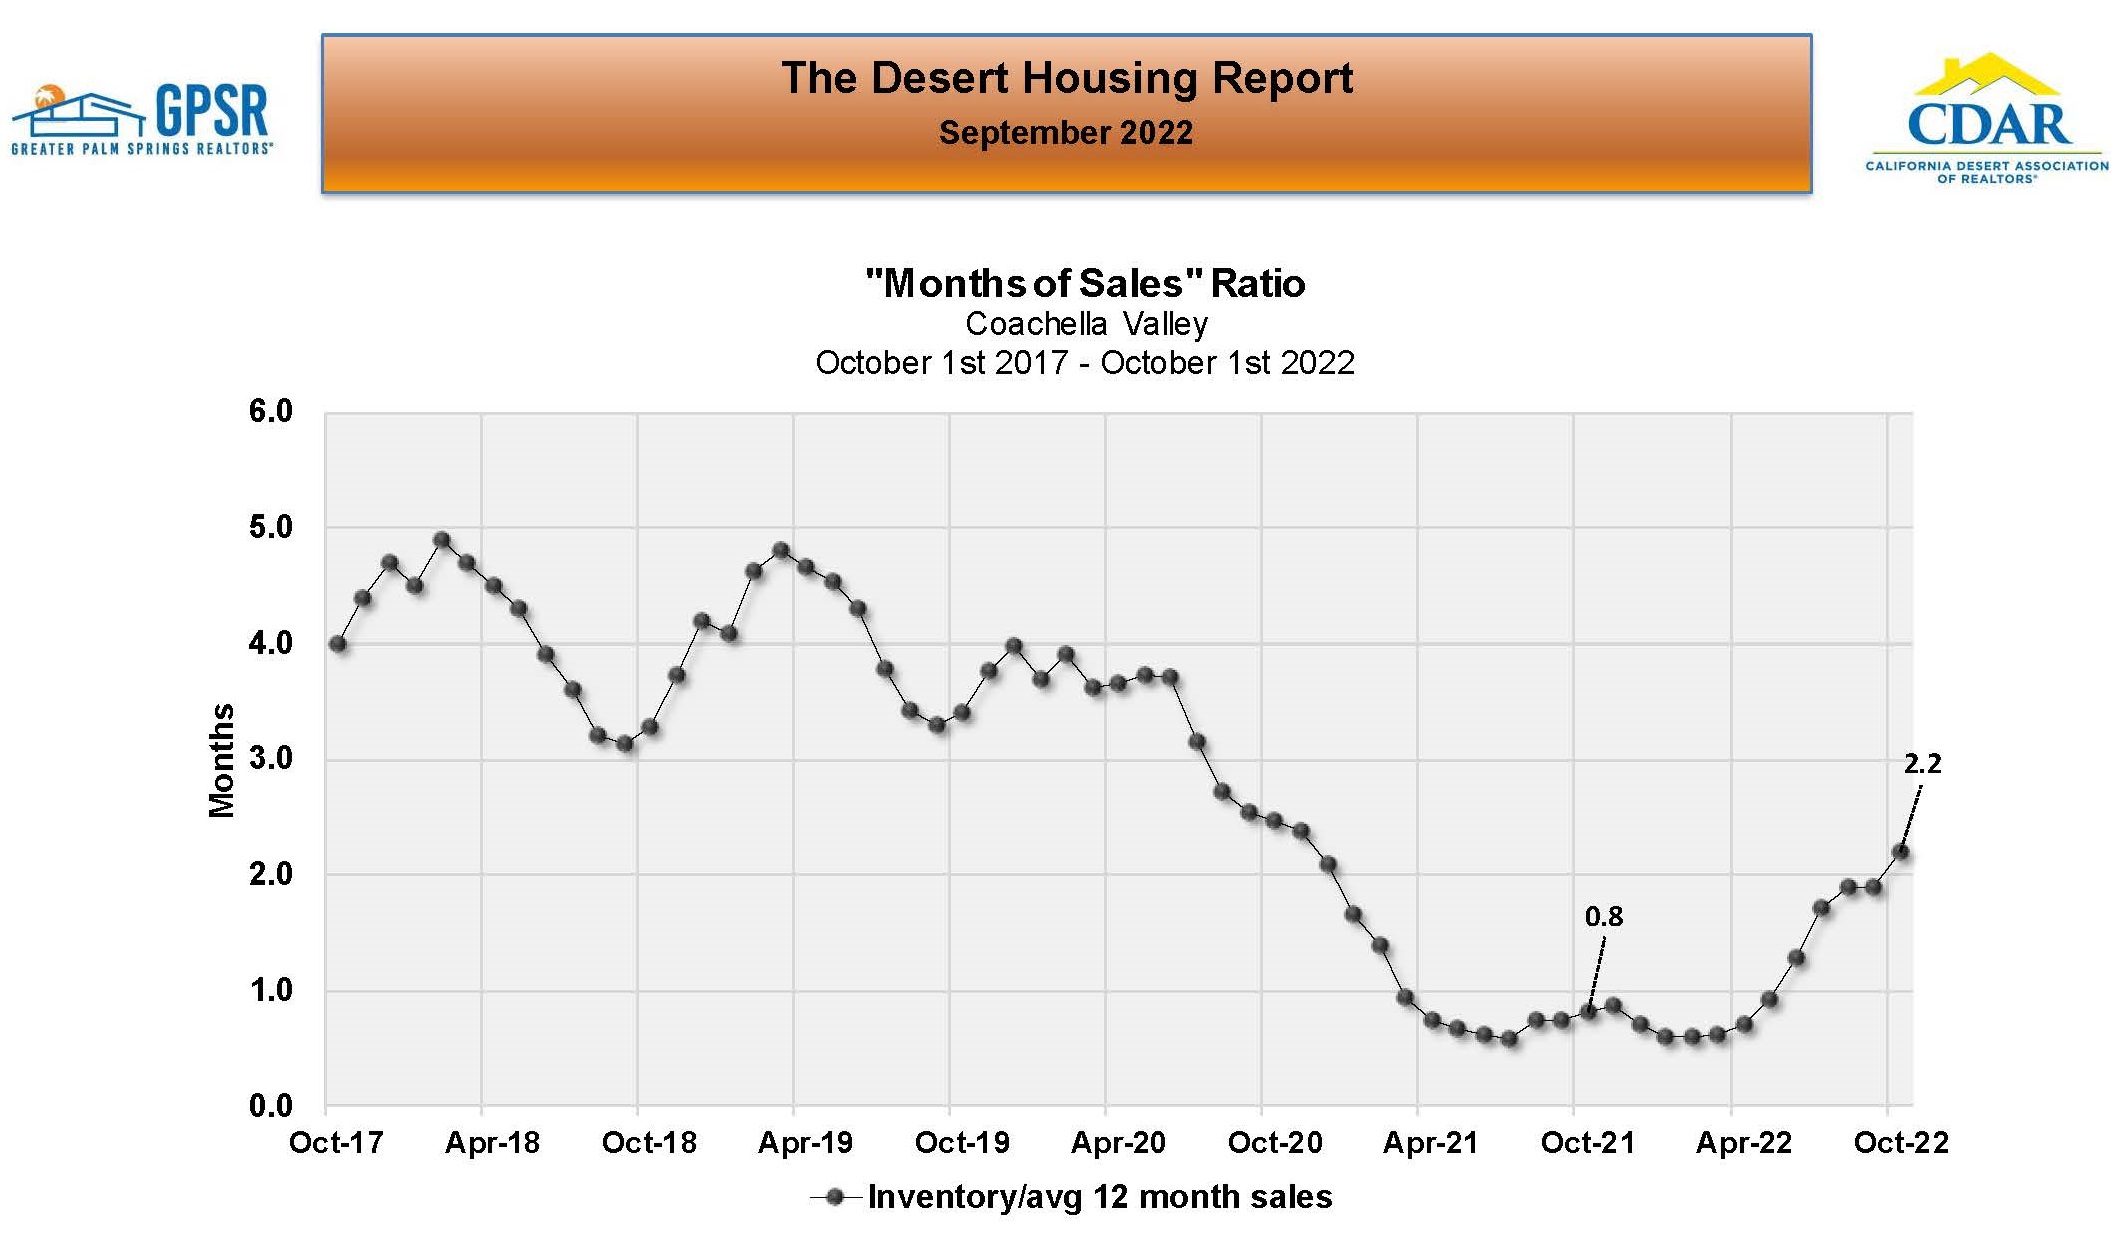 COACHELLA VALLEY REGIONAL MONTHS OF SALES RATIO: On October 1st, the Coachella Valley’s months of sales ratio was 2.2 months (up from 1.9 months in August and up from 0.8 months one year ago). Nevertheless, the months of sale ratio remains considerably below the 3.0 to 3.5 months that is normal for late-summer. Market Watch felt that even though home inventories have been rising and home sales falling, the changes are still not enough to bring the months of sales ratio back to normal levels. Market Watch stated that this is important because the months of sales ratio measures supply versus demand and a ratio of 2.2 implies that the balance of supply and demand still somewhat favors the seller. They went on to state that the Coachella Valley months of sales ration might return to a normal months of sales ratio by February.
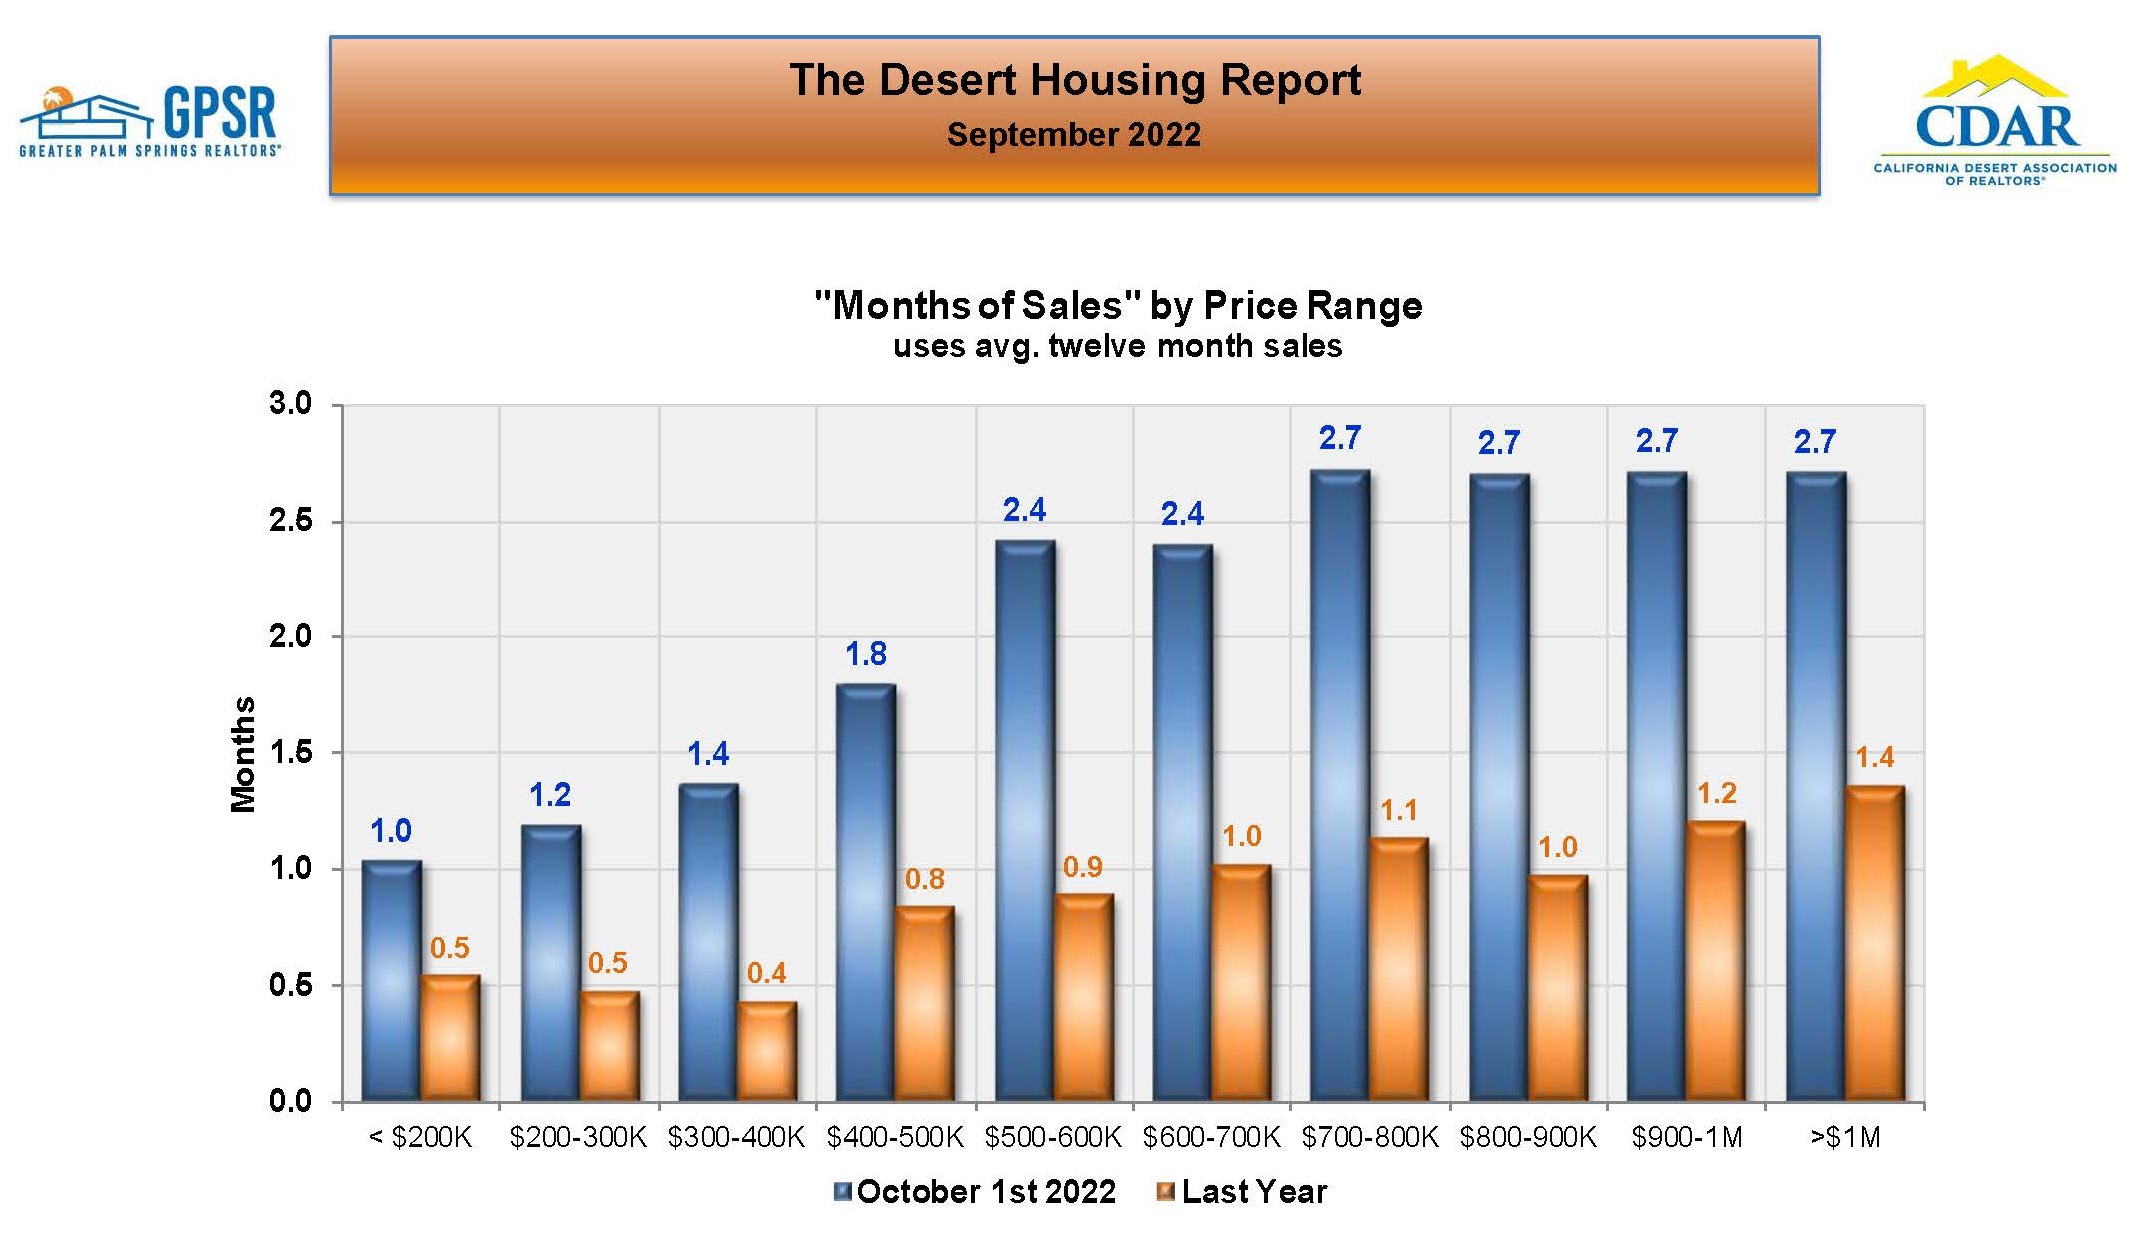 COACHELLA VALLEY MONTHS OF SALES RATIO BY PRICE RANGE: Months of sales ratios were considerably higher than one year ago in every price range. The months of sales rations were 2.7 months for all price ranges above $700,000.
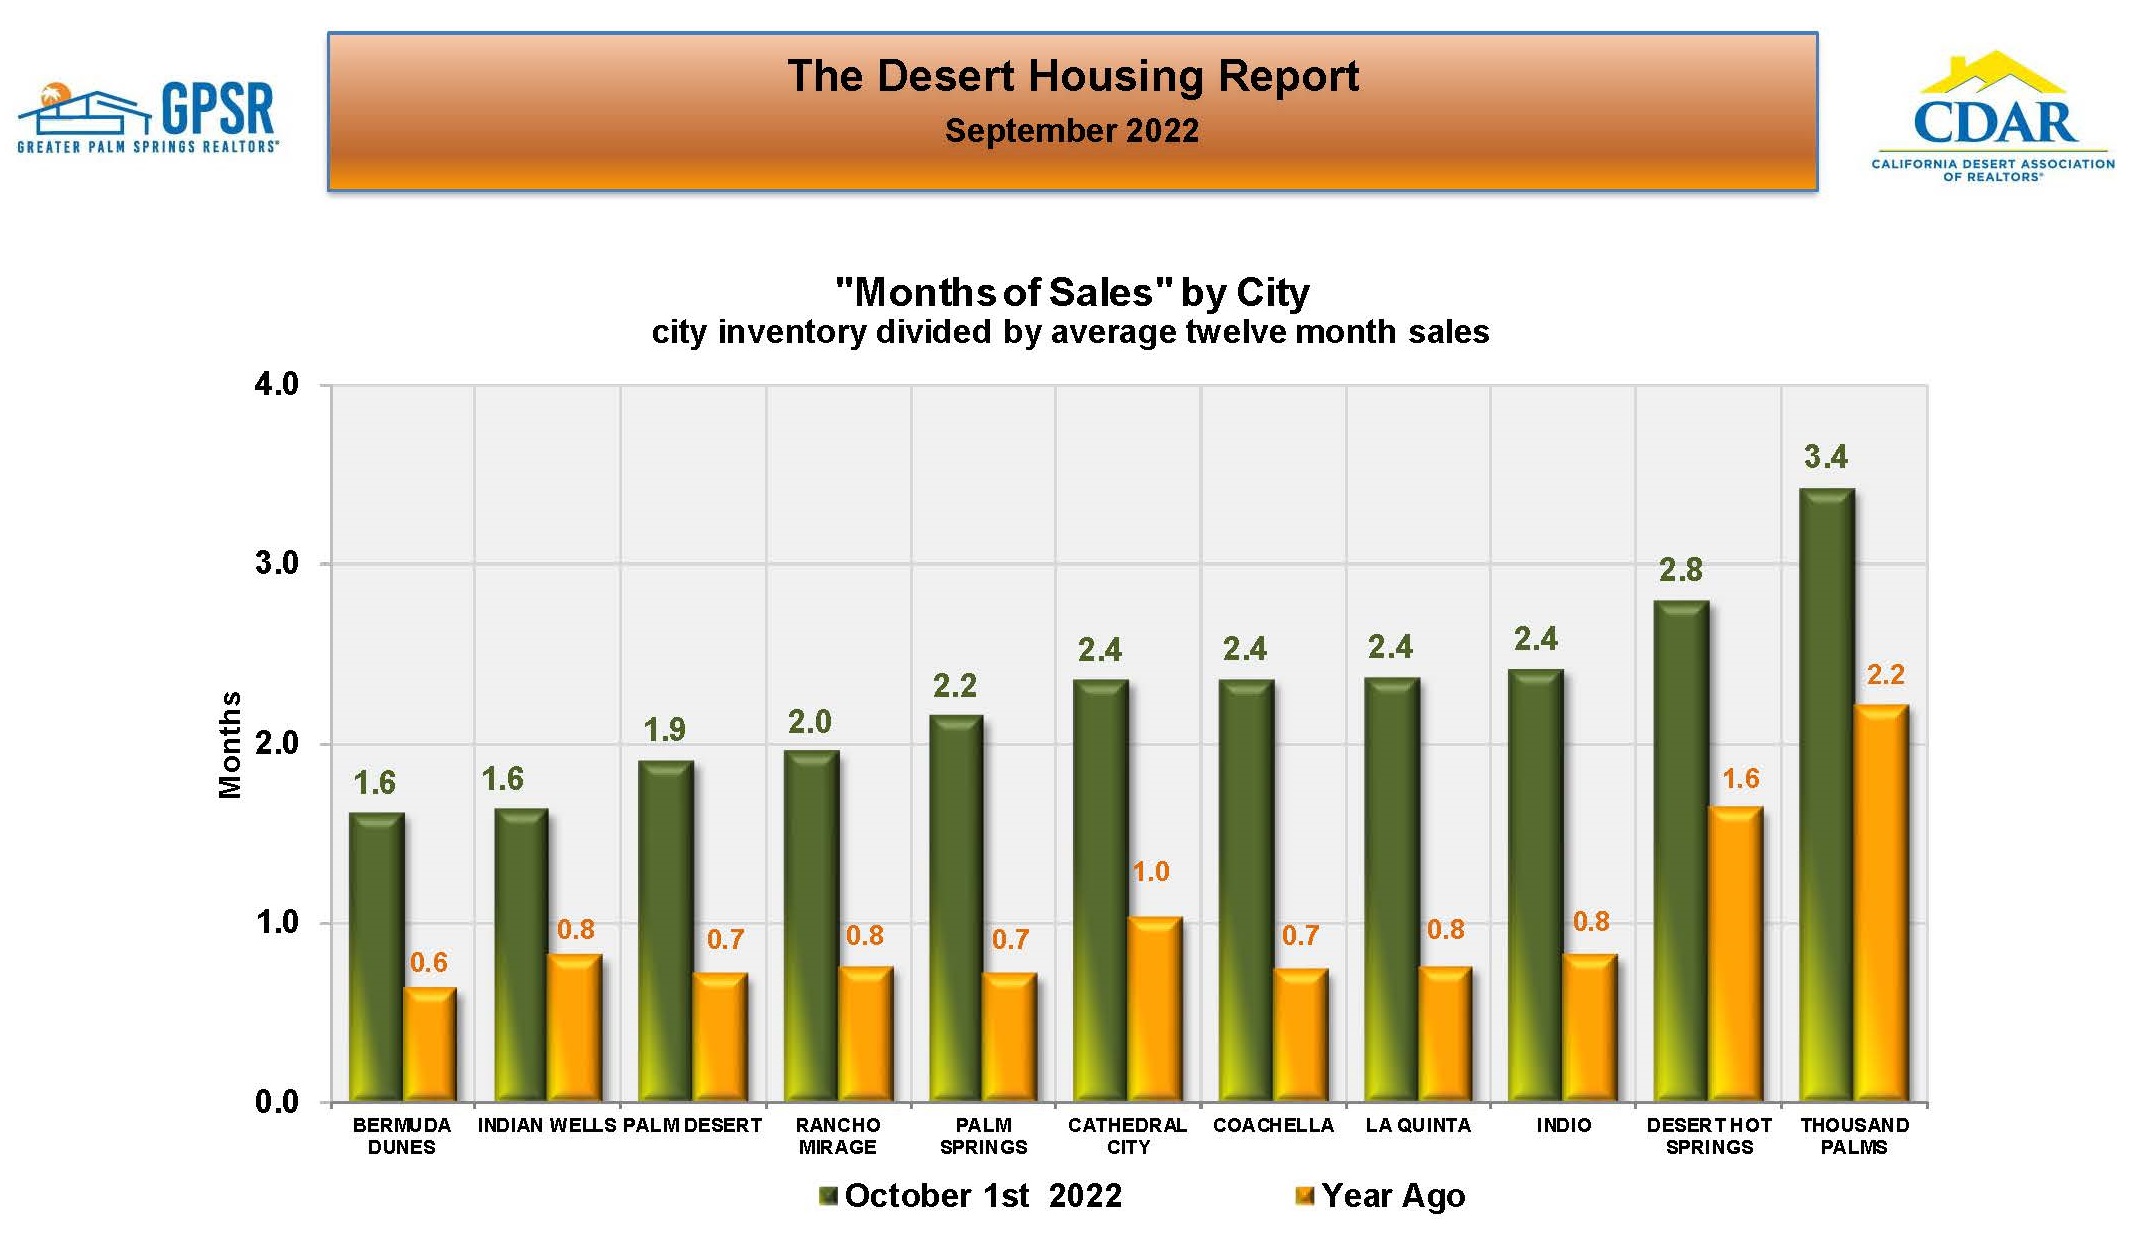 COACHELLA VALLEY MONTHS OF SALES RATIO BY CITY: In September, Bermuda Dunes and Indian Wells had the lowest months of sales ratios at 1.6 months. The highest months of sales ratios were in Desert Hot Springs at 2.8 months and Thousand Palms at 3.4 months. Other than these cities and their months of sales ratios, the months of sales rations were between 1.9 and 2.2 months,
 COACHELLA VALLEY REGIONAL DAYS IN THE MARKET: Average home selling times in the region increased in September to 32 days (compared to 24 days one year ago). Market Watch thought that that this metric will rapidly increase back to 50 or 60 days, which is historically normal for the Coachella Valley.
 COACHELLA VALLEY DAYS IN THE MARKET BY CITY: In September, Indian Wells had the shortest median selling time for detached homes at 24 days, followed by Rancho Mirage at 27 days. In September, Desert Hot Springs had the shortest median selling time for attached home at 23 days, followed by Cathedral City at 25 days.
 PERCENTAGE OF COACHELLA VALLEY HOMES SELLING ABOVE LIST PRICE: While the percentage of homes in the Coachella Valley selling above list price is rapidly decreasing, at the end of September 27.7% of home sales occurred above list price (compared to 50.2% one year ago). Market Watch expects the percentage of homes selling above list price will return to historic norms of around 10% near the end of the year.
 AVERAGE SALES PRICE DISCOUNTS FROM LIST BY CITY: Only four Coachella Valley cities had selling premiums for detached homes in September, with Coachella and Desert Hot Springs having the highest premiums at 0.6% and 0.3% respectively. No city currently has a selling premium for attached homes
 The Briggs Group | Laurie Briggs – CalDRE# 01896117 | Tim Briggs – CalDRE# 01898254 | COMPASS – CalDRE# 01991628
 Open House: Stylish Golf Course Home Located In Rancho Mirage’s Mira Vista Community | When: Saturday September 24th from 2PM to 4PM | Where: 45 Vista Encantada, Rancho Mirage
  Open House: South Palm Desert Character Home With Large Lot & Spacious Detached Casita | When: Saturday September 24th from 10 AM to NOON | Where: 73304 Willow St, Palm Desert