
(To view our short YouTube video, please click on the image above)
Our local real estate market experts, Market Watch LLC have just released “The COVID-19 Desert Real Estate Report” for December 2020. Some highlights:
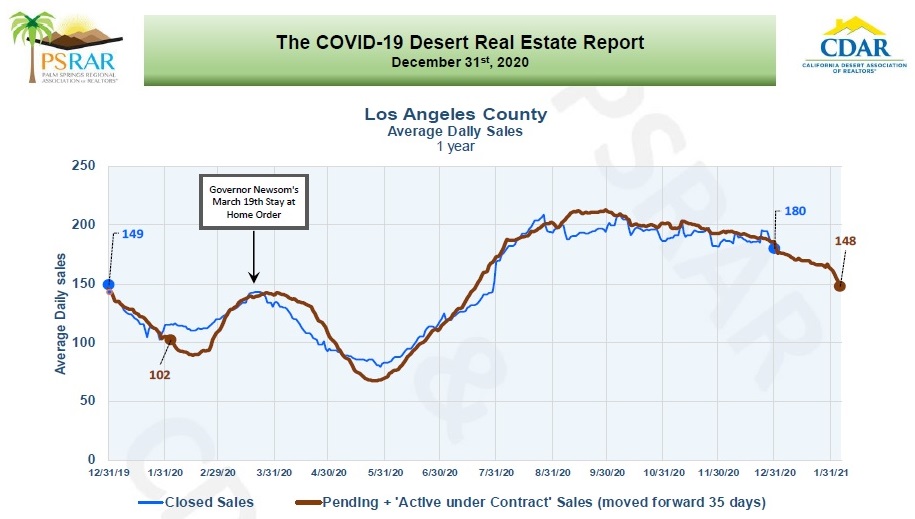 Market Watch starts this report by comparing the Coachella Valley housing market with Los Angeles and Orange Counties, using average daily pending and active under contract sales. With average escrow times in these two counties of between 30 to 35 days, shifting pending and active under contract sales forward by 35 days provides a forecasting tool for closed sales. Market Watch pointed out that the post quarantine sales surge in Los Angeles County that peaked in August with average daily pending and active under contract home sales of approximately 200 home sales per day has gradually been slowing down. However, Market Watch felt that a lot of this sales decline was seasonal and did not reflect a real market change. LA County average daily pending and active under contract home sales in December were 148 home sales per day (up 45% year-over-year) and closed home sales were 180 home sales per day (up 21% year-over-year).
 Market Watch noted that Orange County continued to show an almost identical recovery pattern to Los Angeles County in December. In Orange County in December average daily pending and active under contract home sales were 70 home sales per day (up 52% year-over-year). Orange County average daily closed home sales were 89 home sales per month (up 25% year-over-year). The average daily pending and active under contract sales indicate that Orange County should continue to experience seasonal sales declines over the next month, with closed home sales dropping from roughly 89 home sales per day to around 70 home sales per day.
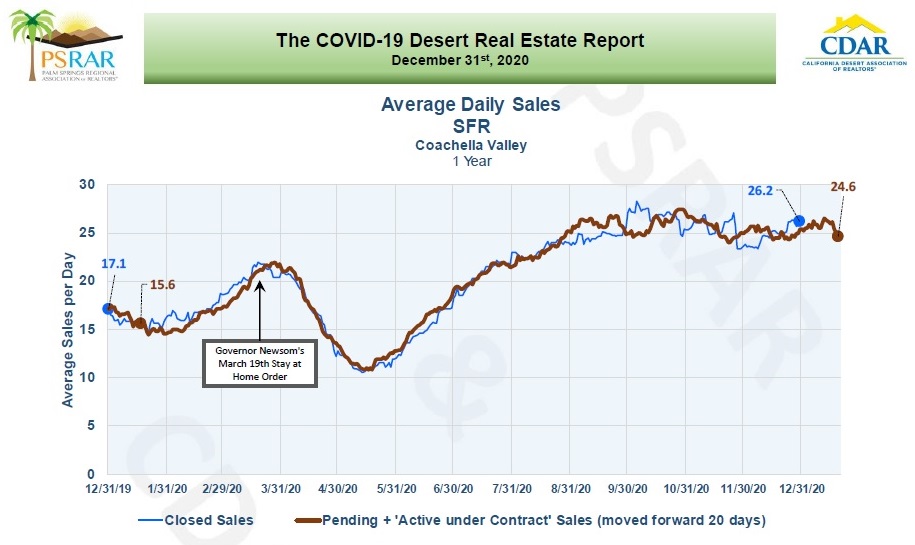 Since Coachella Valley escrow times for single-family residences average around 20 days (because of the large number of cash transactions), shifting average daily pending and active under contract home sales forward 20 days provides a forecast of average daily closed home sales. Market Watch noted that unlike Los Angeles and Orange Counties, average daily pending and active under contract home sales of single-family residences in the Coachella Valley continued at historically high levels in December. Average daily pending and active under contract home sales averaged 24.6 home sales per day (up 67% year-over-year).
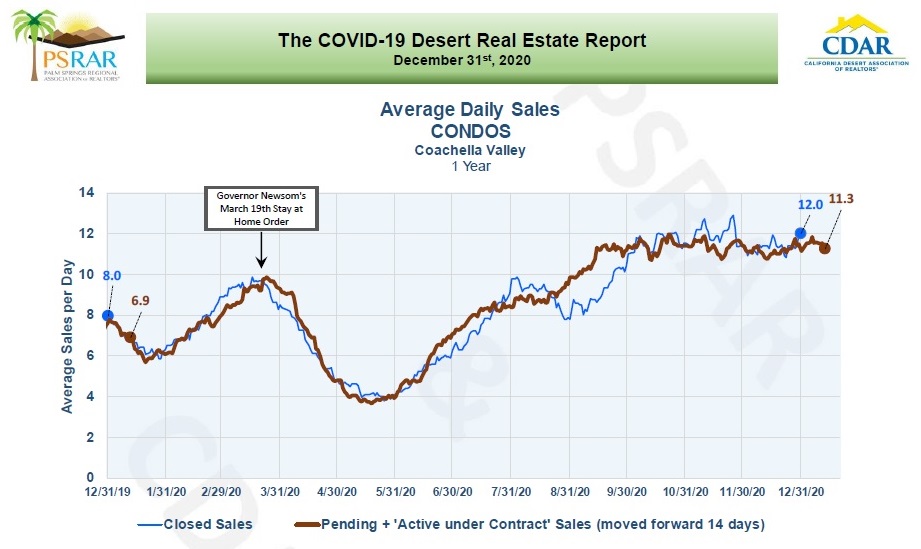 Market Watch noted that average escrow times for condominiums are about two weeks. Average daily pending and active under contract sales for condominiums were 11.3 home sales per day in December (up 64% year-over-year) while average daily closed home sales were 12 home sales per day in December for condominiums (up 50% year-over-year).
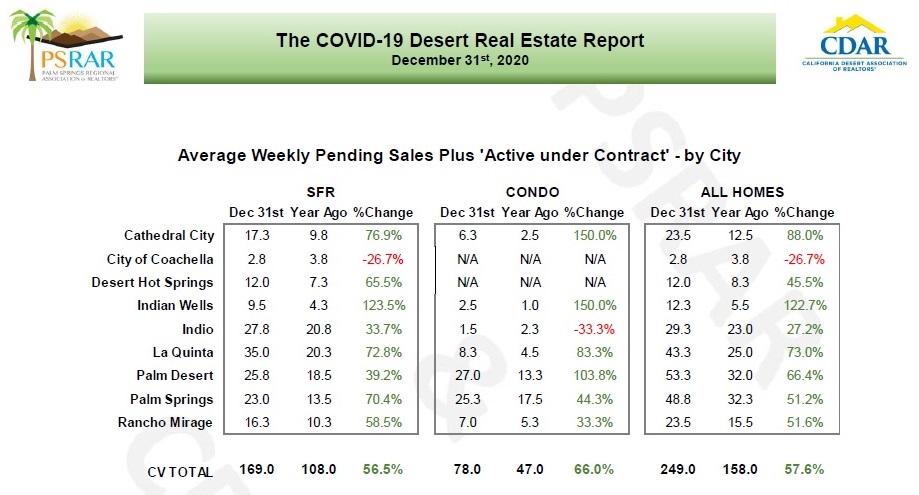 Market Watch felt that three cities stood out in terms of increases in average weekly pending and active under contract home sales year-over-year in December. Average weekly pending and active under contract sales of all homes (single-family residences and condos) in December increased by 122.7% in Indian Wells, 88% in Cathedral City and 73% in La Quinta. Average weekly pending and active under contract sales of condos in December increased year-over-year by 150% in both Cathedral City and Indian Wells, 103.8% in Palm Desert and 83.3% in La Quinta.
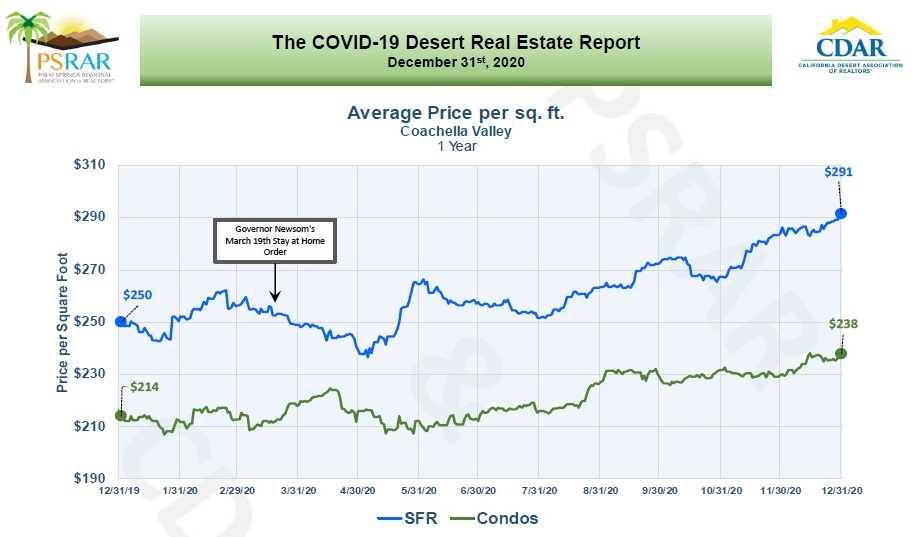 The average Coachella Valley single-family residence price per square foot in December was $291 (up 16.4% year-over-year). The average Coachella Valley condominium price per square foot in December was $238 (up 11.2% year-over-year).
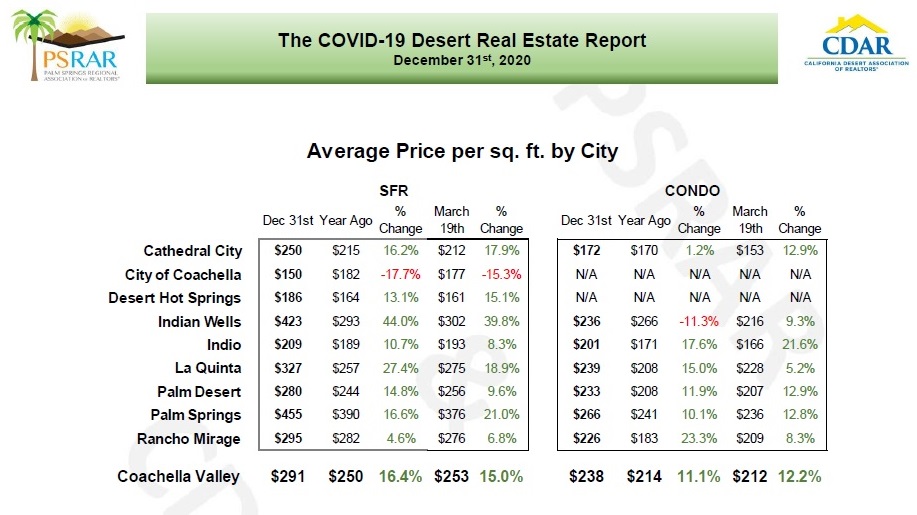 The average Coachella Valley single-family residence price per square increased year-over-year in December by 44% in Indian Wells, 27.4% in La Quinta and 16.6% in Palm Springs. The average Coachella Valley condominium price per square foot increased year-over-year in December by 23.3% in Rancho Mirage, 17.6% in Indio and 15% in La Quinta.
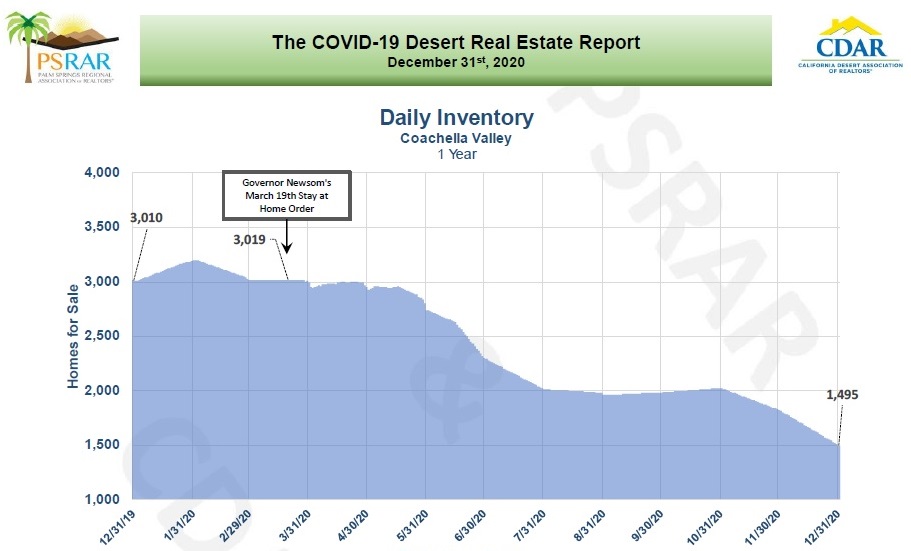 Total Coachella Valley housing inventory on January 1st was 1,495 homes (roughly 50% less than one year ago). Market Watch felt that some this inventory decline was seasonal and could not imagine inventory going much lower as we move into what has traditionally been our new selling season. Market Watch felt that many people may have refrained from listing their homes for sale with the pandemic raging out of fear of strangers coming into their homes.
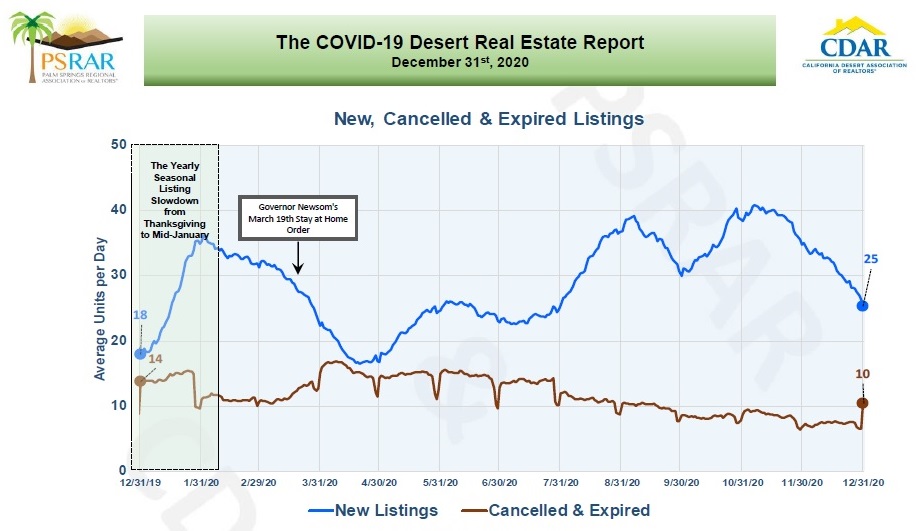 Market Watch noted that new listings have been falling since Thanksgiving, which is a normal seasonal pattern. They felt that if history is a guide, new listings should begin to rise starting in the second week in January. Average daily new listings were 25 in December (compared to 18 in December 2019).
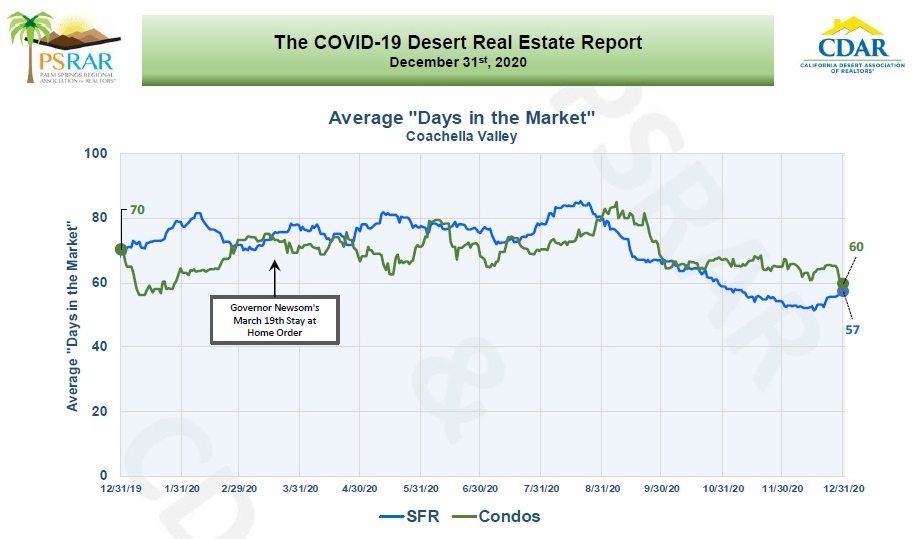 The Coachella Valley average number of days in the market for single-family residences in December was 57 days (compared to 70 days in December 2019). The Coachella Valley average number of days in the market for condominiums in December was 60 days (compared to 70 days in December 2019).
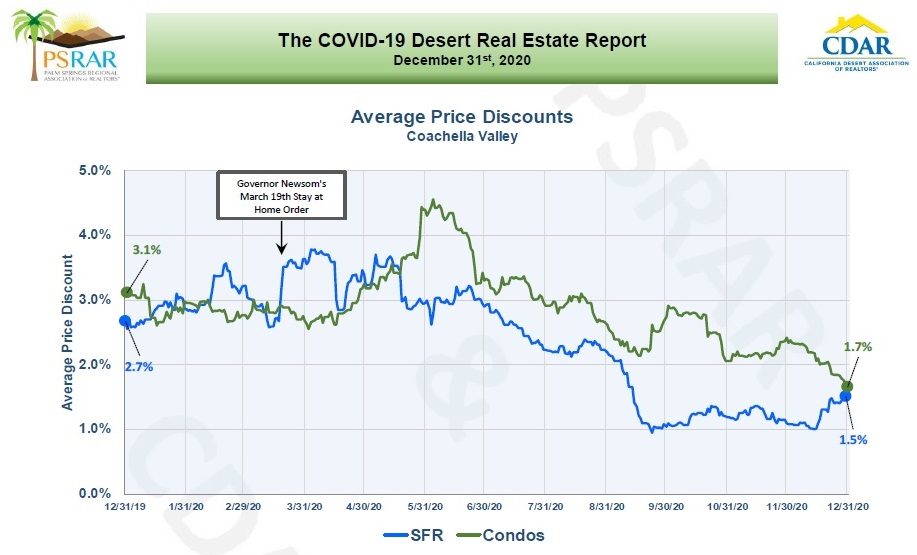
Price discounts from list for single-family residences jumped to 1.5% at the end of December, after averaging about 1% for the last three months (but still down from 2.7% at the end of December 2019). Average price discounts from list for condominiums at the end of the year was 1.7% (down from 3.1% at the end of December 2019).

CalDRE 01898254 | 01896117 | 01991628

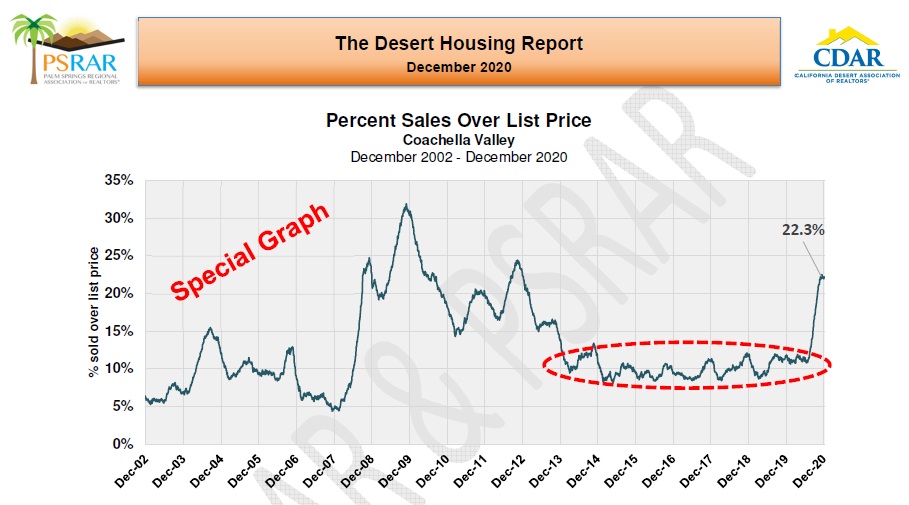 The December Report starts with a look at the percentage of Coachella Valley homes sold over the last 90 days above list price. Since a home will only sell above list price if there are multiple bidders, Market Watch felt that this is an indirect measure of how many bidding wars are breaking out. Historically one out of every 10 homes (or 10%) sold in the Coachella Valley since 2013 sold above list price. Most recently, one out of every 4.5 homes (or 22.3%) sold in the Coachella Valley over the last 90 days sold above list price. Market Watch explained that this shows the bidding pressure that has been accelerating Coachella valley home price increases due to the lack of supply.
 The Coachella Valley attached home median price in December was $329,000 (up 17.9% year-over-year and the highest Coachella valley attached home median price since 2007). Market Watch noted that attached home prices have been surging for five months now, after lagging an earlier surge in detached home median prices. Market Watch felt that attached homes are now supplying homes in the lower price ranges due to the lack of detached homes in the lower price ranges.
 All nine of the Coachella Valley cities surveyed experienced year-over-year detached home median price increases. Six of these cities (La Quinta, Palm Springs, Desert Hot Springs, Cathedral City, Indian Wells and Palm Desert) experienced year-over-year detached home median price increases of over 15%. At the head of the pack, detached median home prices increased year-over-year 27.5% in La Quinta and 22.9% in Palm Springs. Five of the Coachella valley cities surveyed experienced double-digit increases in attached home median prices year-over-year (ranging from an increase of 20.6% in Indian Wells to an increase of 13.6% in Palm Desert). Market Watch’s commentary also noted that in December, the detached home median price in Palm Springs, Cathedral City and Indio now surpassed the previous all-time high detached home median prices reached during the 2006 housing bubble.
 Historically, December falls in a seasonal period when Coachella Valley home sales slow. However, this year Coachella Valley December monthly total home sales were 1,119 homes (an increase of 57.2% year-over-year). December monthly detached home sales were 759 homes (an increase of 51.2% year-over-year) and December monthly attached homes sales were 360 homes (an increase of 71.4% year-over-year).
 The Coachella Valley cities experiencing the greatest surge in home sales in December were La Quinta, with average monthly total home sales of 188 homes (up 77.4% year-over-year), Palm Springs, with average monthly total homes sales of 223 homes (up 60.4% year-over-year) and Palm Desert, with average monthly total home sales of 236 homes in December (up 58.4% year-over-year).
 Market Watch pointed out significant home sales increases in all price ranges over $300,000 in December. In particular, they noted that the average monthly sales of homes priced over one million dollars was 130 homes per month (up 170.8% year-over-year).
 Market Watch noted the decline in the months of sales ratio in all price ranges year-over-year, with the months of sales ratio hovering around two months in all price ranges below one million dollars. Market Watch also noted that the months of sales ratio of 3.8 months for homes priced over one million dollars is the lowest ratio in this price range in Coachella Valley history.
  On January 1st, the months of sales ratio in every one of the Coachella Valley’s eleven cities surveyed was roughly 3 months or less. And seven of these cities (Coachella, Palm Springs, Indio, Cathedral City, Desert Hot Springs, La Quinta and Palm Desert) had months of sales ratios under two months.
 Lastly, in December the median value for sale price discount from list was -0.59% (implying that an average house listed at $500,000 would sell for $497,050).