Highlights from the Greater Palm Springs REALTORS® (GPSR) September 2026 Desert Housing Report, prepared by Market Watch LLC. In short, September sales remained below historic norms, while regional median prices changed little from a year ago and inventory was close to last year’s level.
COACHELLA VALLEY SEPTEMBER SALES RECOVERY
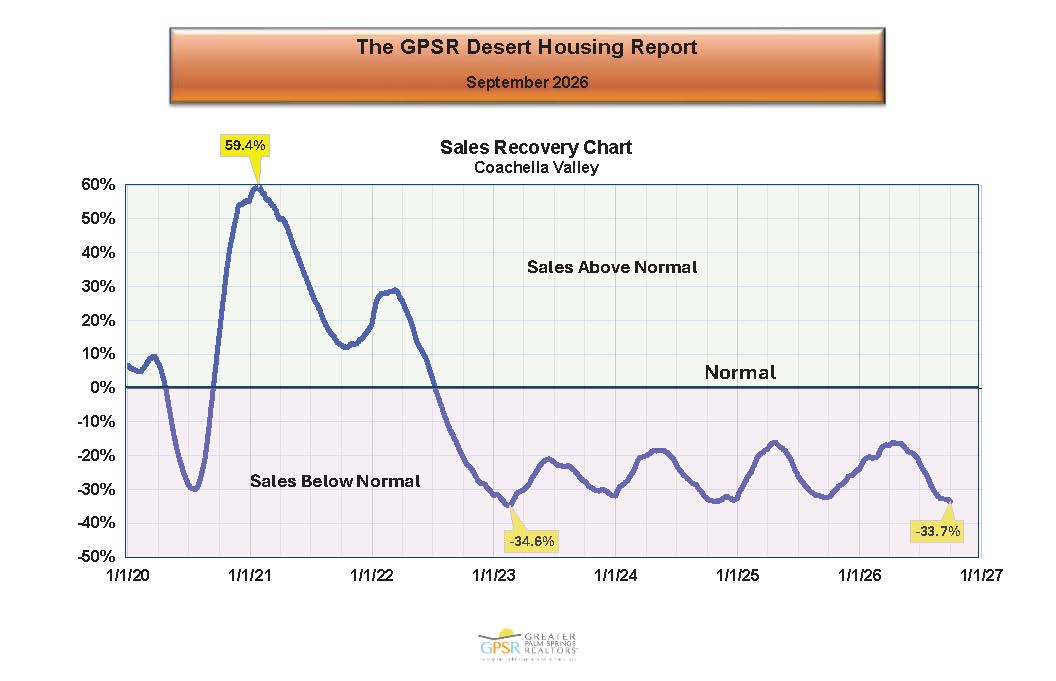 In September, Coachella Valley home sales were 33.7% below historic September normal home sales (compared to homes sales 32.2% below historic September normal home sales in September 2025). Historic norms are calculated from average sales for the month of September in 2016, 2017, 2018 and 2019.
COACHELLA VALLEY SEPTEMBER DETACHED HOME MEDIAN PRICE
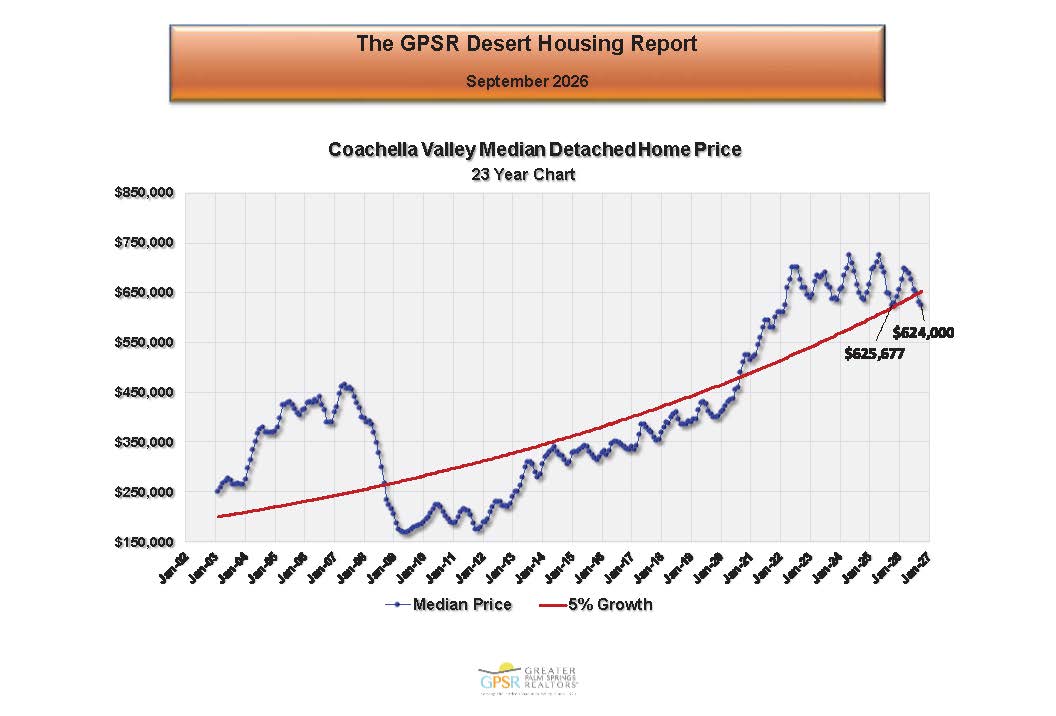 The median price of a detached home in the Coachella Valley ended September at $624,000 (down 0.3% from a detached home median price of $625,677 in September 2025). Market Watch’s analysis contained two observations: (i) detached home median prices usually reach their seasonal low in autumn and their high in spring, and (ii) detached homes in the Coachella Valley have generally maintained the price gains achieved during the pandemic.
COACHELLA VALLEY SEPTEMBER ATTACHED HOME MEDIAN PRICE
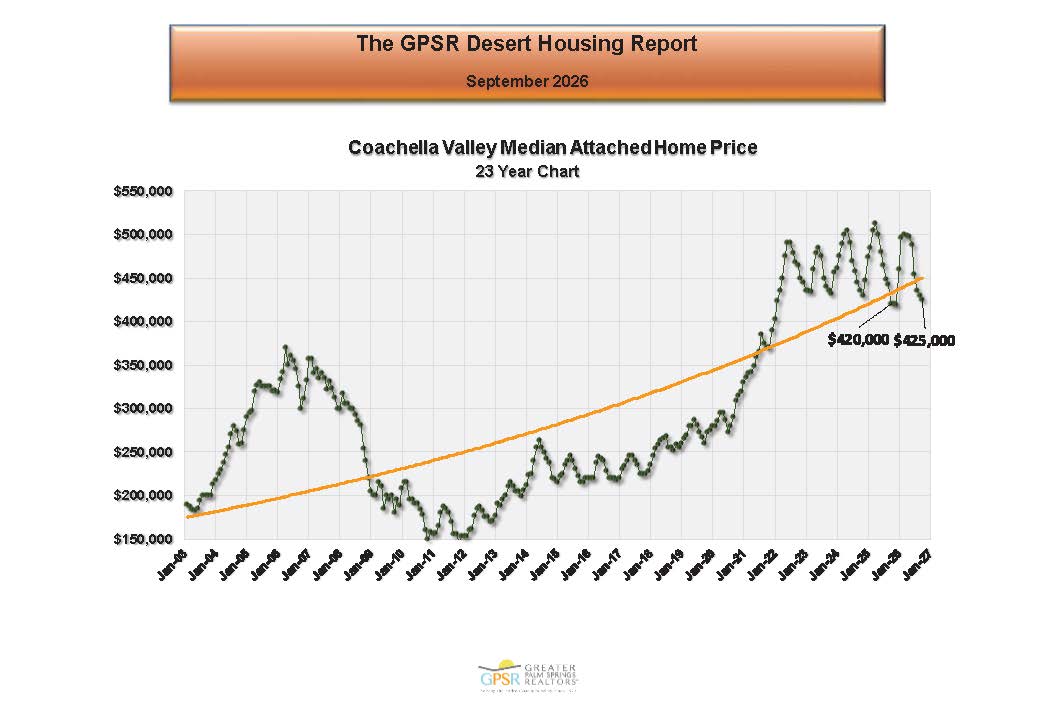
The median price of an attached home ended September at $425,000 (up 1.2% from an attached home median price of $420,000 in September 2025). Market Watch’s analysis noted that attached home median prices show a wider seasonal range than detached home prices but generally follow the same seasonal pattern.
COACHELLA VALLEY SEPTEMBER YEAR-OVER-YEAR CHANGES IN AVERAGE SIZE HOME PRICES BY CITY
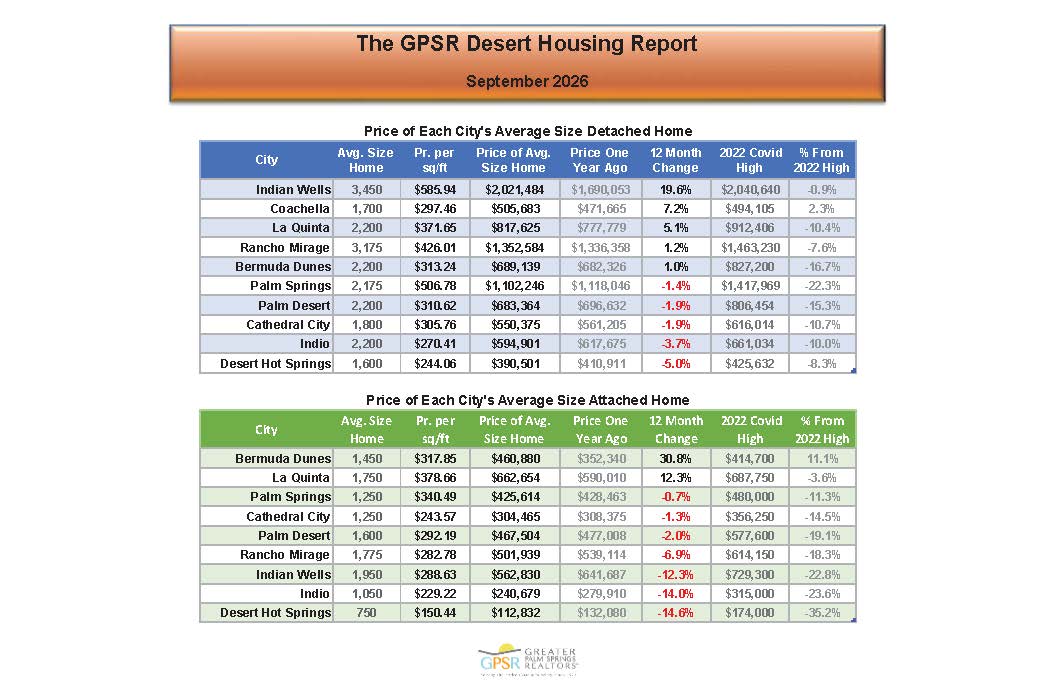
September, year-over-year changes in the price of the average size detached home in the Coachella Valley ranged from a 19.6% increase in Indian Wells to a 5.0% decrease in Desert Hot Springs. In September, the median price of the 3,450 sq ft average size detached home in Indian Wells increased to $2,021,484 from $1,690,053, while the median price of the 1,600 sq ft average size detached home in Desert Hot Springs declined to $390,501 from $410,911. For attached homes, year-over-year changes in the price of the average size attached home in the Coachella Valley ranged from a 30.8% increase in Bermuda Dunes to a 14.6% decrease in Desert Hot Springs. In September, the median price of the 1,450 sq ft average size attached home in Bermuda Dunes increased to $460,880 from $352,340, while the median price of the 750 sq ft average size attached home in Desert Hot Springs declined to $112,832 from $132,080.
COACHELLA VALLEY SEPTEMBER AVERAGE MONTHLY HOME SALES (THREE MONTH AVERAGE)
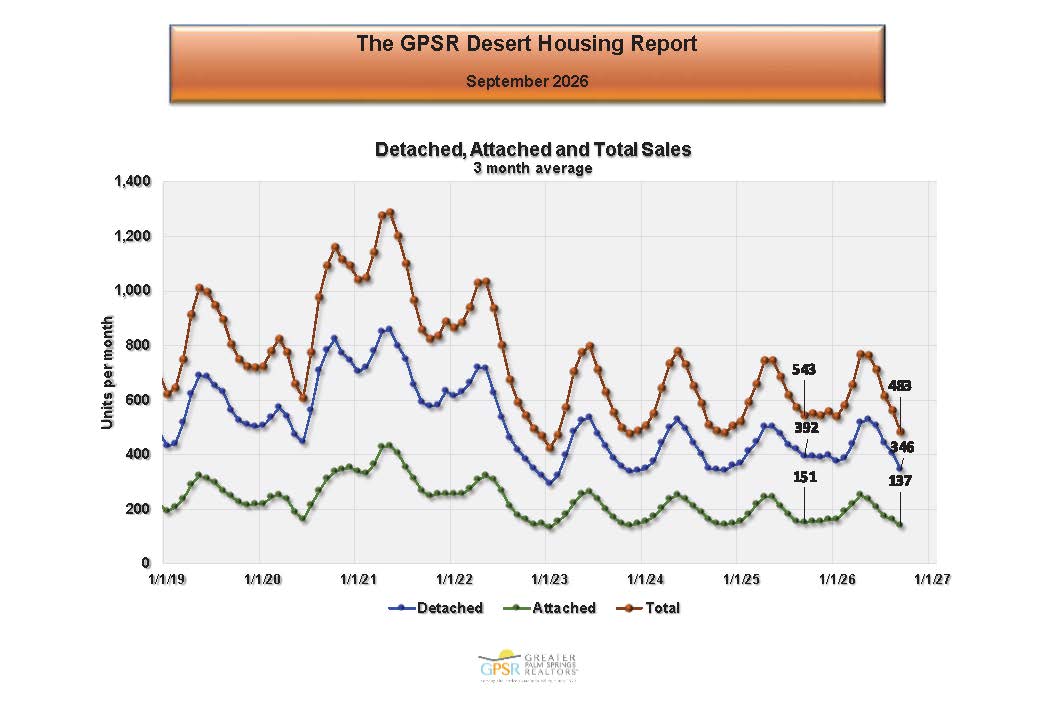 The three-month average of total Coachella Valley home sales in September was 483 home sales per month (down 11.0% from 543 home sales per month in September 2025). Detached home sales averaged 346 per month (down 11.7% from 392 home sales per month in September 2025). Attached home sales averaged 137 per month (down 9.3% from 151 home sales per month in September 2025).
COACHELLA VALLEY SEPTEMBER AVERAGE MONTHLY HOME SALES (TWELVE MONTH AVERAGE)
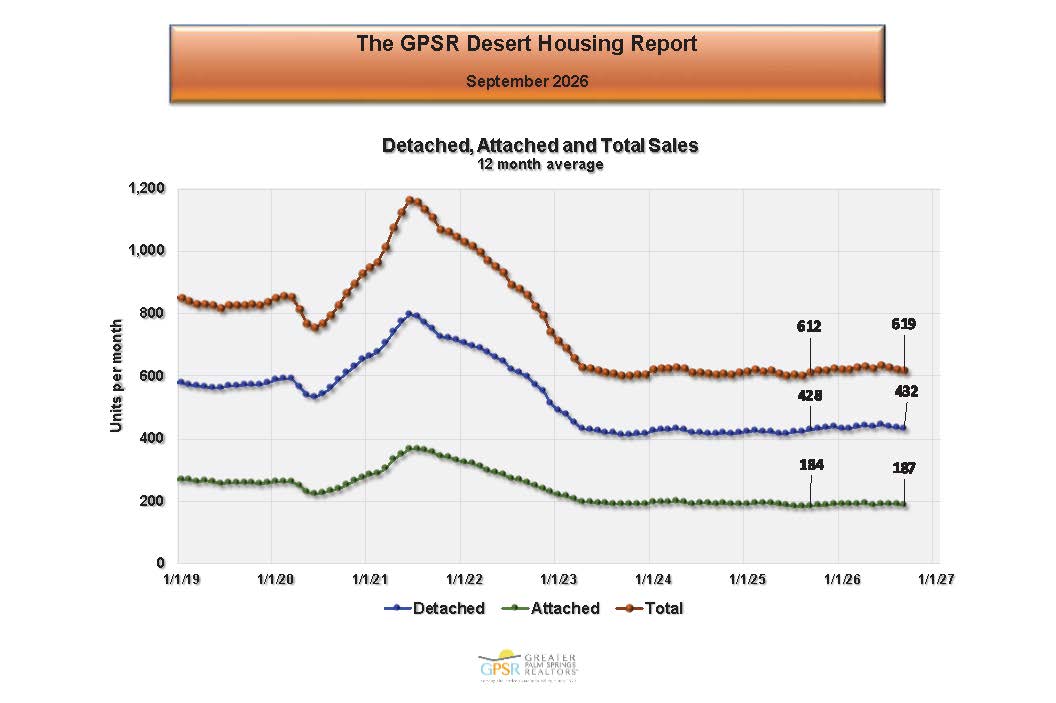 The twelve-month average of monthly Coachella Valley home sales in September, which removes seasonality from the Coachella Valley home sales data, was 619 homes per month (up 1.1% from 612 home sales per month in September 2025). Detached home average monthly home sales averaged 432 per month (up 0.9% from 428 home sales per month in September 2025). Attached home sales averaged 187 per month (up 1.6% from 184 home sales per month in September 2025).
COACHELLA VALLEY SEPTEMBER MONTHLY HOME SALES BY CITY
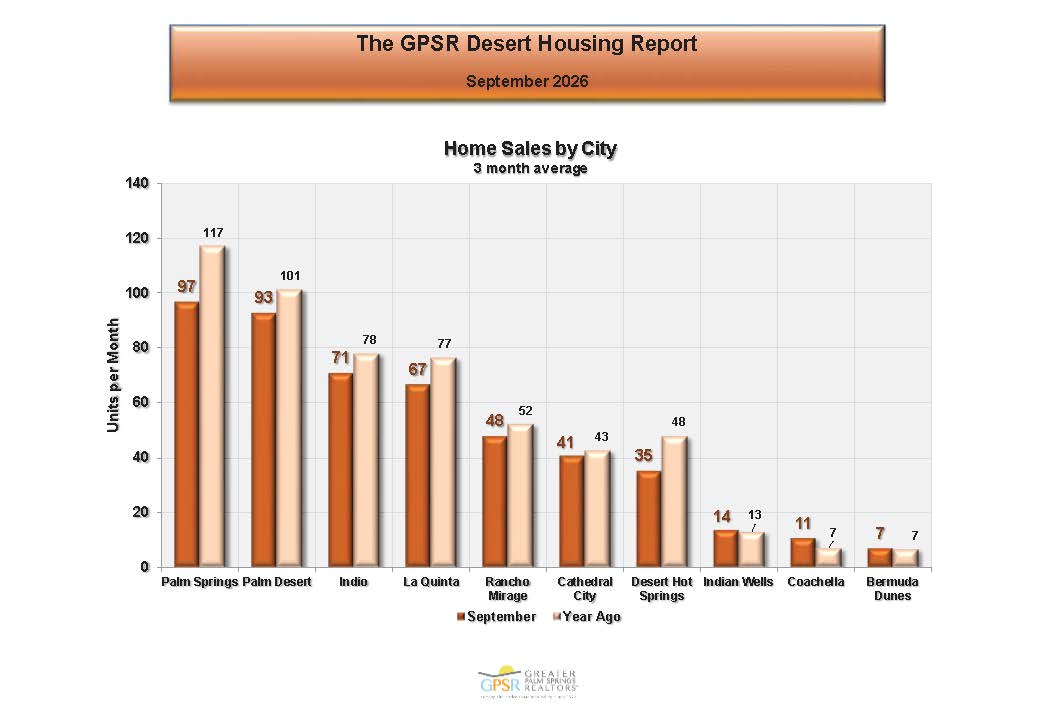 In September, Palm Springs had the highest monthly home sales in the Coachella Valley at 97 (down 17.1% from 117 monthly home sales in September 2025). Palm Desert followed with 93 monthly home sales (down 7.9% from 101 monthly home sales in September 2025), then Indio with 71 monthly home sales (down 9% from 78 monthly home sales in September 2025). Bermuda Dunes had the lowest average monthly sales at 7 homes (unchanged from September 2025).
COACHELLA VALLEY SEPTEMBER MONTHLY HOME SALES BY PRICE RANGE
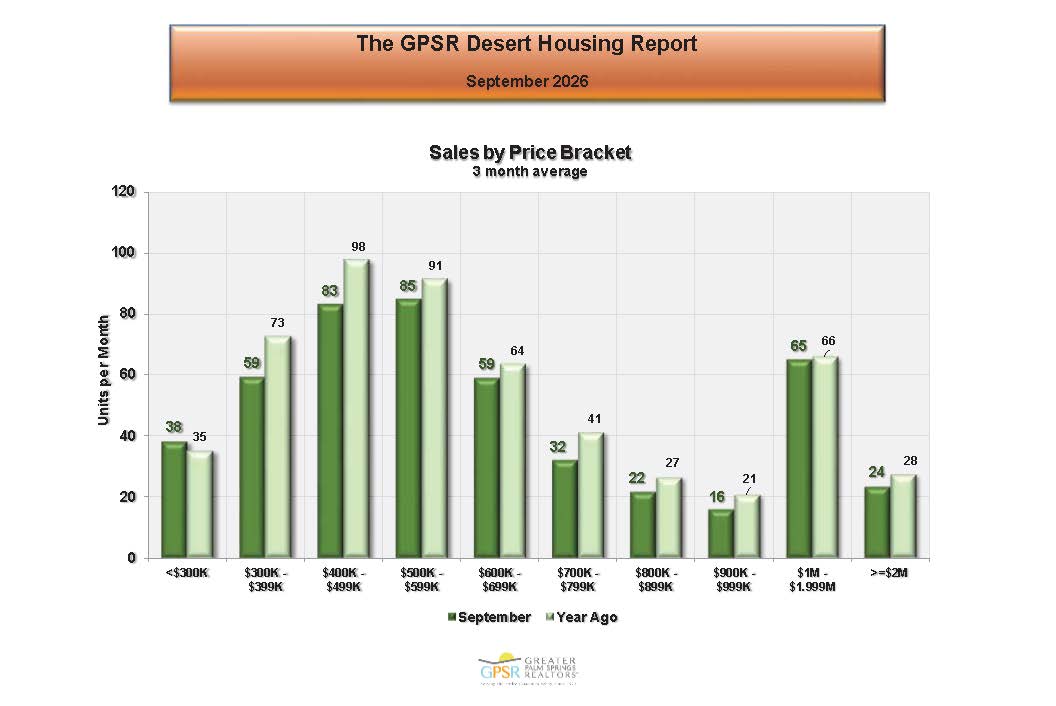
In September, Coachella Valley homes priced between $500,000 and $599,999 had the highest average monthly sales at 85 (down 6.6% from 91 monthly home sales in September 2025). Homes priced between $400,000 and $499,999 followed with 83 average monthly home sales (down 15.3% from 98 average monthly home sales in September 2025). The lowest average monthly home sales were in the $900,000 to $999,999 range at 16 (down 23.8% from 21 average monthly home sales in September 2025).
COACHELLA VALLEY SEPTEMBER MONTHLY HOME SALES IN DOLLARS
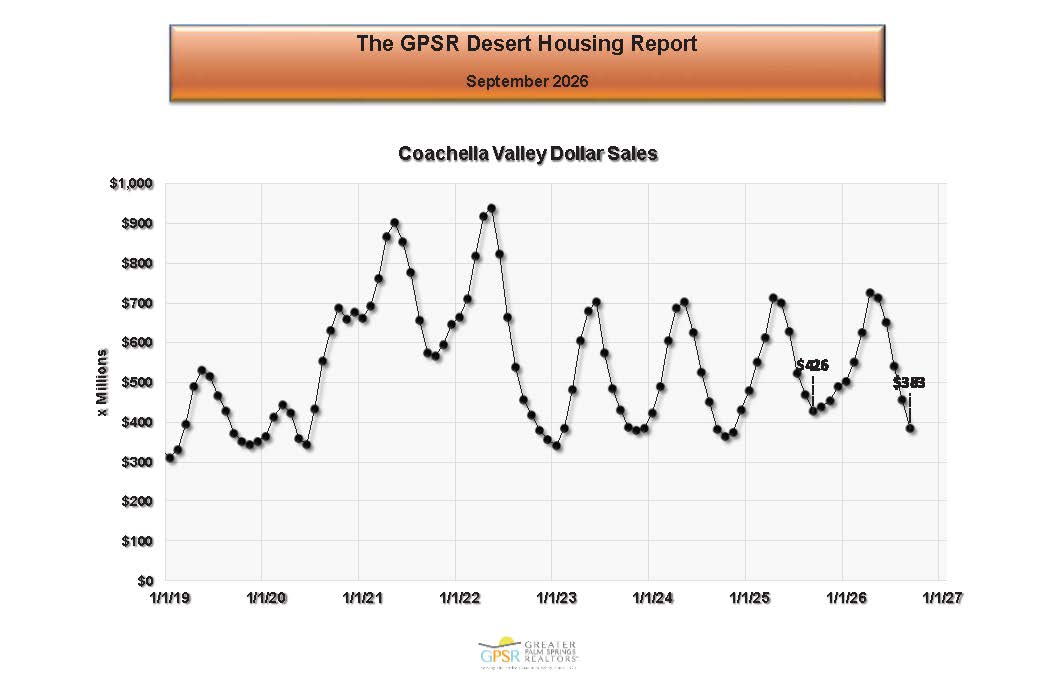 Coachella Valley home sales averaged $383 million in September (down 10.1% from $426 million in September 2025).
COACHELLA VALLEY SEPTEMBER MONTHLY HOME SALES IN DOLLARS BY CITY
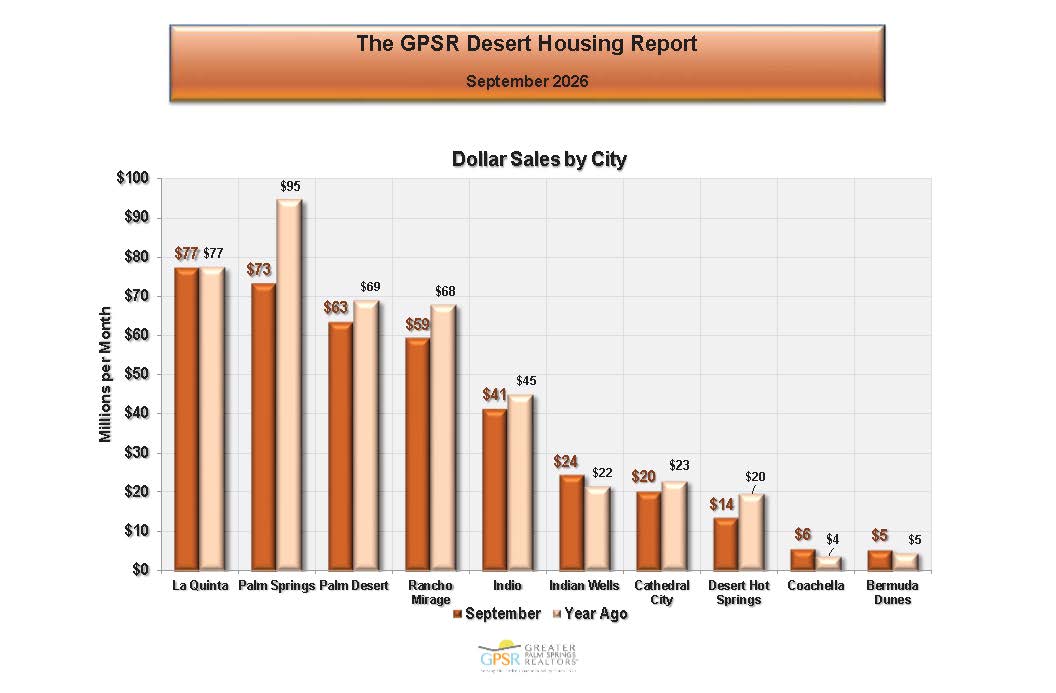
In September, La Quinta had the highest average monthly home sales in dollars in the Coachella Valley at $77 million (the same as in September 2025), followed by Palm Springs at $73.0 million (down 23.2% from $95 million in September 2025) and Palm Desert at $63 million (down 8.7% from $69 million in September 2025). Bermuda Dunes had the lowest average monthly home sales in dollars at approximately $5 million (the same as in September 2025).
COACHELLA VALLEY SEPTEMBER MONTHLY HOME SALES IN DOLLARS BY PRICE RANGE
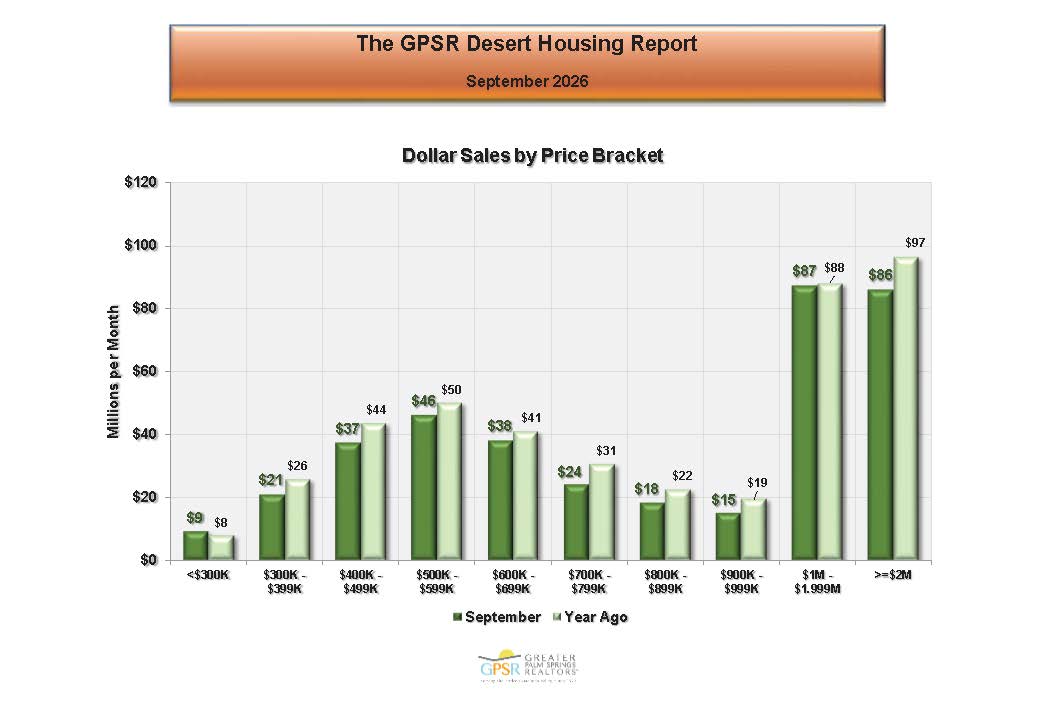
In September, Coachella Valley homes priced between $1 million and $1.999 million generated the highest average monthly home sales in dollars at $87 million (down slightly from home sales of $88 million in September 2025). Homes priced at or over $2 million followed with sales of $86 million (down 11.3% from sales of $97 million in September 2025). Market Watch’s analysis pointed out that home sales in these two price ranges accounted for 45.3% of all home sales in the Coachella Valley. Homes priced under $300,000 had the lowest average monthly home sales in dollars at approximately $9 million (up slightly from home sales of $8 million in September 2025).
COACHELLA VALLEY OCTOBER 1st TOTAL HOME INVENTORY
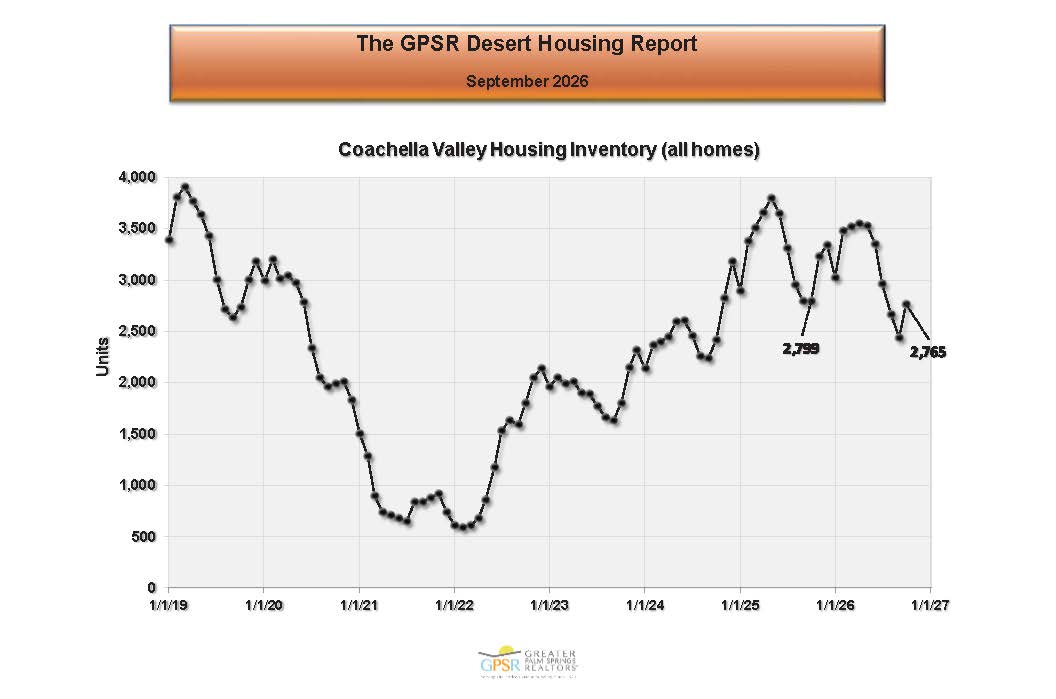
At the end of September, the combined inventory of detached and attached homes in the Coachella Valley was 2,765 homes (down 34 homes or 1.2% from 2,799 homes on October 1st, 2025). Market Watch’s analysis noted that inventory has grown since 2022 and is now comparable to pre-pandemic levels. It also noted that inventory typically peaks in March and April and reaches its seasonal low in late summer.
COACHELLA VALLEY OCTOBER 1st TOTAL HOME INVENTORY BY CITY
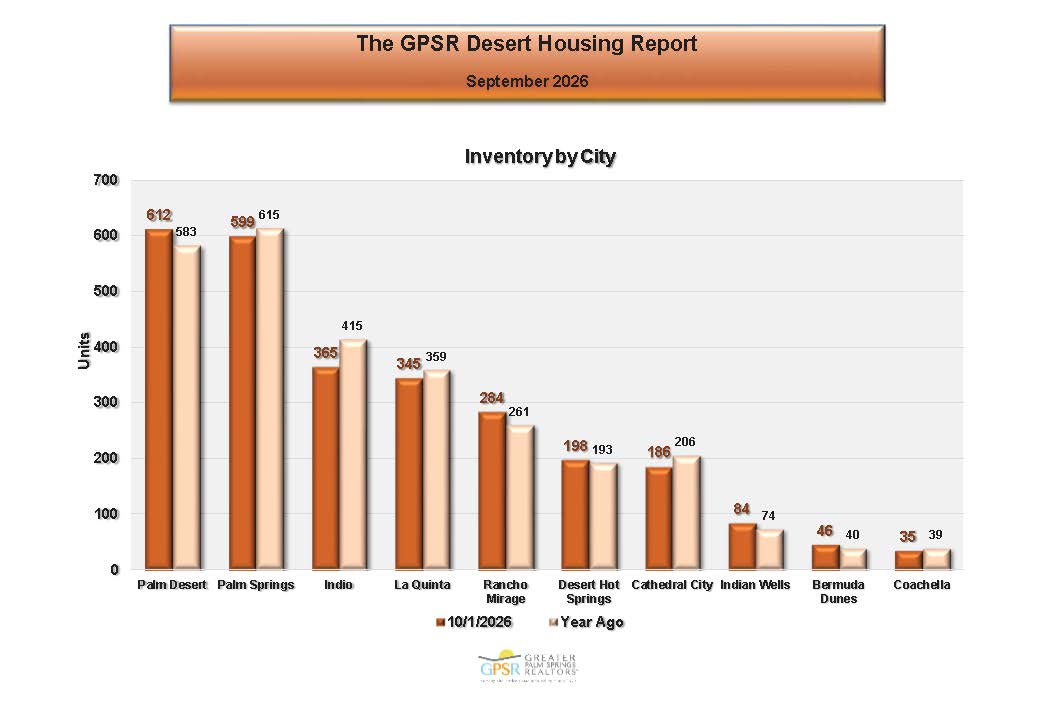
On October 1st, Palm Desert had the largest inventory at 612 homes (up 5% from 583 homes on October 1st, 2025). Palm Springs followed with 599 homes (down 2.6% from 615 homes on October 1st, 2025). Coachella had the lowest inventory at 35 homes (down 10.3% from 39 homes on October 1st, 2025).
COACHELLA VALLEY OCTOBER 1st TOTAL HOME INVENTORY BY PRICE RANGE
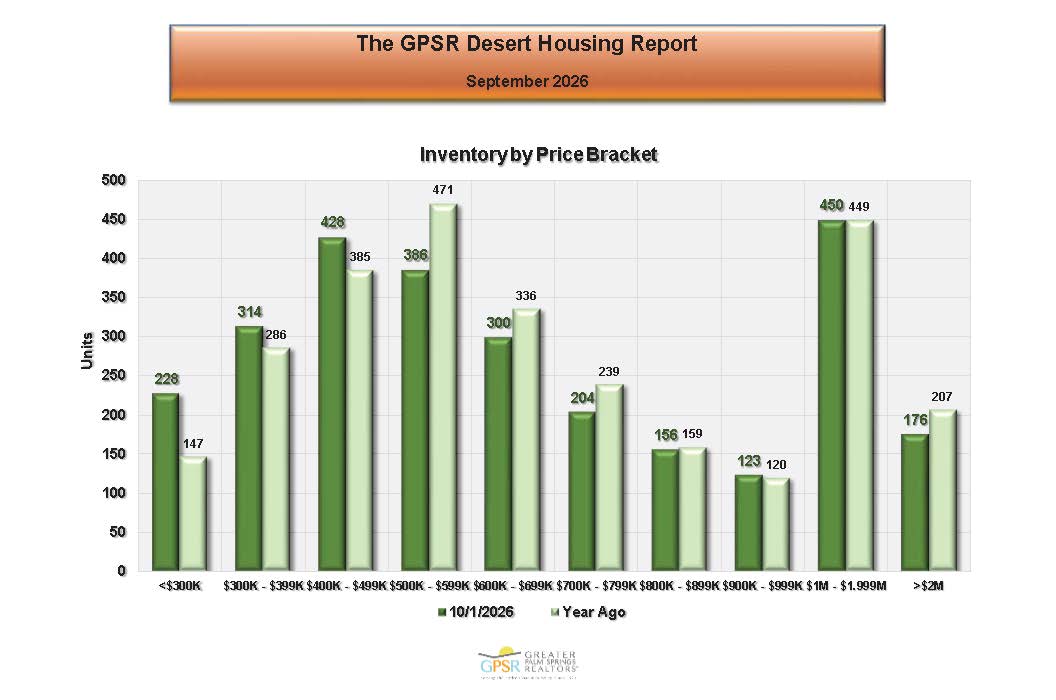 In September, the highest inventory in the Coachella Valley was in the $1 million to $1.999 million range at 450 homes (up slightly from 449 homes on October 1st, 2025). Homes priced between $400,000 and $499,999 followed at 428 homes (up 11.2% from 385 homes on October 1st, 2025). The lowest inventory was in the $900,000 to $999,999 range at 123 homes (up 2.5% from 120 homes on October 1st, 2025).
COACHELLA VALLEY OCTOBER 1st MONTHS OF SALES RATIO
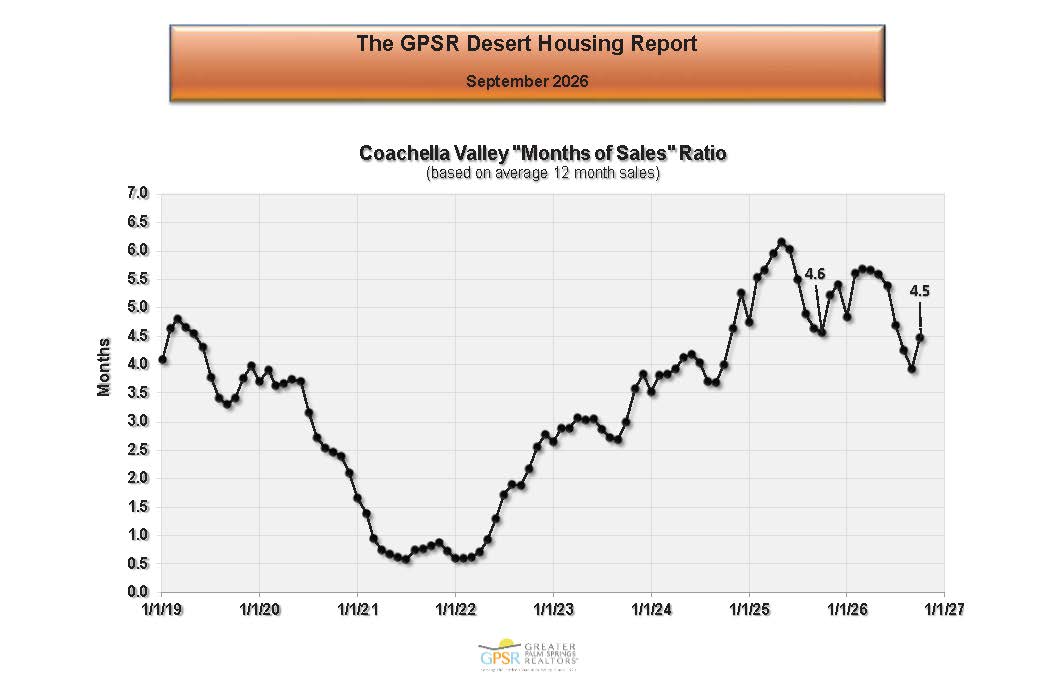
The Coachella Valley’s months of sales ratio on October 1st was 4.5 months (compared with 4.6 months October 1st, 2025). Market Watch’s analysis described a regional months of sales ratio below 6.0 months as balanced, while noting that supply is above pre-pandemic levels relative to demand. It cautioned that negative price pressure could increase if selling times begin to lengthen.
COACHELLA VALLEY OCTOBER 1st MONTHS OF SALES RATIO BY CITY
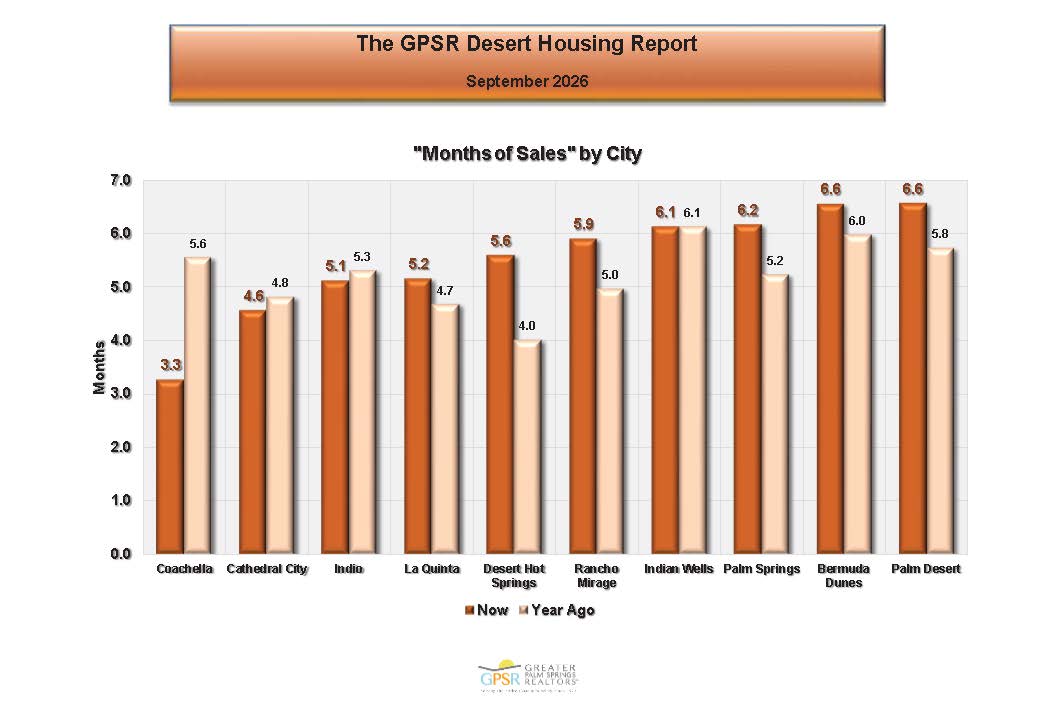
On October 1st, Palm Desert had the highest months of sales ratio at 6.6 months (up from 5.8 months on October 1st, 2025). Bermuda Dunes also recorded a months of sales ratio of 6.6 months (up from 6 months on October 1st, 2025). Coachella had the lowest months of sales ratio at 3.3 months (down from 5.6 months on October 1st, 2025).
COACHELLA VALLEY OCTOBER 1st MONTHS OF SALES RATIO BY PRICE RANGE
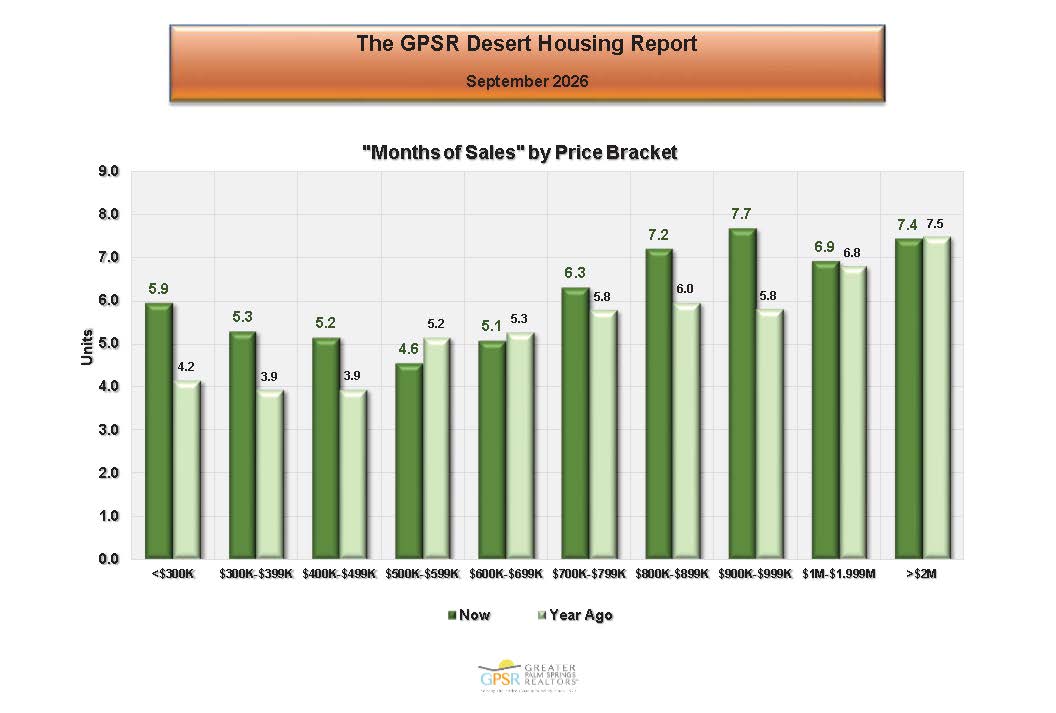
In September, the Coachella Valley’s highest months of sales ratio was 7.7 months for homes priced between $900,000 and $999,99 (up from 5.8 months on October 1st, 2025). The lowest months of sales ratio was 4.6 months for homes priced between $500,000 to $599,999 (down from 5.2 months on October 1st, 2025).
COACHELLA VALLEY SEPTEMBER DAYS IN THE MARKET
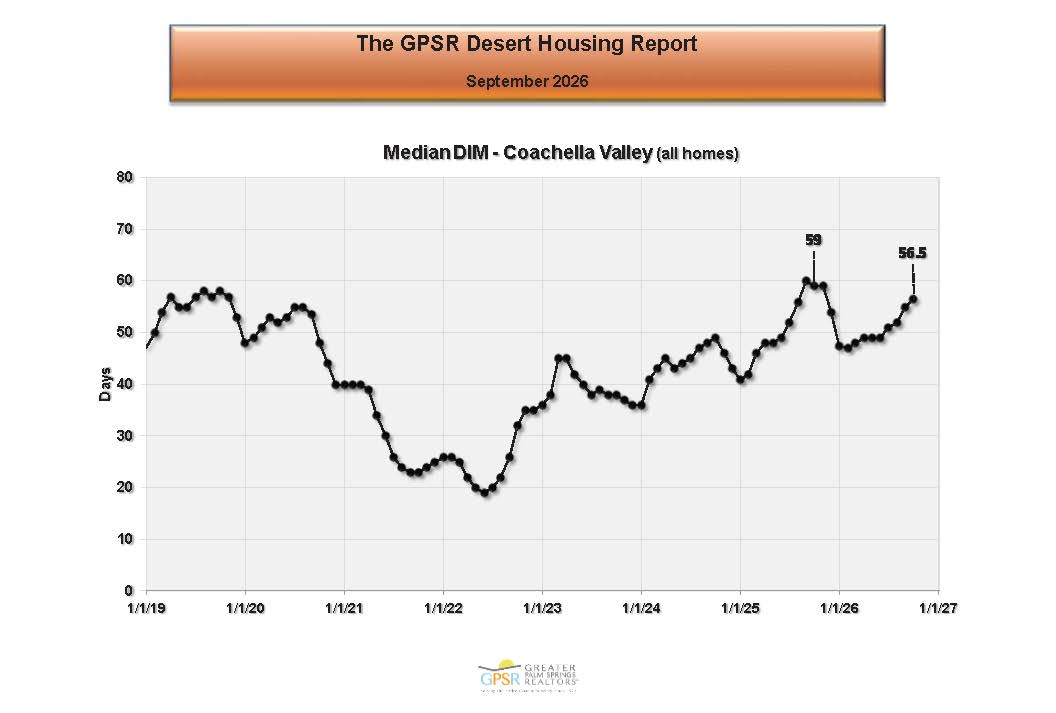
At the end of September, the regional median selling time in the Coachella Valley was 56.5 days (down from 59 days in September 2025). Market Watch’s analysis noted that the Coachella Valley’s selling times have generally remained between 40 and 60 days for more than three years.
COACHELLA VALLEY SEPTEMBER DAYS IN THE MARKET BY CITY
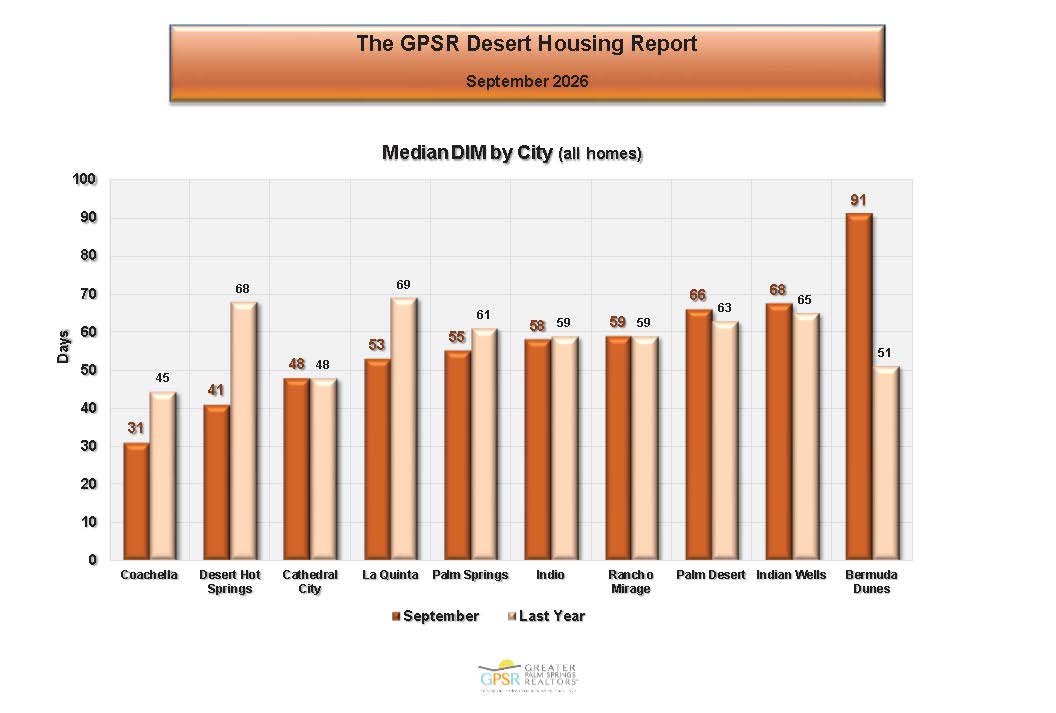
In September, Coachella had the shortest median selling time at 31 days (down from 45 days in September 2025). Desert Hot Springs followed at 41 days (down from 68 days in September 2025). Bermuda Dunes had the longest median selling time at 91 days (up from 51 days in September 2025).
COACHELLA VALLEY SEPTEMBER DAYS IN THE MARKET BY PRICE RANGE
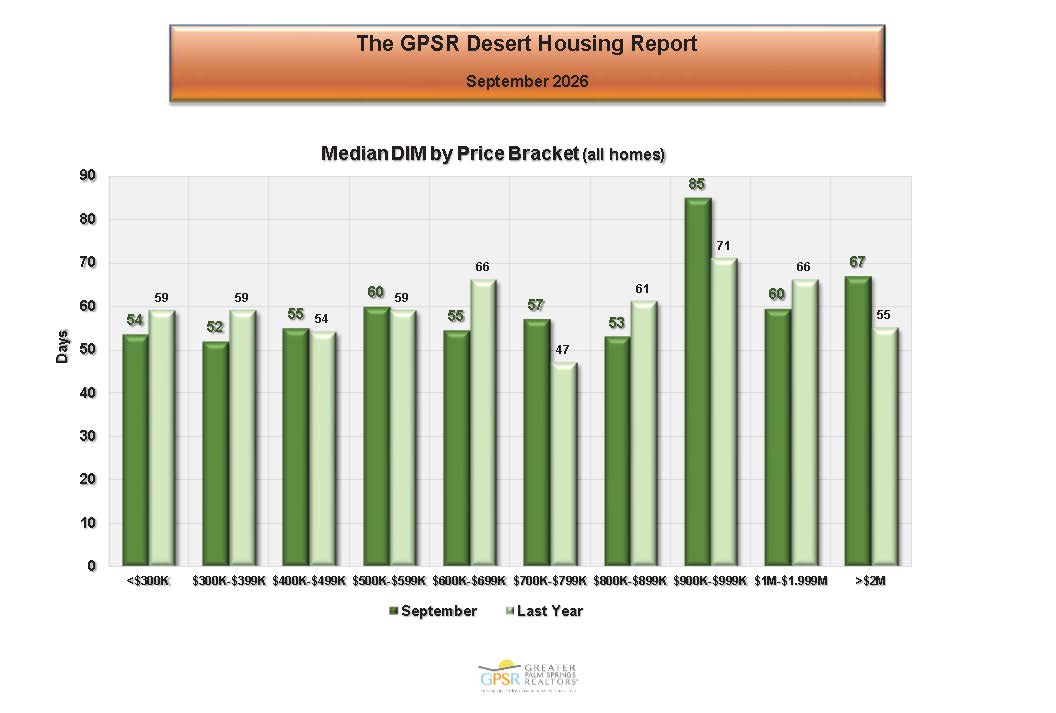
The shortest median selling time was 52 days for homes priced between $300,000 and $399,999 (down from 59 days in September 2025). The longest median selling time was 85 days for homes priced between $900,000 and $999,999 (up from 71 days in September 2025). Market Watch’s analysis noted that selling times in the Coachella Valley did not consistently increase with higher prices, which was viewed as a positive sign.
COACHELLA VALLEY SEPTEMBER AVERAGE PRICE PREMIUM OR DISCOUNT FROM LIST PRICE
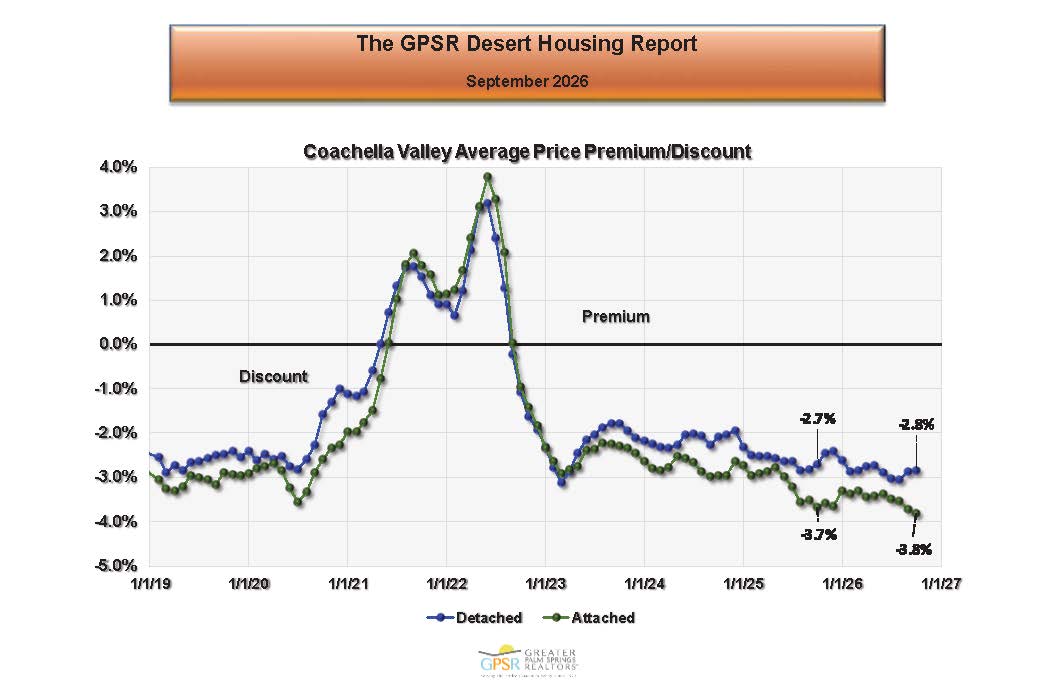
In September, detached homes in the Coachella Valley sold at an average discount of 2.8% from list price (up from 2.7% in September 2025). Attached homes sold at an average discount of 3.8% (up from 3.7% in September 2025). Market Watch’s analysis noted that these discounts have returned to pre-pandemic norms.
COACHELLA VALLEY SEPTEMBER AVERAGE PRICE PREMIUM OR DISCOUNT FROM LIST PRICE BY CITY
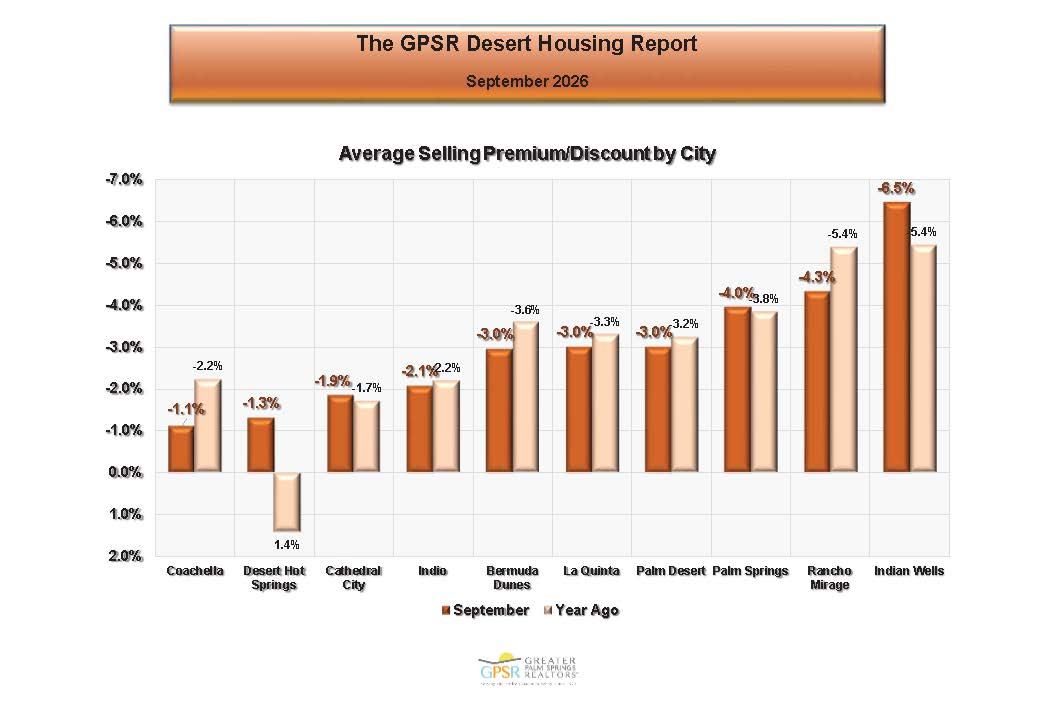
For the Coachella Valley in September, Coachella had the smallest average discount from list price at 1.1% (down from 2.2% in September 2025). Indian Wells had the largest average discount from list price at 6.5% (up from 5.4% in September 2025).
COACHELLA VALLEY SEPTEMBER AVERAGE PRICE PREMIUM OR DISCOUNT FROM LIST PRICE BY PRICE RANGE
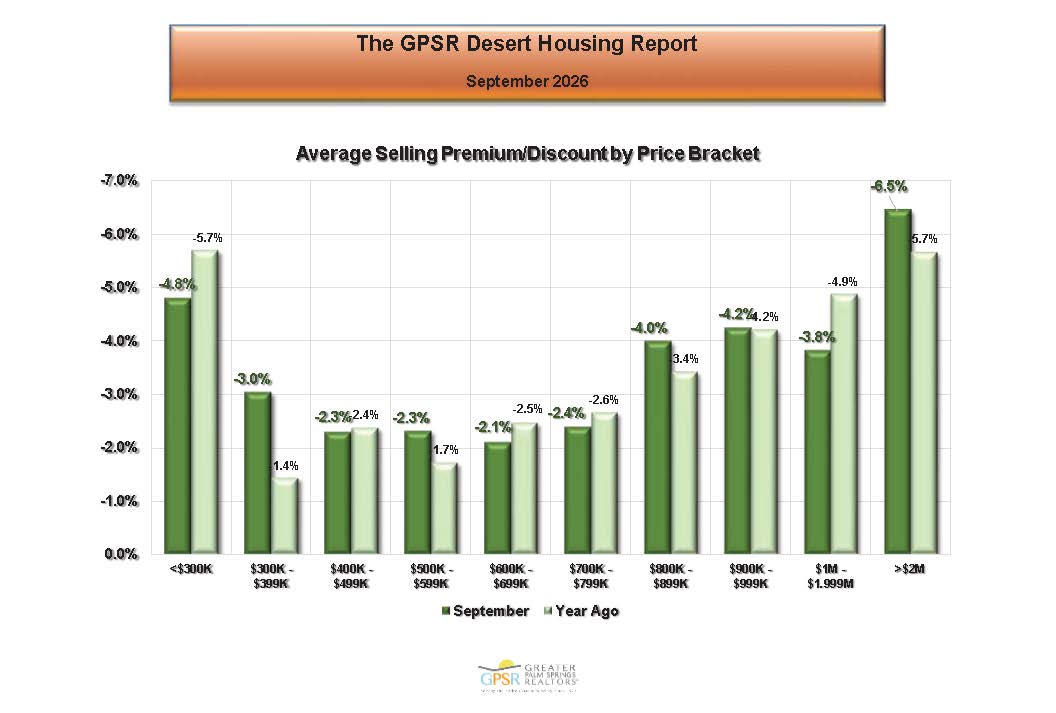
In September, the smallest average discount in the Coachella Valley was 2.1% for homes priced between $600,000 and $699,999 (down from 2.5% in September 2025). The largest average discount was 6.5% for homes priced at or over $2 million (up from 5.7% in September 2025).
COACHELLA VALLEY SEPTEMBER PERCENTAGE OF HOMES SELLING ABOVE LIST PRICE
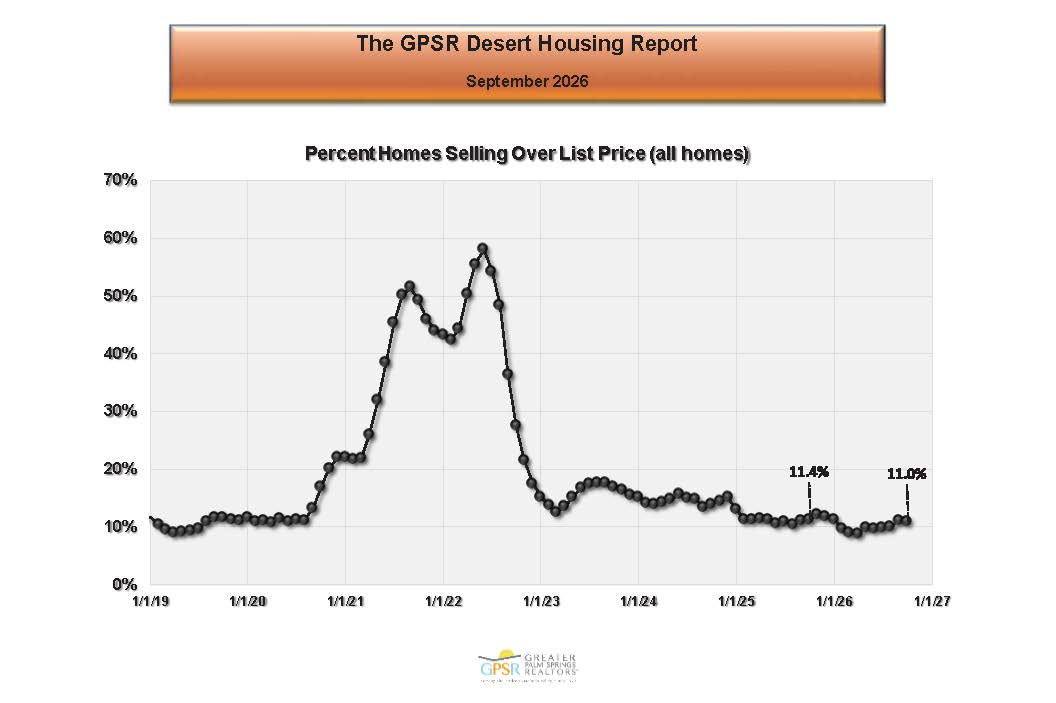
In September, 11.0% of Coachella Valley homes sold above list price (compared with 11.4% in September 2025). Market Watch’s analysis noted that this measure has returned to pre-pandemic levels.
THE BRIGGS GROUP | COLDWELL BANKER | Laurie Briggs - DRE# 01896117 | Tim Briggs - DRE# 01898254 | Coldwell Banker Realty - DRE# 00616212