

(Please click on the image above to view our short YouTube video)
Our local real estate market experts Market Watch LLC have just released their COVID-19 Desert Housing Report which examines the impact of the Coronavirus pandemic on our local residential real estate market. This analysis is done using short term metrics (primarily 28 day moving averages) that reveal changing market conditions on a daily basis. Some highlights:
 To show how well the Coachella Valley housing market is doing compared to other regions, Market Watch monitored closed and pending sales in Los Angeles and Orange Counties. Because average escrow times in these two counties are between 30 to 35 days, Market Watch explained that by moving pending and active under contract sales forward by 35 days, pending and active under contract sales become a tremendous forecasting tool for closed sales in these two counties. They also noted that the 3 month surge in sales in Los Angeles County, which began in June, is continuing. Pending and active under contract sales in Los Angeles County were averaging 211 units per day in September (up 40% from 151 units per day one year ago). Market Watch predicts that average daily home sales will remain around current levels.
 Market Watch commented that Orange County is showing almost an identical recovery pattern to Los Angeles County. In Orange County average daily pending and active under contract sales were 106 units per day in September (up 47% from 72 units per day one year ago). Average daily closed sales of 102 units per day in September were 26% higher than the average daily closed sales of 81 units per day one year ago.
 Since Coachella Valley escrow times for single-family residences average 20 days, pending and active under contract sales are moved forward 20 days to predict closed sales. In September daily pending and active under contract sales of single-family residences averaged 25.8 units a day (up 50% from 17.2 units per day one year ago). Market Watch felt that just like in Orange and LA Counties, sales of single-family residences in the Coachella Valley appear to be flattening out at current high levels.
 Pending and active under contract sales of condos in the Coachella valley in September averaged 10.8 units a day (up 30% from 8.3 units per day one year ago). Market Watch predicted that closed condo sales, which averaged 9.9 units a day in September, will continue to increase over the next three weeks.
 This set of tables shows average pending and active under contract sales per week over the last four weeks for single-family residences, condominiums and all homes in the nine regional Coachella valley cities. Market Watch noted that in Indian Wells total pending and active under contract sales of 11.5 homes per week at the end of September were up 109.1% year-over-year, in Rancho Mirage total pending and active under contract home sales of 28.5 units per week were up 83.9% year-over-year and in Palm Springs total pending and active under contract sales of 55.3 homes per week were up 74% year-over-year.
 The daily average price per square foot for single-family residences in the Coachella valley stood at $273 per sq ft at the end of September (up 18.8% from $229 one year ago). The daily average price per square foot for condos in the Coachella valley stood at $228 per sq ft at the end of September (up 11.6% from $205 one year ago).
 At the end of September, the average price per square foot for single-family residences had increased year-over-year by double digits in Palm Springs (up 34.3%), La Quinta (up 22.2%), Desert Hot Springs (up 21.1%), Indio (up 14.3%), Palm Desert (up 12.6%) and Indian Wells (up 10.7%). The average price per square foot for condos increased year-over-year by double digits in Indian Wells (up 22.2%), Indio (up 21.3%) and Palm Springs (up 19.6%).
 The total Coachella Valley housing inventory on October 1st was 1,982 units (compared to 2,727 units on October 1st, 2019). The Coachella Valley’s housing inventory has fallen more than one thousand units since the beginning of California’s March 19th stay at home order. Market Watch predicted that seasonal pressures should begin to raise inventory numbers as we move into October and November. They noted that this low inventory level has been putting strong upward pressure on home prices throughout the Coachella Valley.
 This graphic shows average daily new listings and the average sum of cancelled and expired listings for the Coachella Valley for both single-family residences and condominiums. Market Watch commented that historically there is a natural fall off in average daily new listings between Thanksgiving and the third week of January. The average number of daily new listings fell in September from 39 at the start of the month to 29 at the end of the month, which Market Watch felt was one reason why inventory did not rise much in September.
 The average number of days in the market for single-family residences in the Coachella Valley in September was 66 days (compared to 91 days in September 2019). The average number of days in the market for condominiums in the Coachella Valley went from 81 days in September 2019 to 67 days this past September.
 Price discounts for both single-family residences and condos have been decreasing over the last three months. The average discount of 1.1% for single-family residences in September was the smallest discount in the last ten years. Market Watch noted that this was another powerful sign that the Coachella Valley housing market is highly favorable for home sellers.

CalDRE 01898254 | 01896117 | 01991628
 Local real estate experts Market Watch LLC have just released their September 2020 Desert Housing Report outlining their take on the state of our local market. Some of the highlights:
 The Coachella Valley detached home median price in September was $510,000 (up 26% year-over-year from $405,000). Market Watch noted that this is the largest percentage price increase since 2012.

 The 3-month average of total home sales was 1,077 units per month in September (32% higher than one year ago and the highest total home sales in recent history). Detached homes sales increased by 34% year-over-year and attached sales increased by 28% year-over-year. Market Watch commented that these sales figures were contrary to the normal seasonal pattern, when sales normally contract during the hot summer months.
 Home sales increased year-over-year from 68 units to 116 units is in Rancho Mirage (an increase of 71%). Home sales also increased by 64% in La Quinta, 38% in Palm Desert and 37% in Palm Springs.
 The largest percentage sales increases year-over-year were in homes priced over $700,000. In the $700,000 to $800,000 price range, sales increased 96% year-over-year. In the million-dollar and over price range, sales increased from an average of 45 units a month In September 2019 to 110 units a month in September 2020 (an increase of 144%).
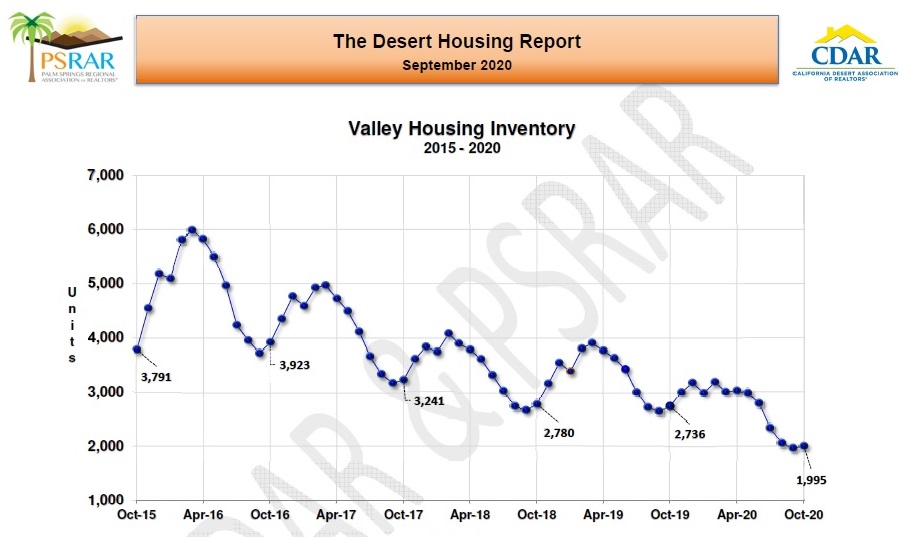 On October 1s, there were only 1,995 units for sale (compared with 2,736 units for sale on October 1st, 2019). Market Watch commented that this low housing inventory coupled with surging demand was driving home prices higher. Based on historical data and trends, they expect our housing inventory to increase over the next four months. However, they also noted that the current large number of homebuyers may keep inventory increases low (as was the case last year).
 The months of sales ratio was at a record low 2.5 months on October 1st. The previous October 1st low was 3.3 months. Market Watch concluded that since the months of sales ratio is really a measurement of demand versus supply, this low ratio of 2.5 months was a mathematical sign that demand far exceeds supply. Market Watch felt that this conclusion was confirmed by the fact that the median number of days in the market was 49 days on October 1st (16 days less than it was on October 1st, 2019).
 The months of sales ratio in every price range was lower than one year ago. The months of sales ration was less than 3 months in every price range under $900,000, indicating to Market Watch that the strong housing market was occurring across the entire price spectrum.
 On October 1st, the months of sales ratio in was under 3 months in Coachella, Desert Hot Springs, Cathedral City, Palm Springs, Indio, Bermuda Dunes, La Quinta and Palm Desert. Market Watch commented that even the higher-priced cities of Rancho Mirage and Indian Wells, which normally have double-digit month of sales ratios, had months of sales ratios of 3.5 months and 5.4 months respectively.
 Lastly, the September median value for sale price discount from list was -1.4% (compared with 1.9% in September 2019). Market Watch expects this trend of smaller discounts to continue until at least the end of the year. The current reading implies that an average home in the region offered at $500,000 sold for $493,000.
 Boston.com recently filled us in on what’s new on Hulu in October:


