.
Address Search

Coachella Valley Market Updates
Our Desert Real Estate Market Experts are out with their May Desert Housing Report. Some of the highlights:
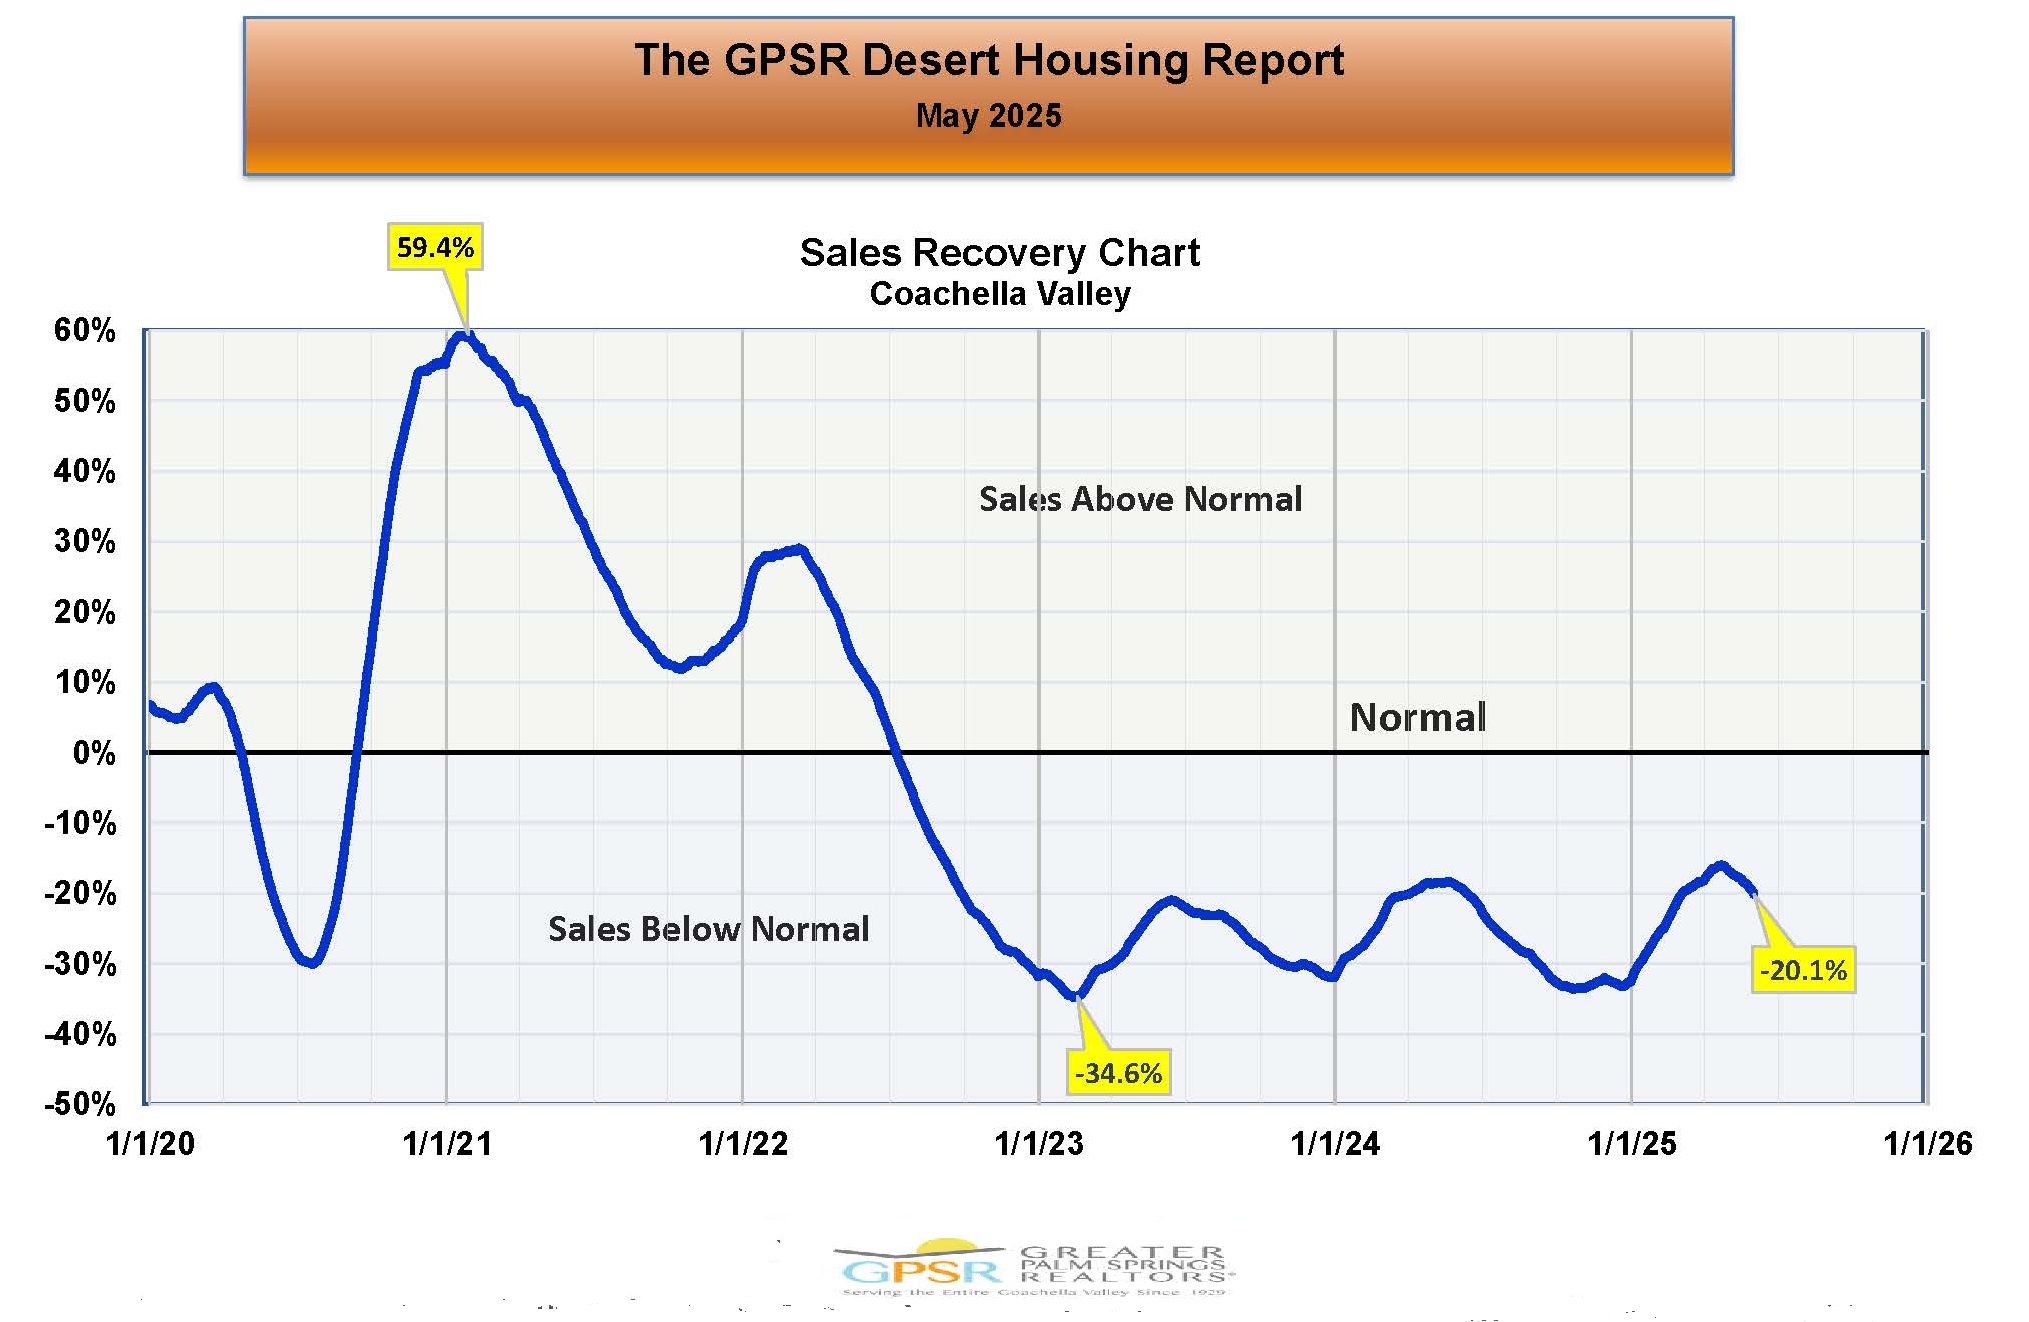 COACHELLA VALLEY MAY HOME SALES RECOVERY: Coachella Valley home sales have been slowly improving and in May they were below the pre-pandemic average (calculated from May home sales in the years 2016, 2017, 2018 and 2019) by 20.1%.
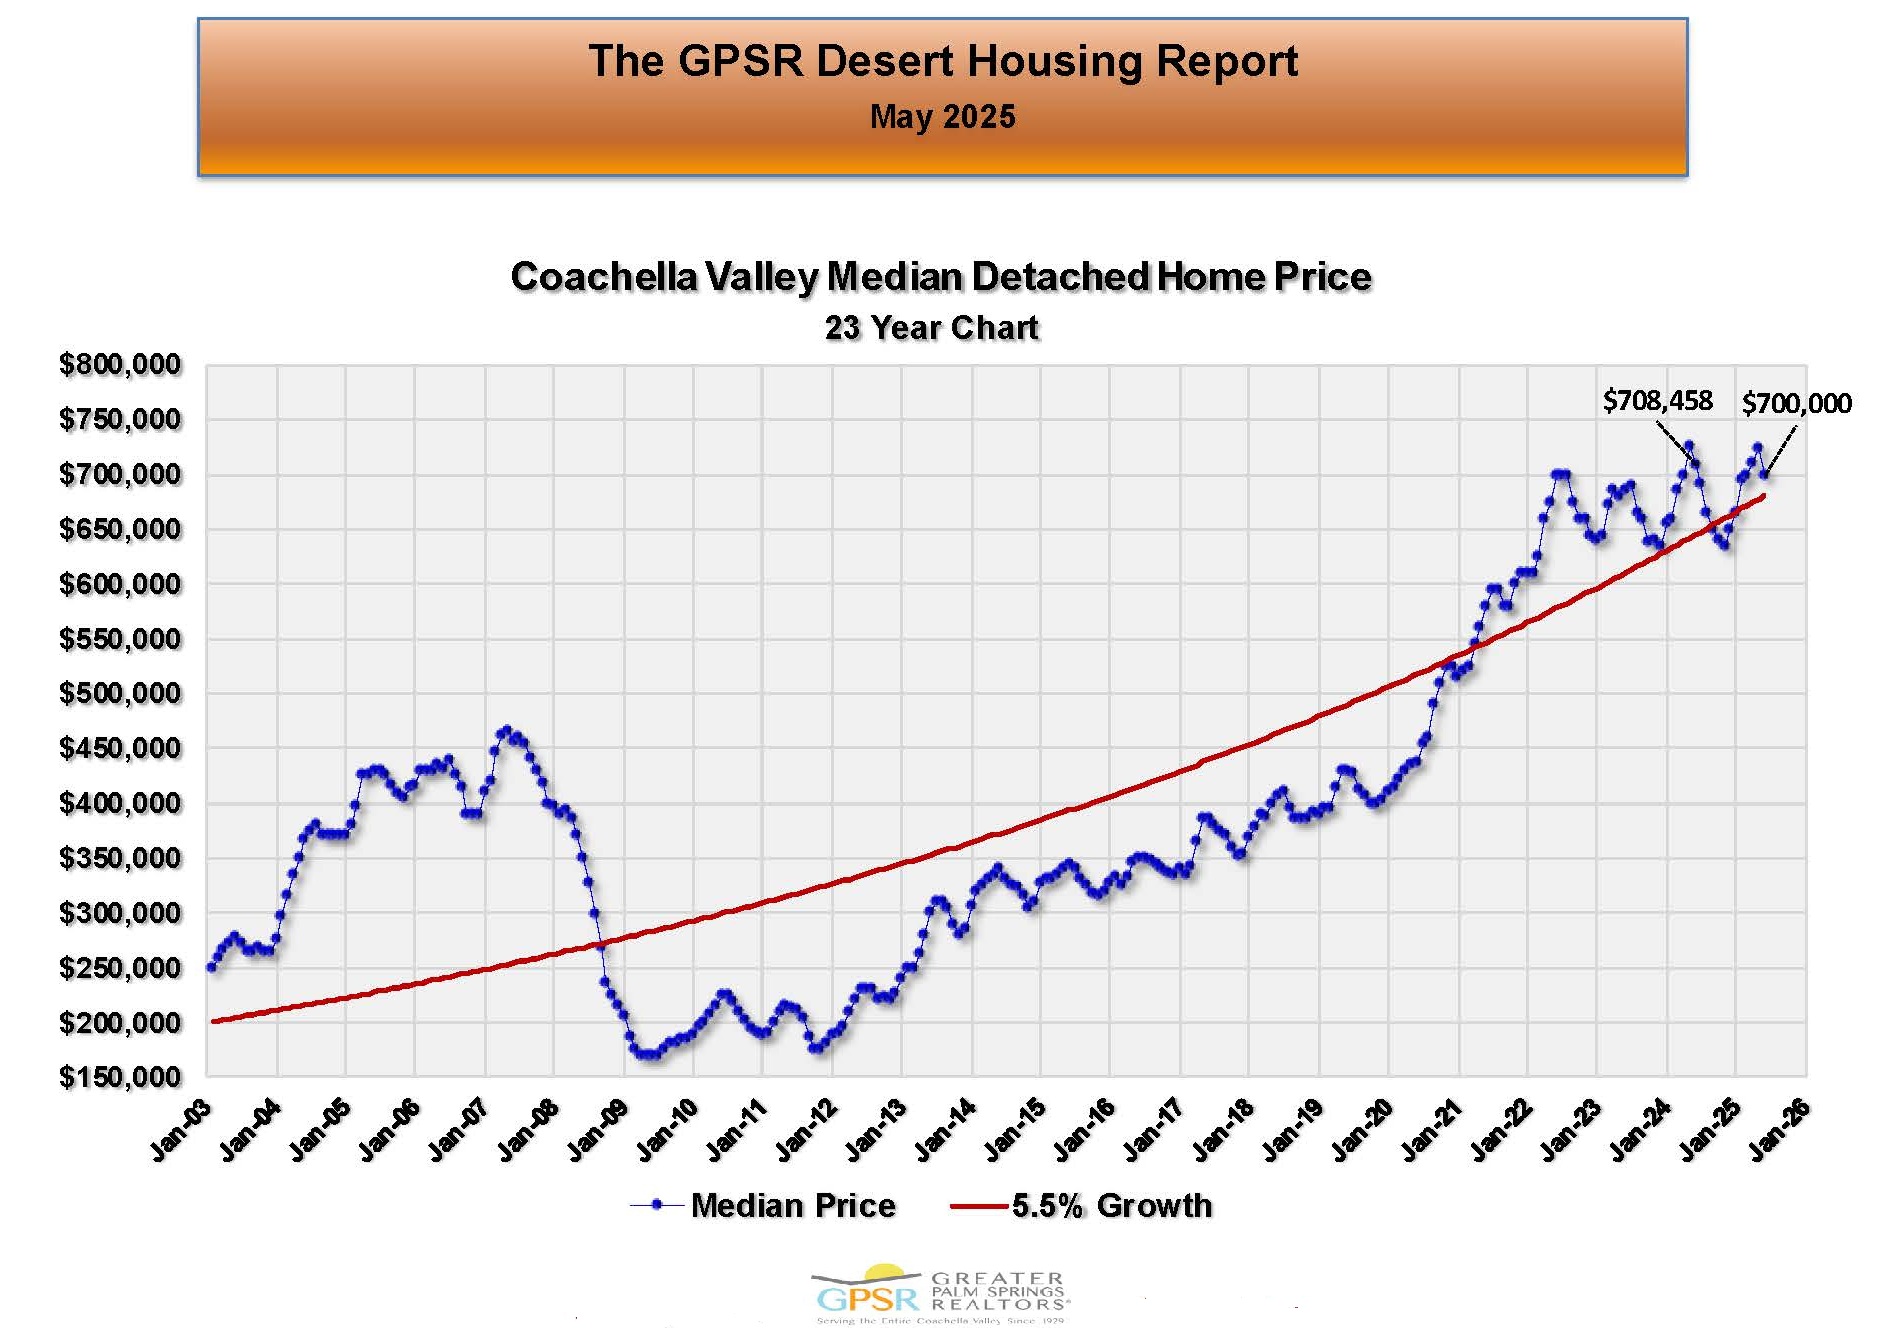 COACHELLA VALLEY MAY DETACHED HOME MEDIAN PRICE: The median price of a detached home in the Coachella Valley at the end of May was $700,000 (down $8,458 or 1.2% from the detached home median price of $708,458 in May 2024). Market Watch commented that the Coachella Valley’s detached home median price usually hits its seasonal low between September and December, and its high in April or May. They also commented that detached homes have held the price gains made during the pandemic.
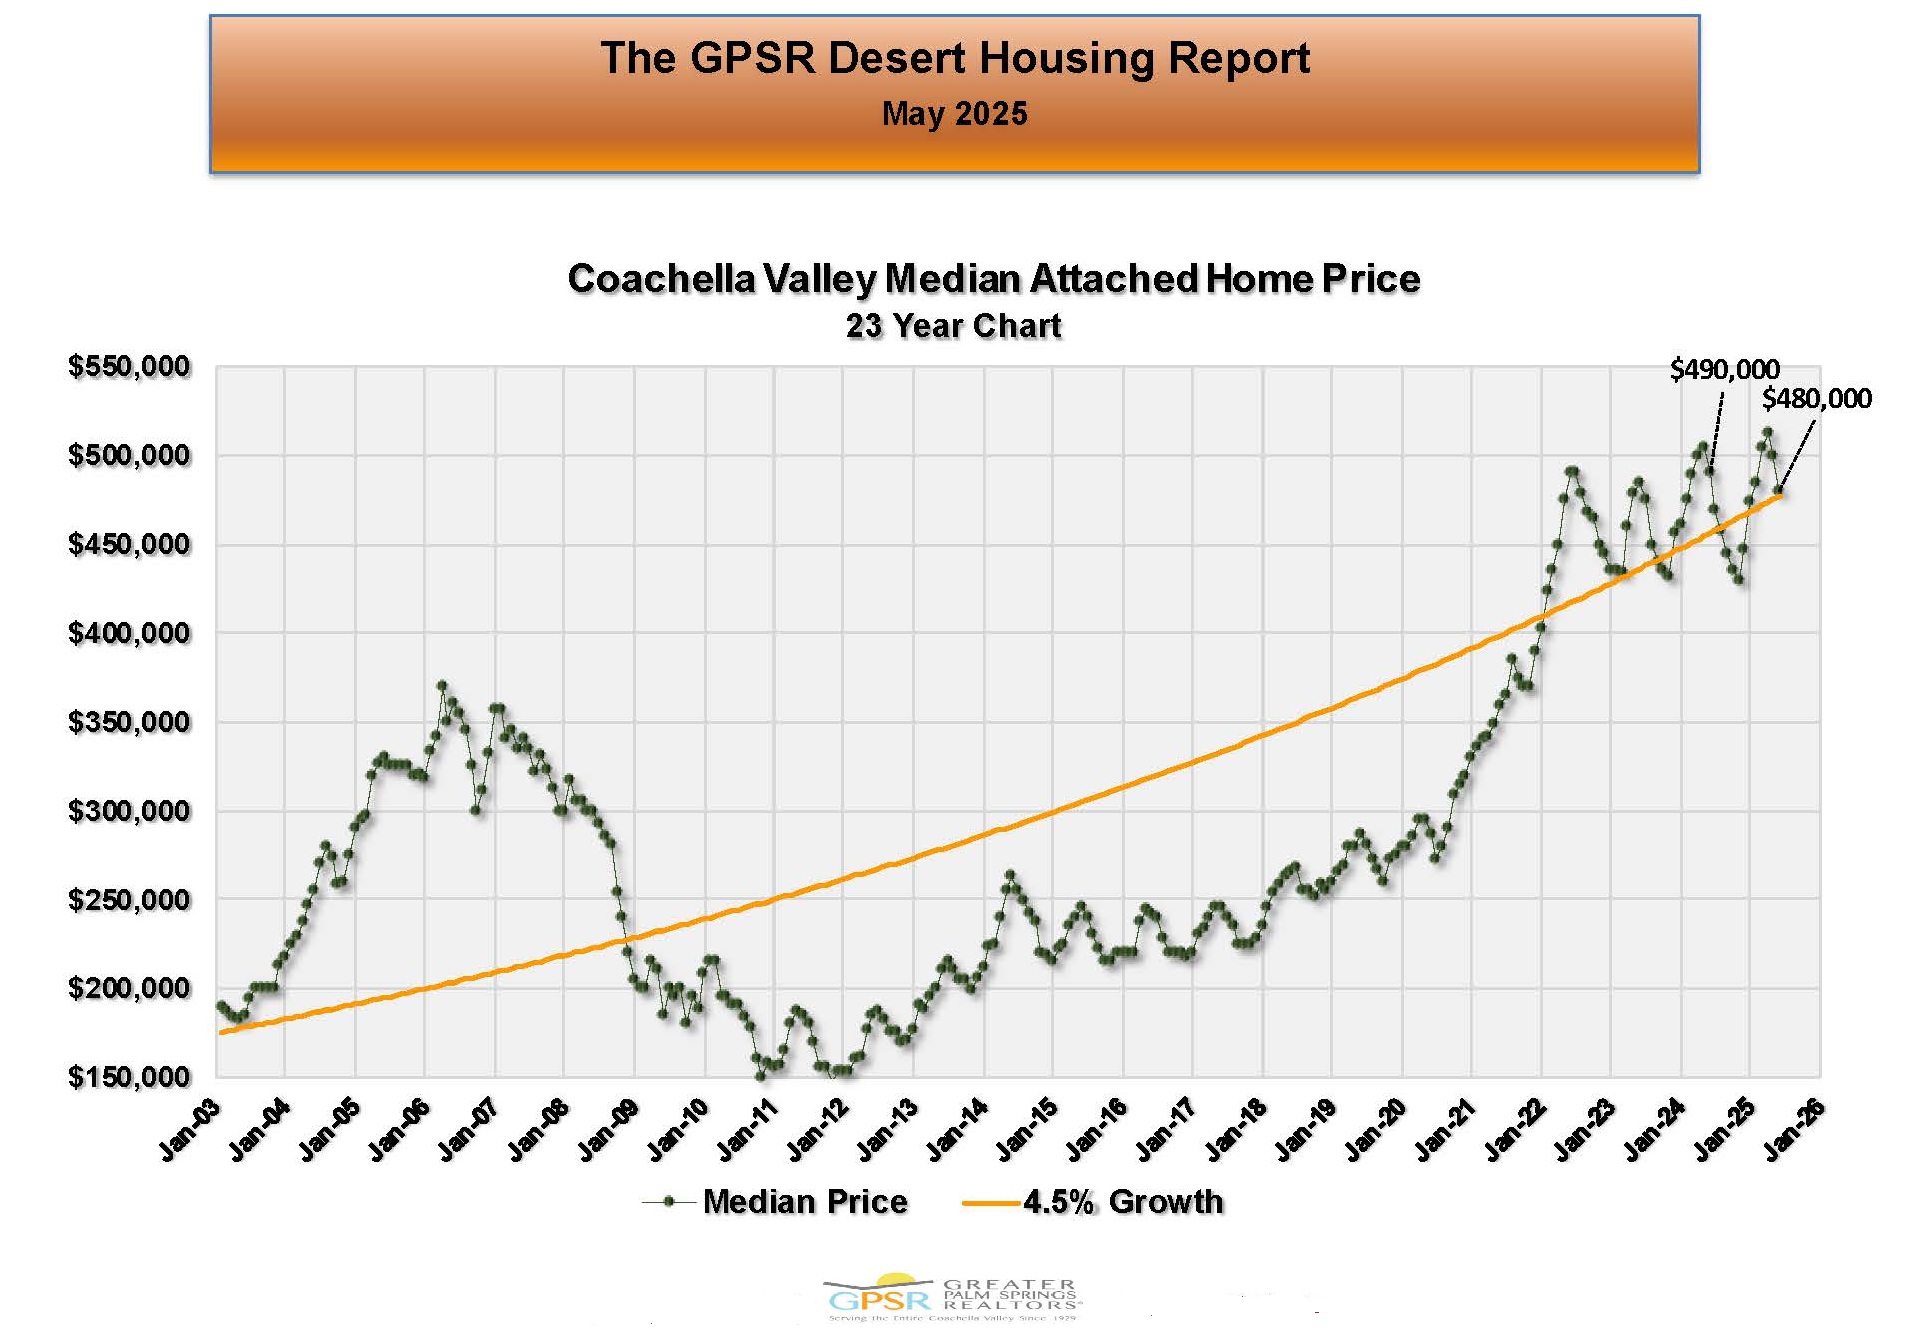 COACHELLA VALLEY MAY ATTACHED HOME MEDIAN PRICE: The median price of an attached home in the Coachella Valley at the end of May was $480,000 (down $10,000 or 2% from the attached home median price of $490,000 at the end of May 2024). Market Watch commented that the attached home median price seemed to be following the normal seasonal pattern here, too.
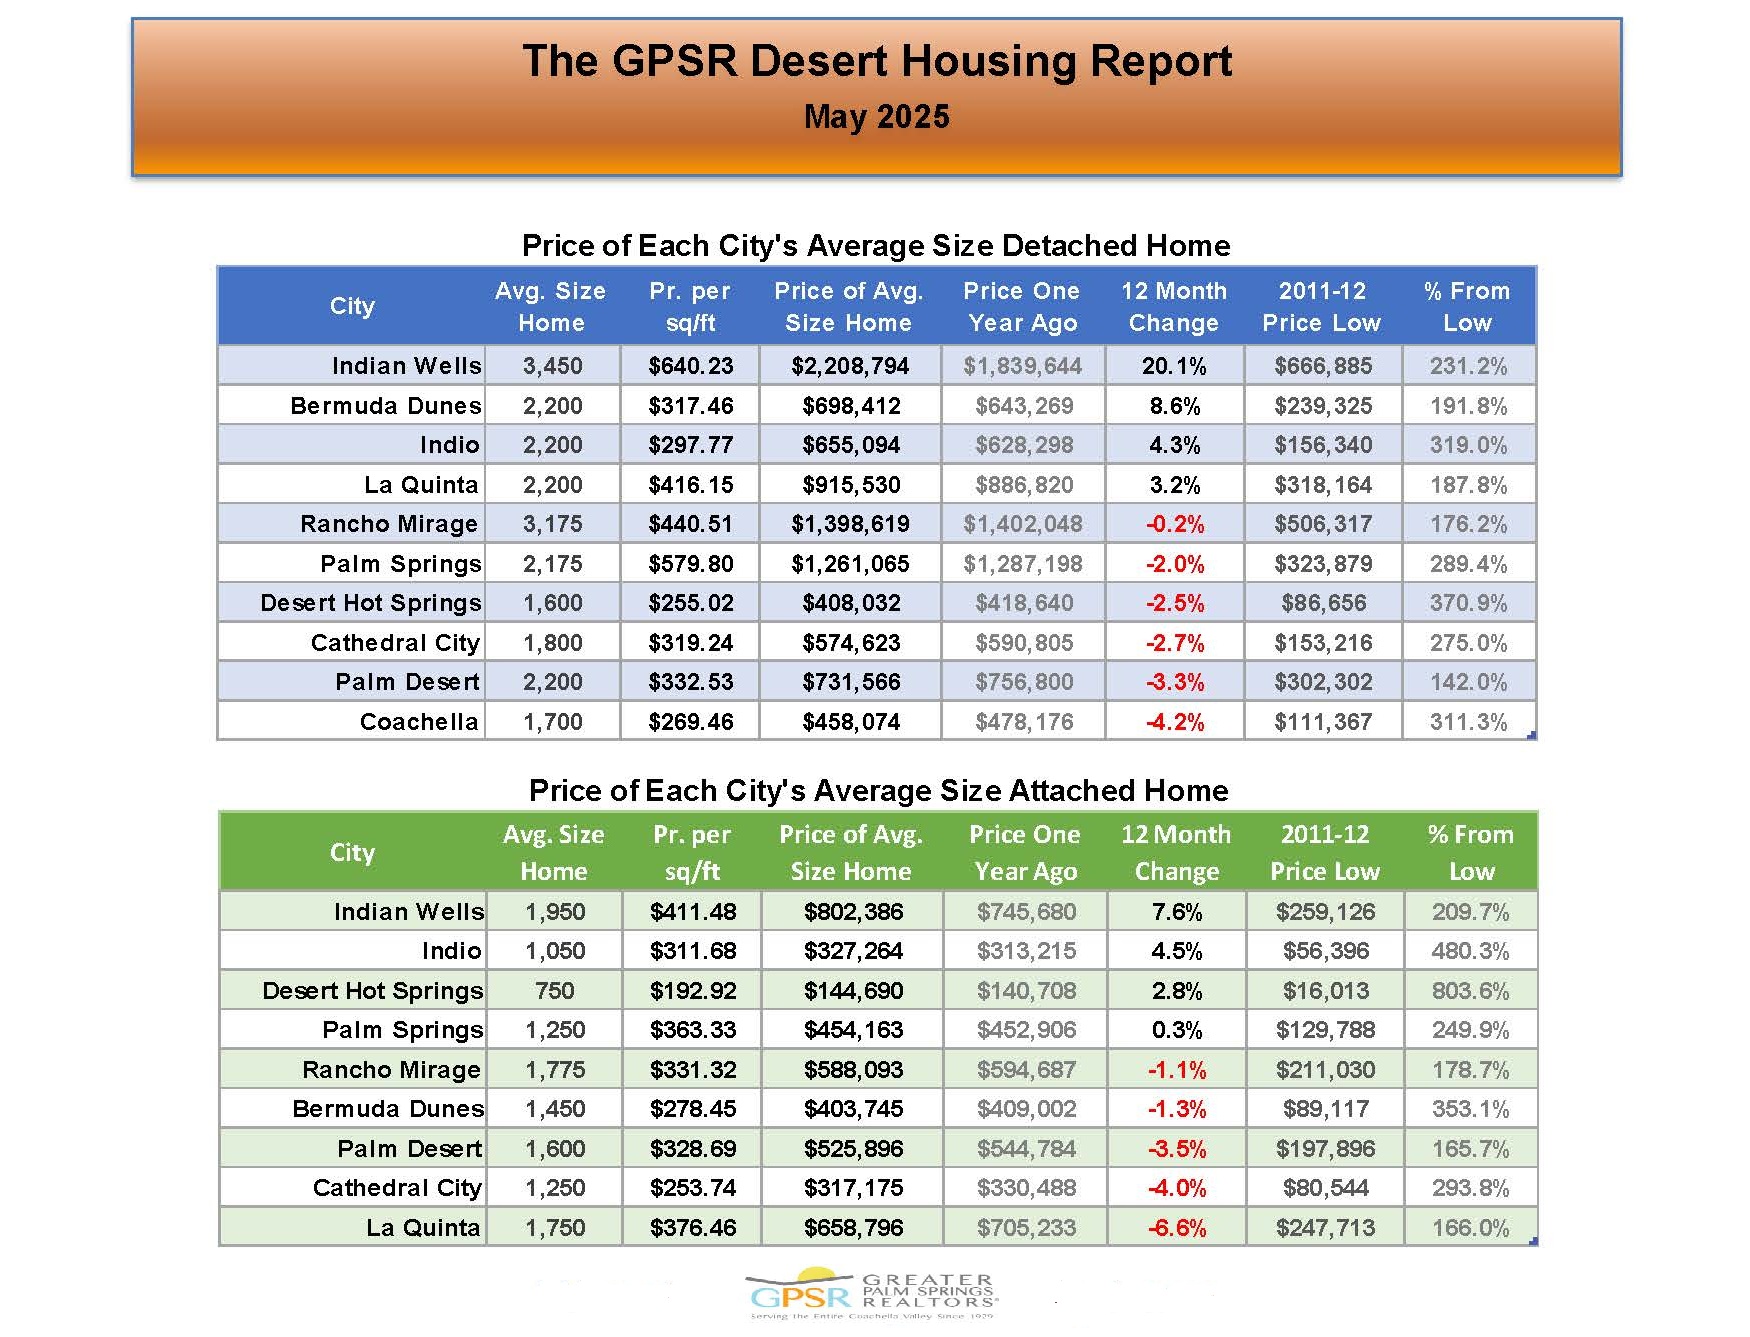 COACHELLA VALLEY MAY YEAR-OVER-YEAR PRICE CHANGE OF AVERAGE SIZE HOMES BY CITY: Year over year price changes in the average size detached home ranged from an increase of 20.1% in Indian Wells (increasing from $1,839,644 in May 2024 to $2,208,794 this past May for the 3,450 sq ft average size detached home in Indian Wells) to a decrease of 4.2% in Coachella (decreasing from $478,176 in May 2024 to $458,074 this past May for the 1,700 sq ft average size detached home in Coachella). Year over year price changes in the average size attached home ranged from an increase of 7.6% in Indian Wells (increasing from $745,680 in May 2024 to $802,386 this past May for the 1,950 sq ft average size attached home in Indian Wells) to a decrease of 6.6% in La Quinta (decreasing from $705,233 in May 2024 to $658,796 this past May for the 1,750 sq ft average size attached home in La Quinta).
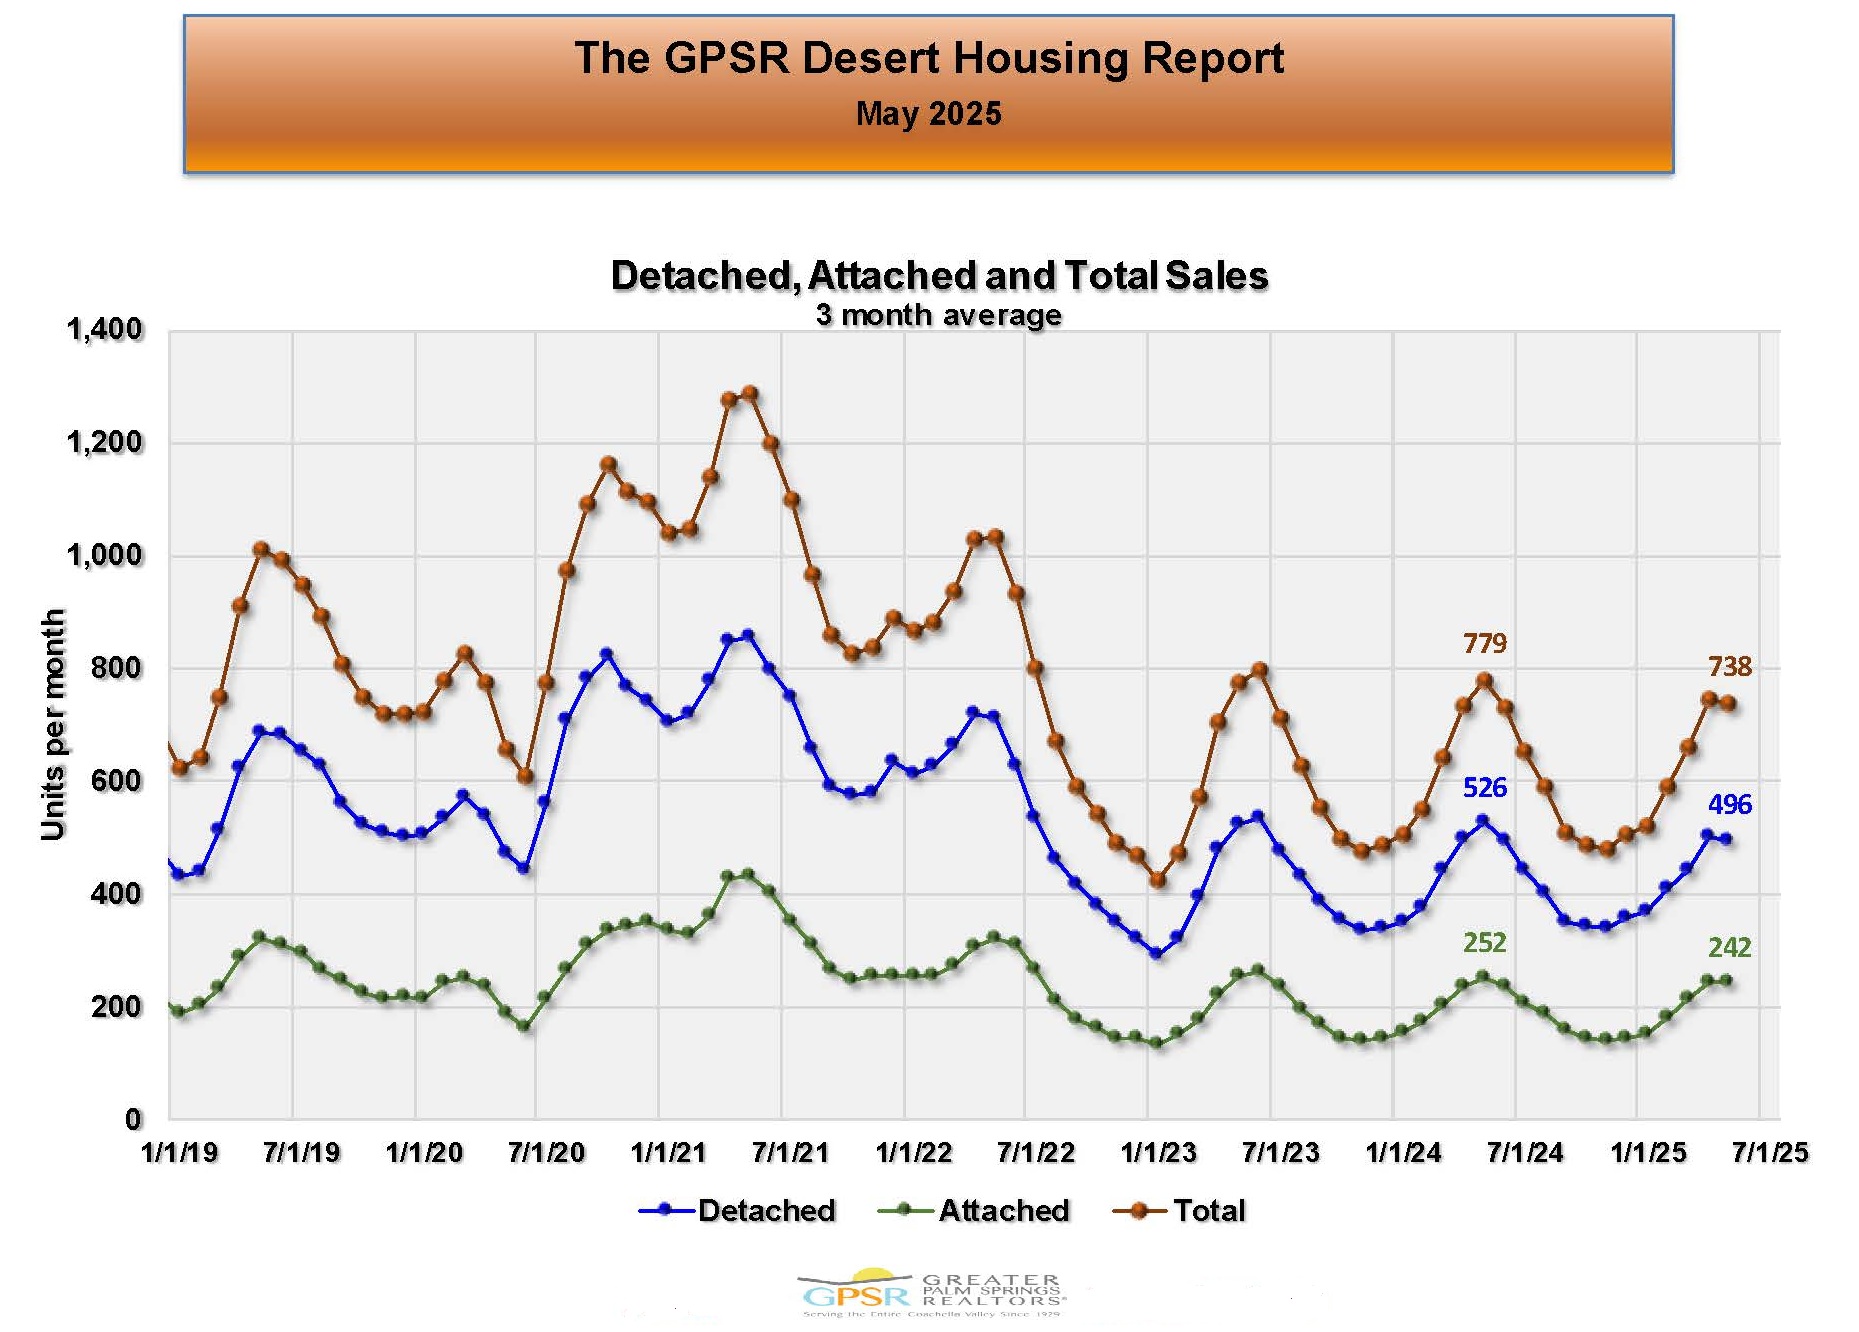 COACHELLA VALLEY MAY MONTHLY HOME SALES (THREE MONTH AVERAGE): Coachella Valley monthly home sales in May averaged 738 homes (down 41 homes or 5.3% from 779 average monthly home sales in May 2024). Market Watch explained that because of seasonality in Coachella Valley home sales, it was difficult to determine where home sales stood on a historical basis. The Sales Recovery data discussed below showed that home sales in May were below pre-pandemic May norms by 20.1.
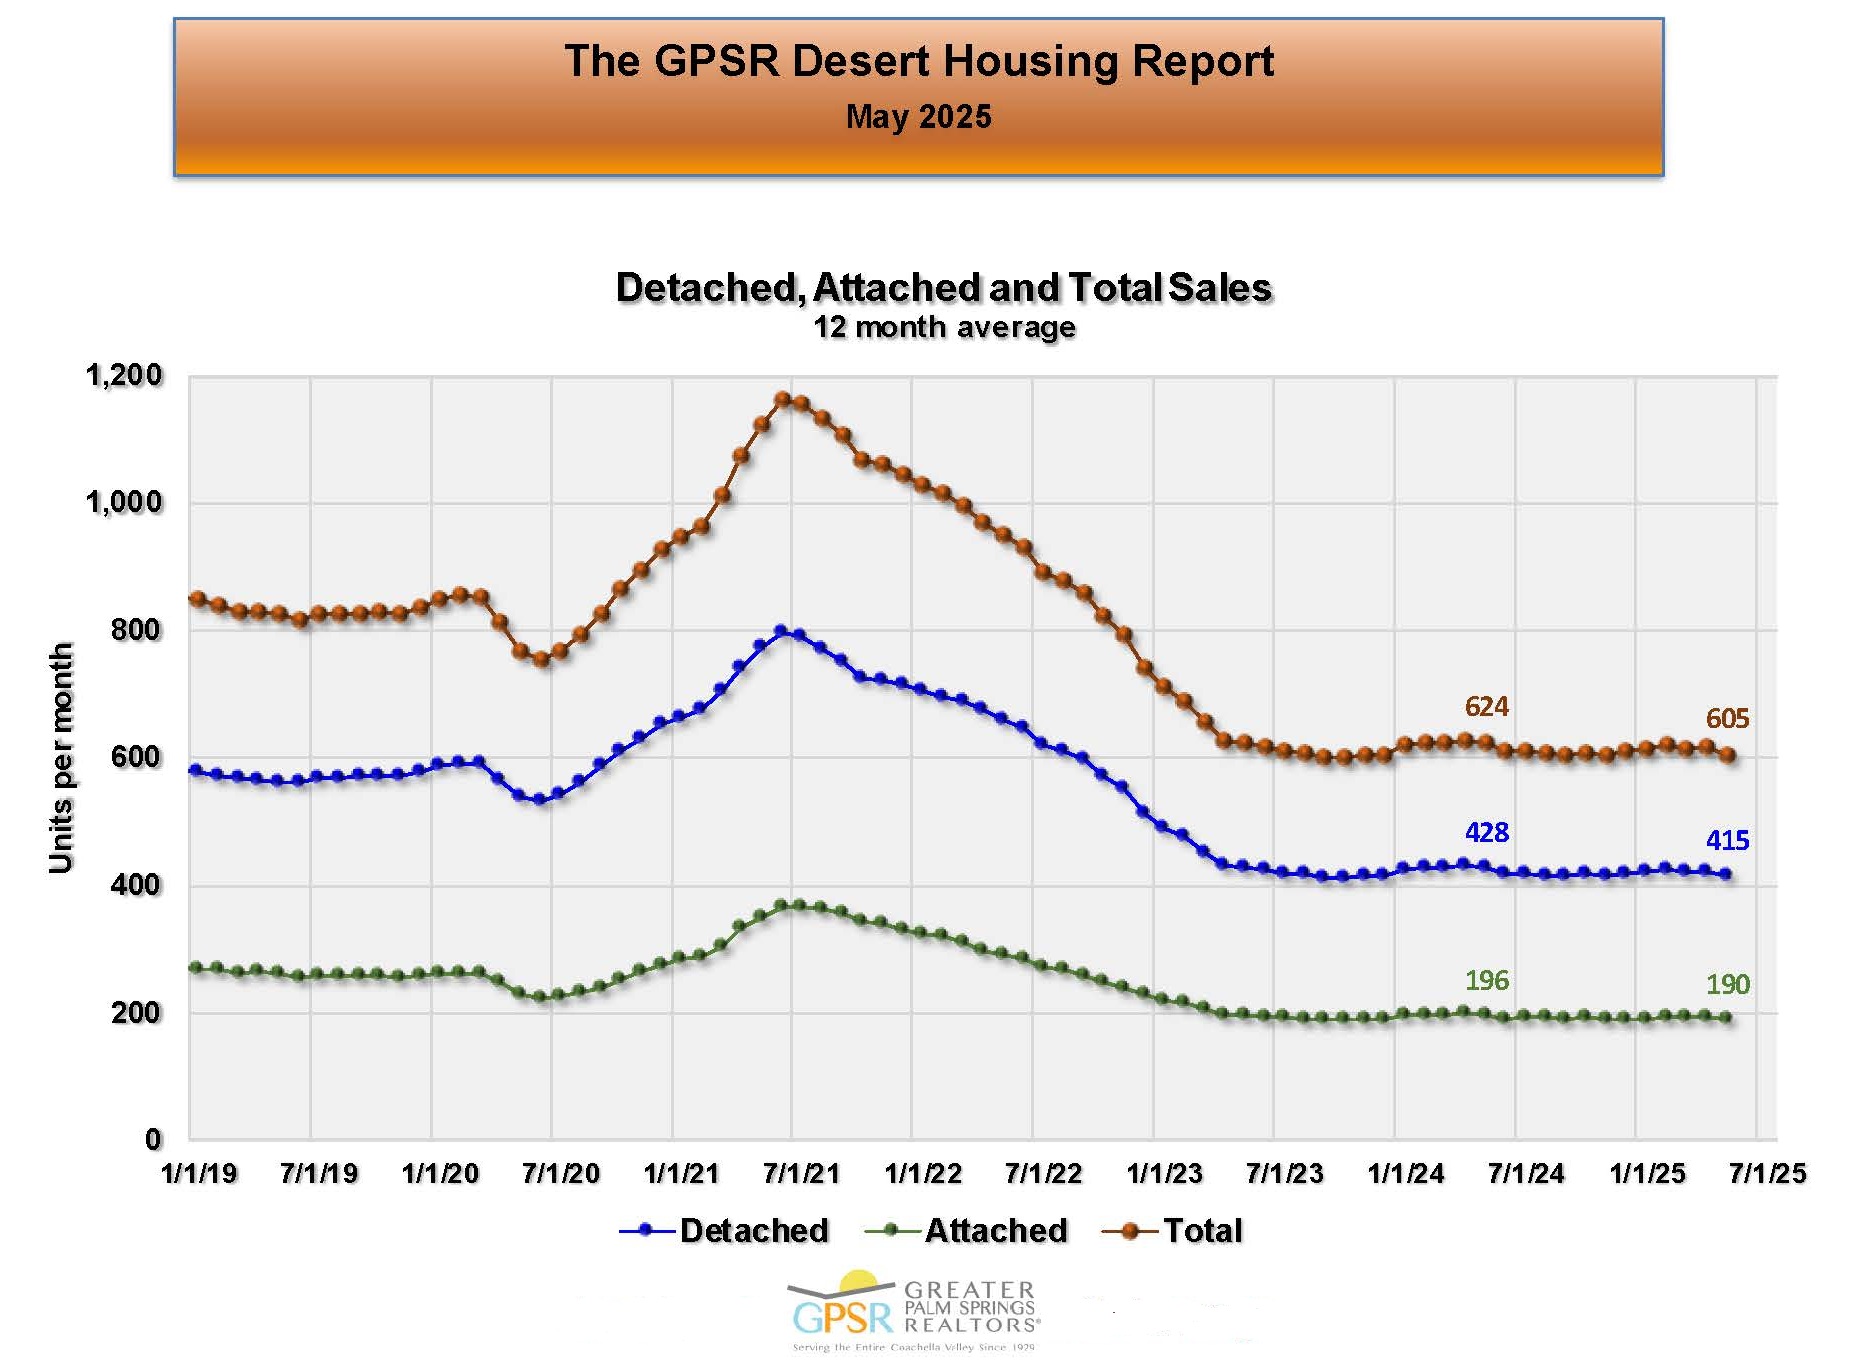 COACHELLA VALLEY MAY MONTHLY HOME SALES (TWELVE MONTH AVERAGE): In the Coachella Valley, May monthly home sales averaged 605 homes (using a 12 month average, which removes the seasonality from Coachella Valley homes sales data). This was down 19 home sales or 3% from 624 average homes sales in May 2024. Market Watch stated that the housing market needs lower mortgage rates. Further they added that although inflation remains low, the Federal Reserve Board has stopped lowering short-term rates until the effect of the administration’s new economic policies can be determined.
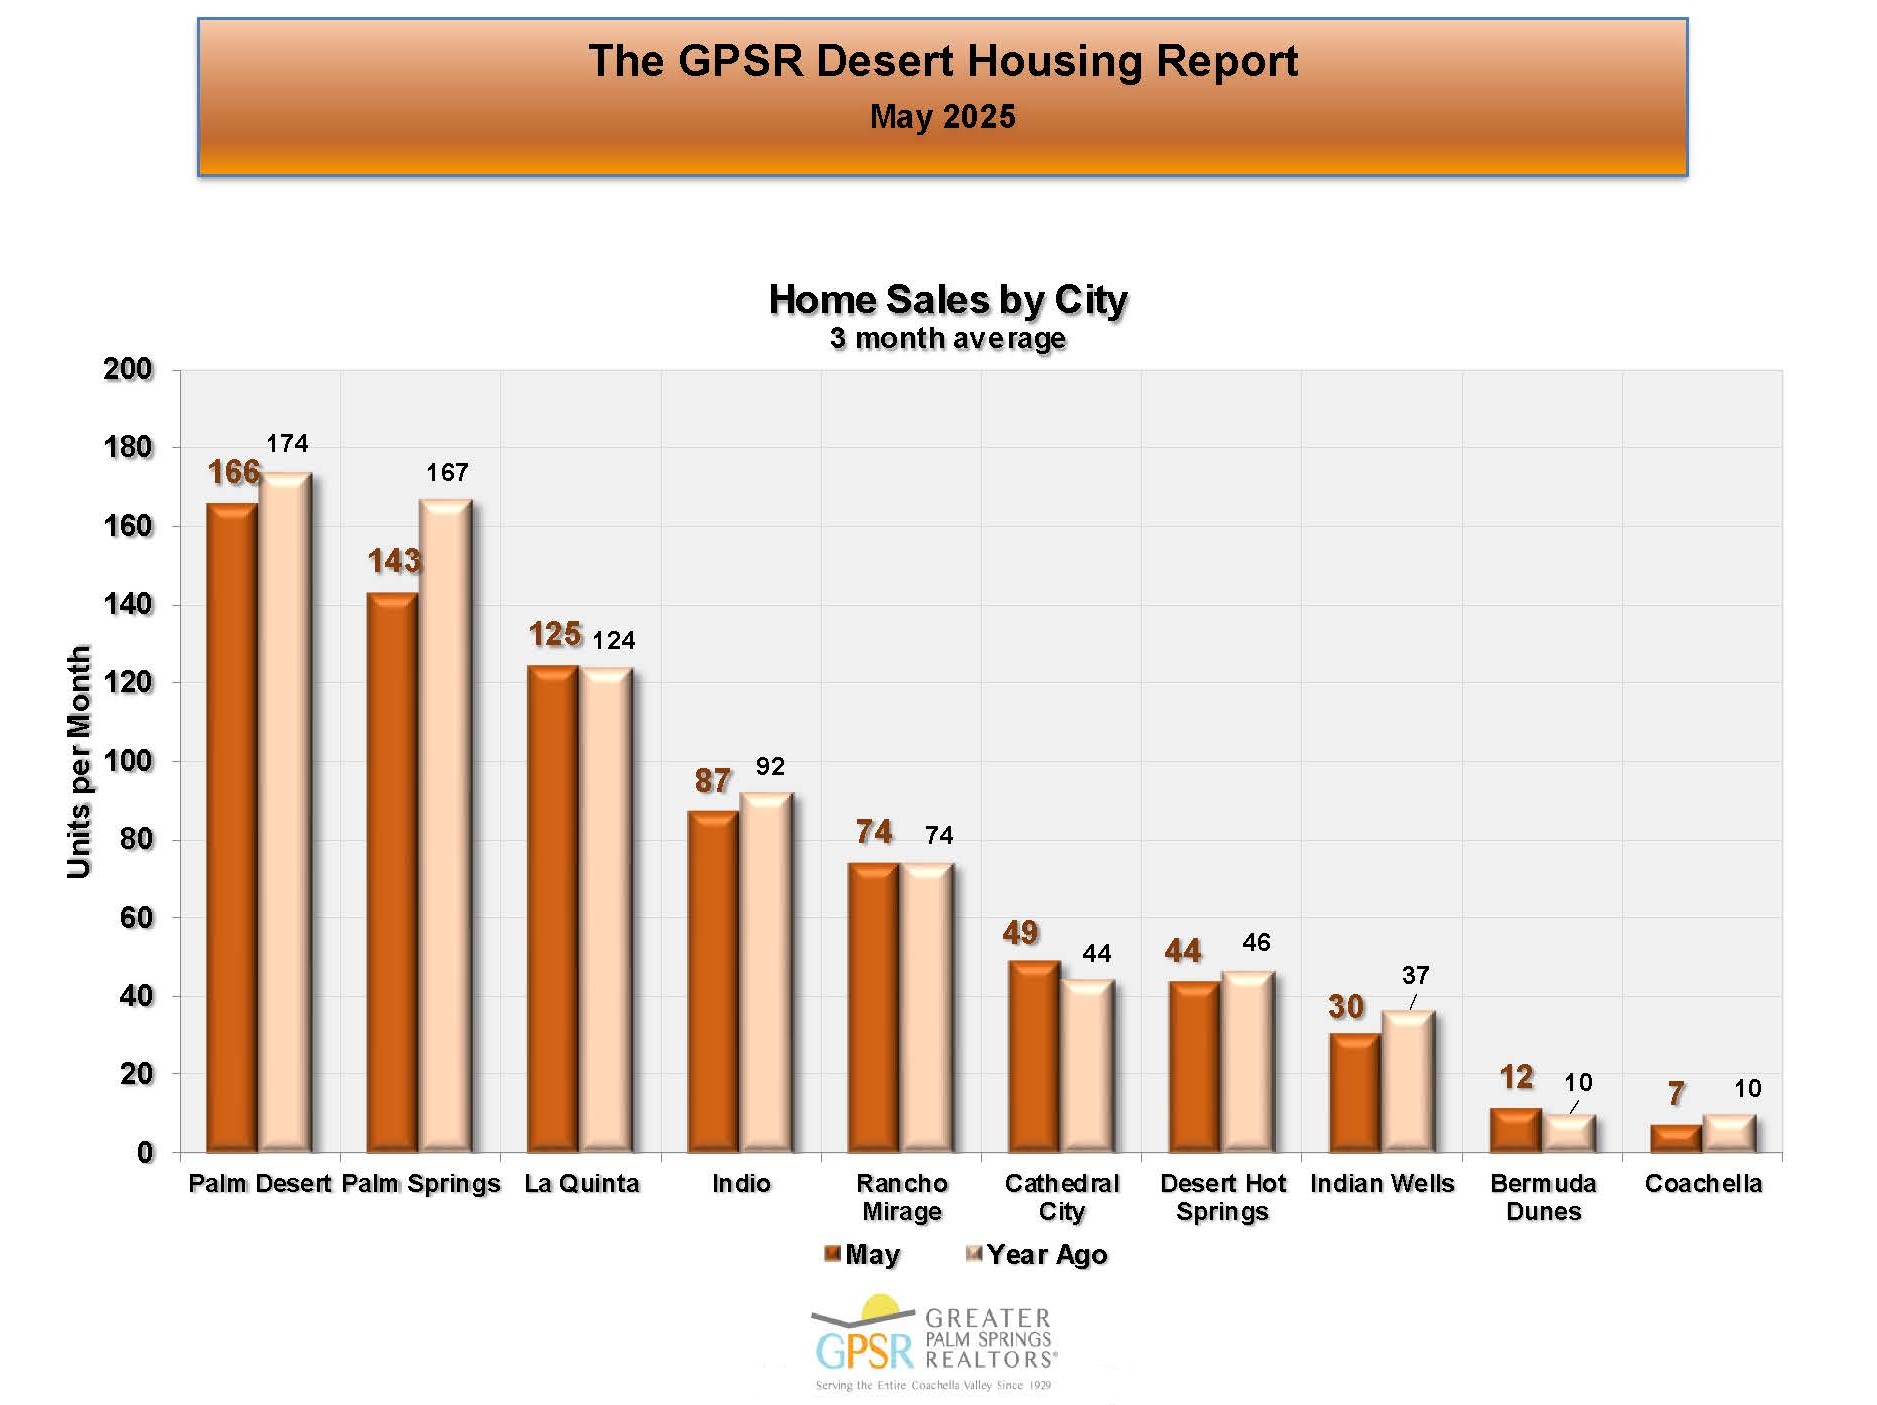 COACHELLA VALLEY MAY MONTHLY HOME SALES BY CITY: In the Coachella Valley in May, Palm Desert had the highest monthly home unit sales at 166 (down 8 homes or 4.6% from 174 monthly home sales in May 2024), followed by Palm Springs with 143 average monthly home sales (down 24 home sales or 14.4% from 167 average monthly home sales in May 2024) and La Quinta with 125 average monthly home sales (up 1 home sale or 0.8% from 124 average monthly home sales in May 2024). On the other end of the spectrum, Coachella had the lowest May average monthly home sales at 7 (down 3 homes or 30% from 10 average monthly home sales in May 2024).
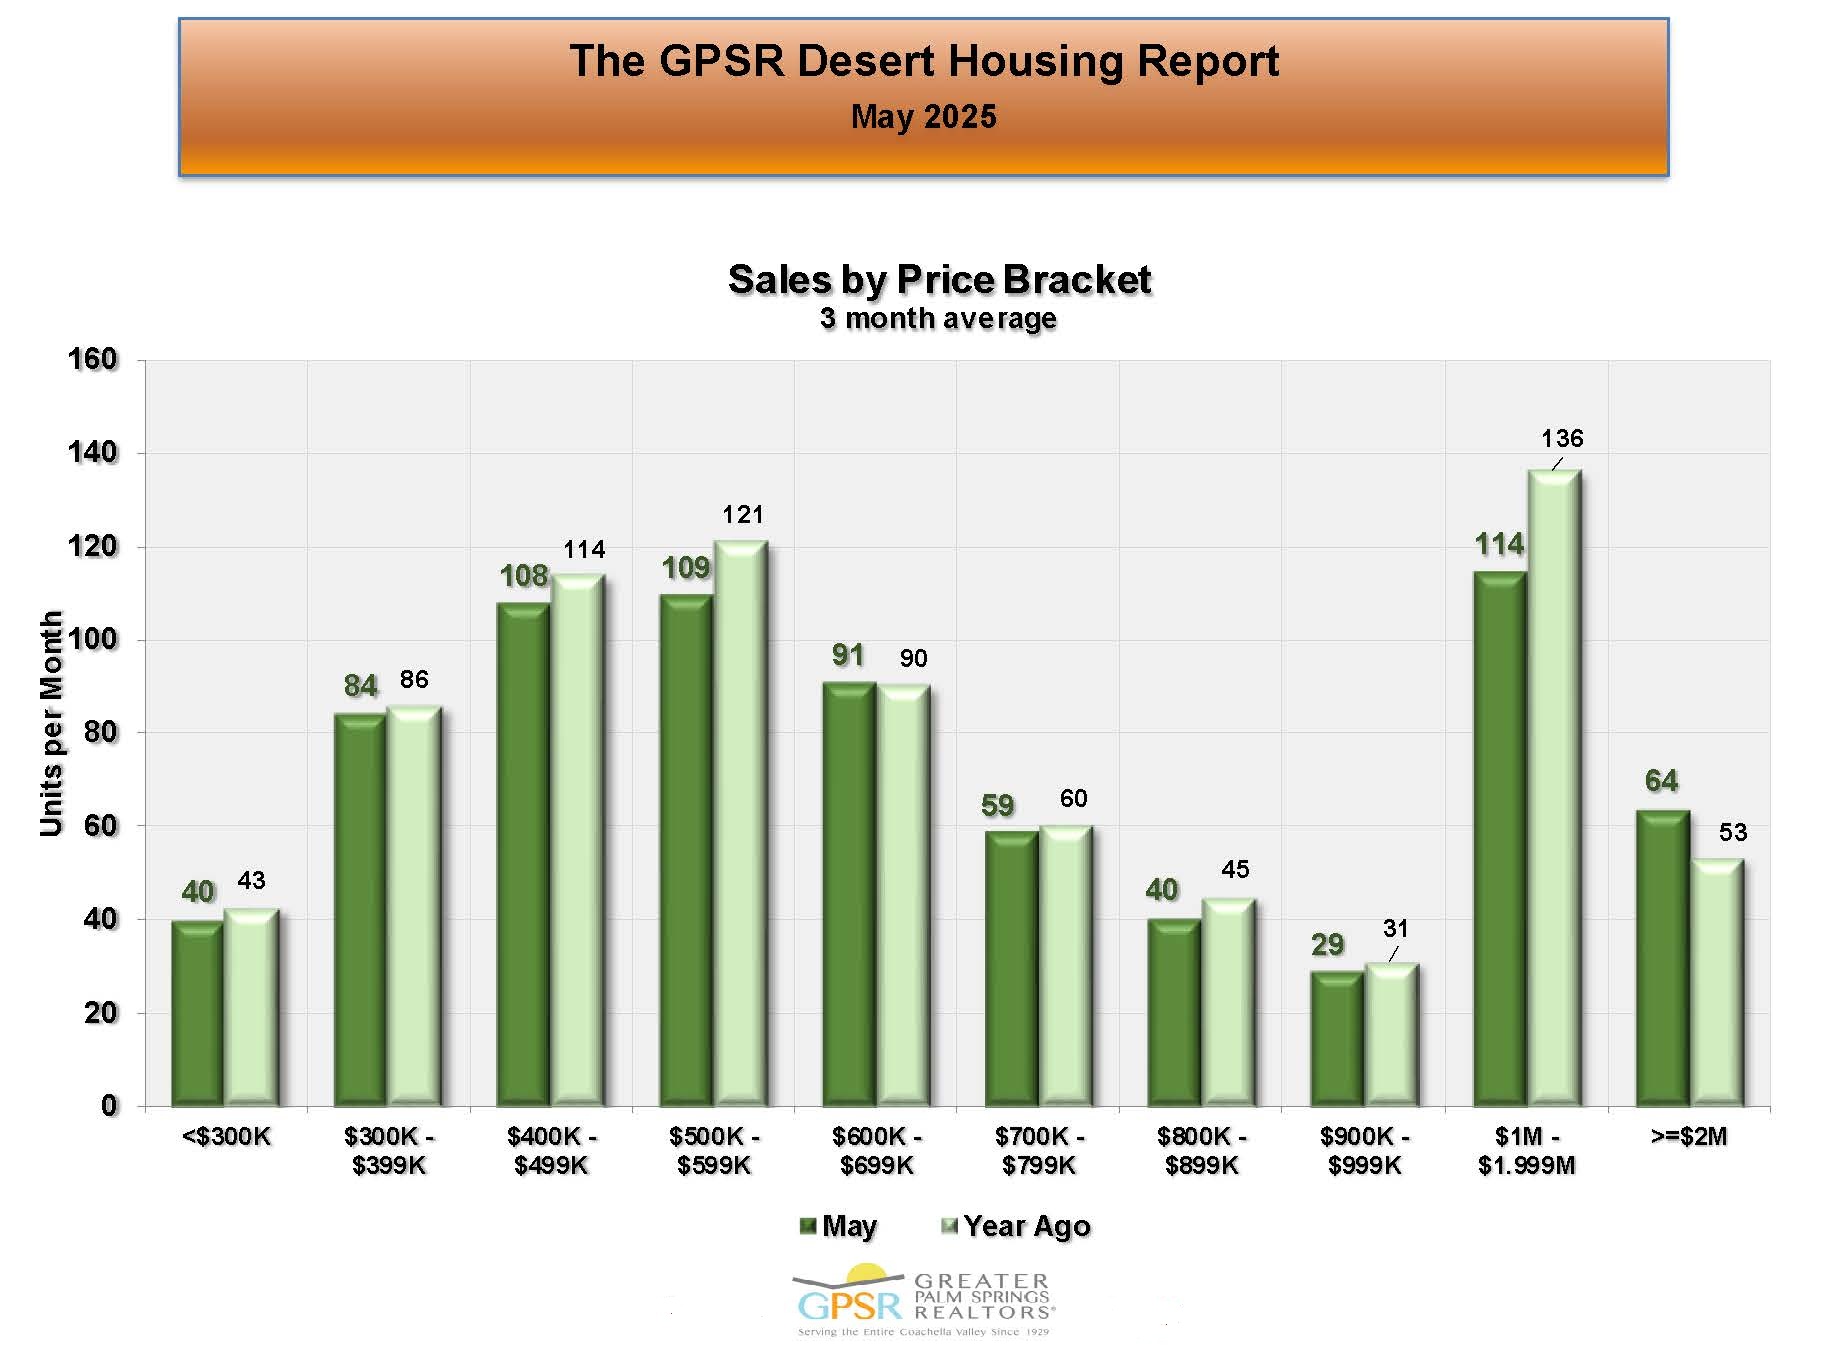 COACHELLA VALLEY MAY MONTHLY HOME SALES BY PRICE RANGE: The highest average monthly home sales were for homes priced between $1M and $1.999M at 114 sales (down 22 home sales or 16.2% from 136 average monthly home sales in May 2024). The lowest average monthly home sales were for homes priced between $900K and $999K at 29 sales (down 2 home sales or 6.5% from 31 average monthly home sales in May 2024).
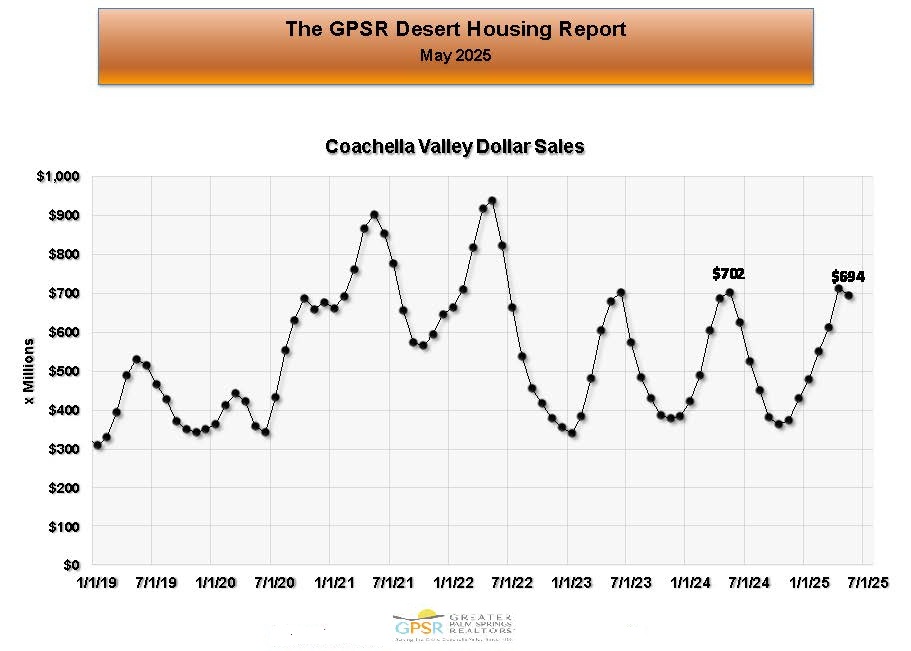 COACHELLA VALLEY MAY MONTHLY HOME SALES IN DOLLARS: In the Coachella Valley in May, average monthly home sales in dollars were $694M (down $8M or 1.1% from $702M in May 2024).
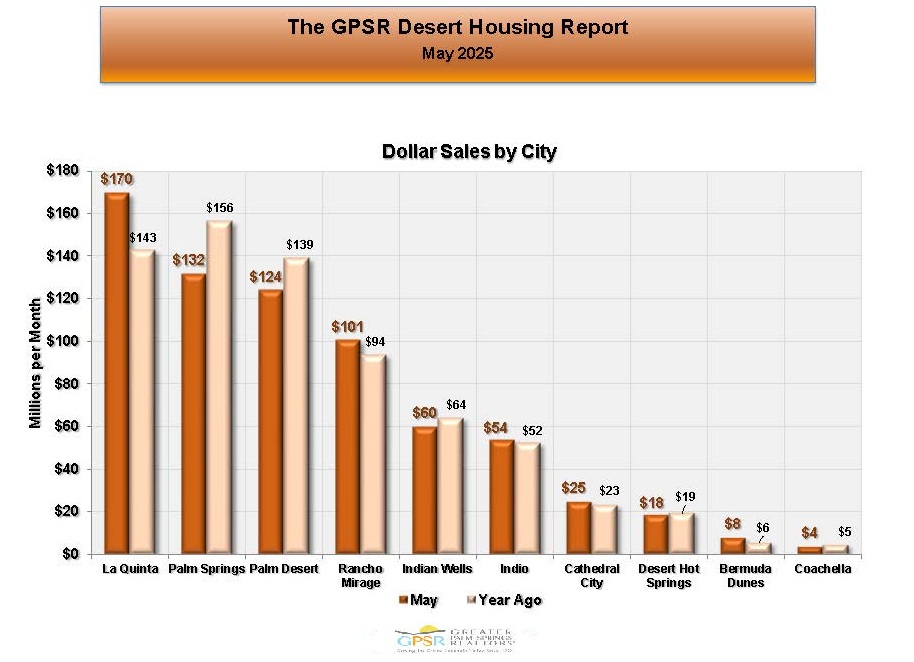 COACHELLA VALLEY MAY MONTHLY HOME SALES IN DOLLARS BY CITY: Market Watch noted that Coachella Valley May average monthly home sales in dollars appeared to be comparable to last year in every city except La Quinta with average monthly home sales at $170M (up $27M or 18.9% from home sales of $143M in May 2024), Palm Springs with average monthly home sales at $132M (down $24M or 15.4% from home sales of $156M in May 2024)and Palm Desert with average monthly home sales at $124M (down $15M or 10.8% from home sales of $139M in May 2024).
 COACHELLA VALLEY MAY MONTHLY HOME SALES IN DOLLARS BY PRICE RANGE: By far, the highest average monthly home sales were for homes priced over $2M at $224M (up $39M or 21.1% from $185M in May 2024) and for homes priced between $1M and $1.999M at $158M (down $29M or 15.5% from 187M in May 2024). Market Watch commented that in May these two price ranges continued to account for 50% of all average monthly home sales in dollars in the Coachella Valley.
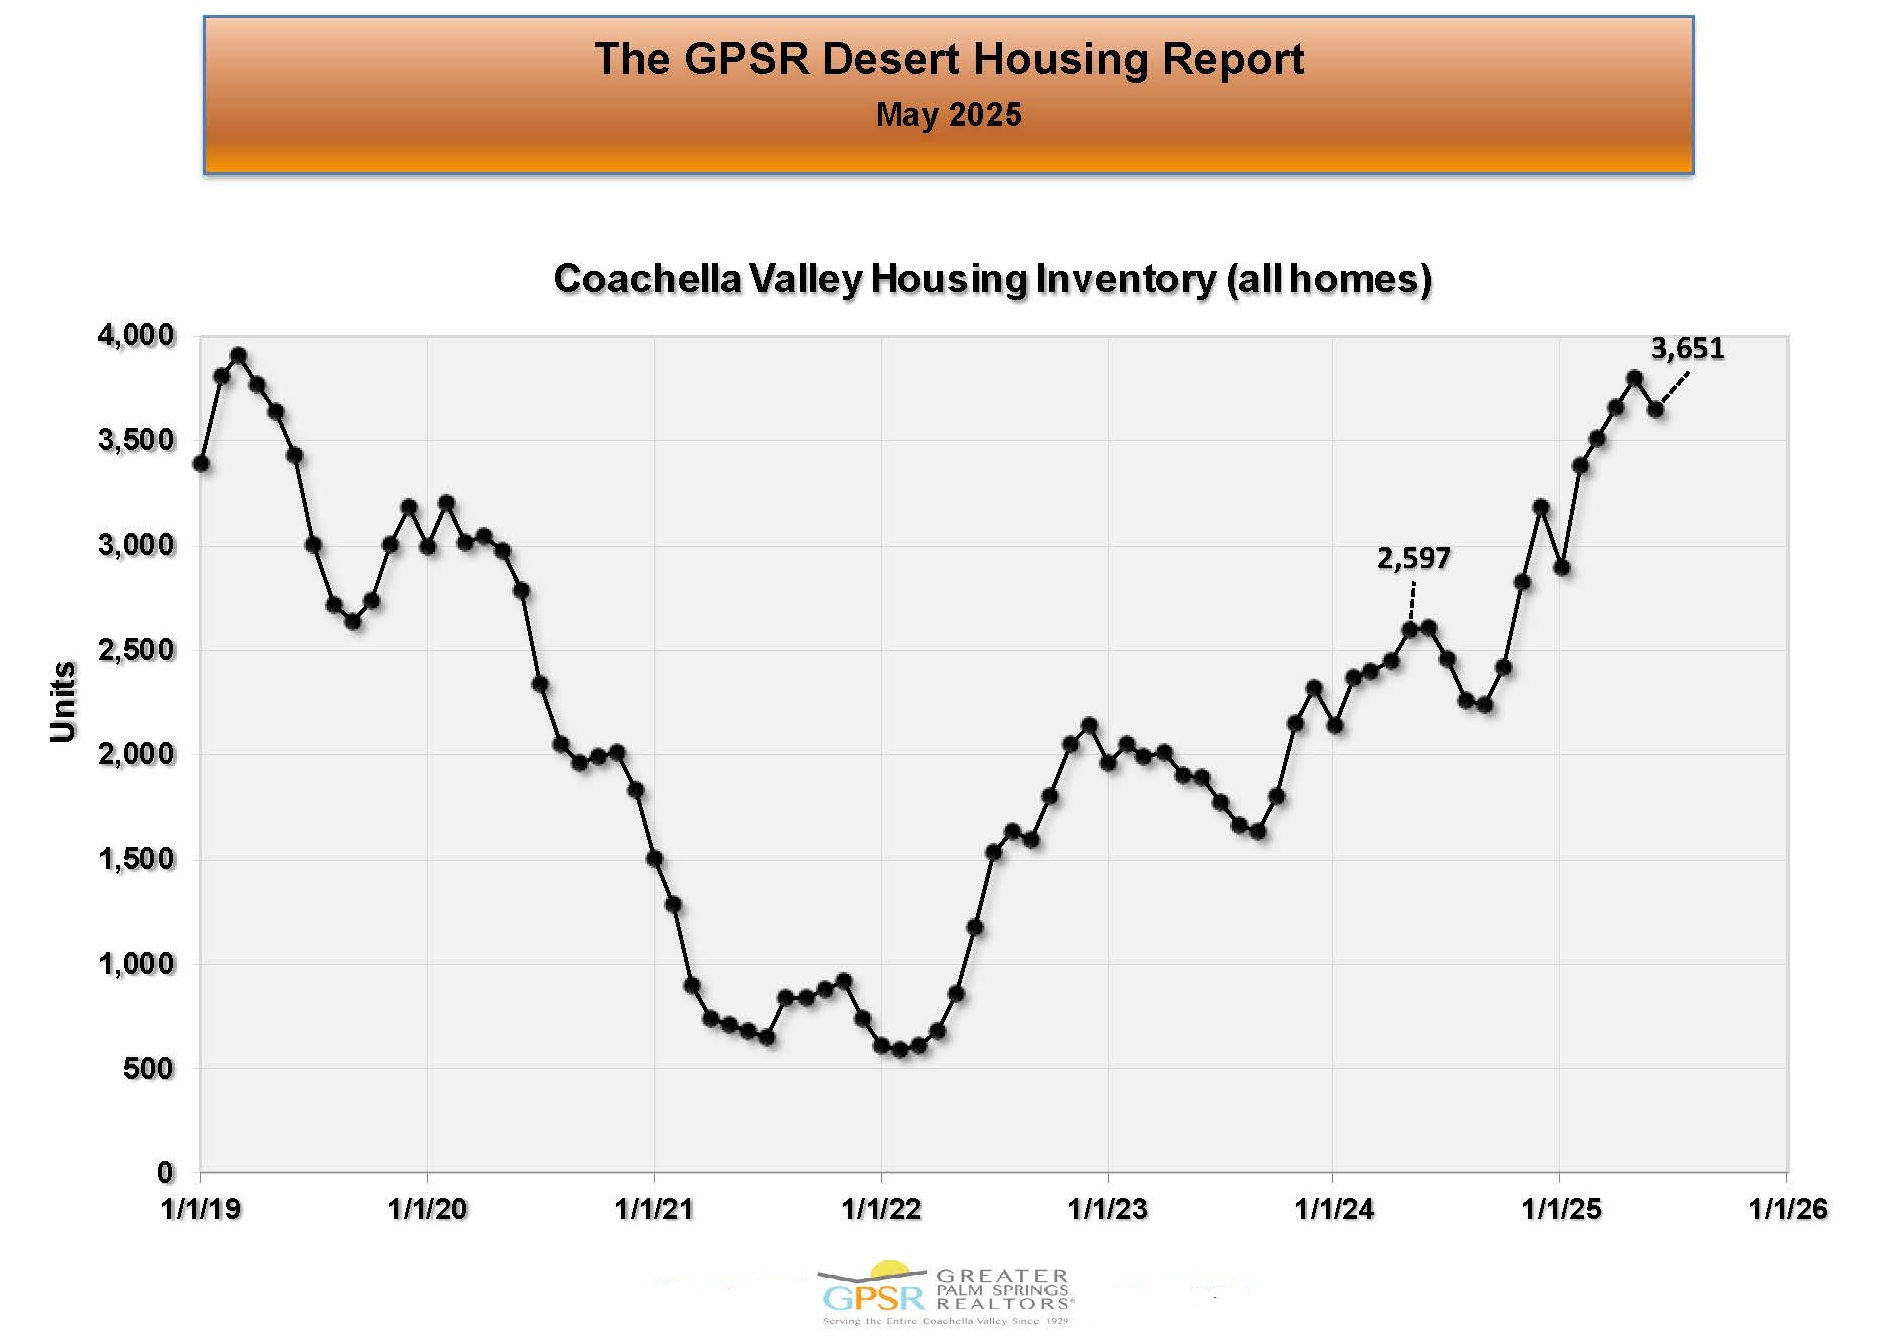 COACHELLA VALLEY JUNE 1st INVENTORY OF ACTIVE LISTINGS: On June 1st, the Coachella Valley active listings inventory was 3,651 homes (up 1,054 homes or 40.1% from 2,597 homes on June 1st, 2024). Market Watch stated that the inventory of active listings in the Coachella Valley has been improving, with the current level comparable to the inventory level before the pandemic. They further commented that the usual seasonal pattern suggested that inventory had probably peaked moving into summer.
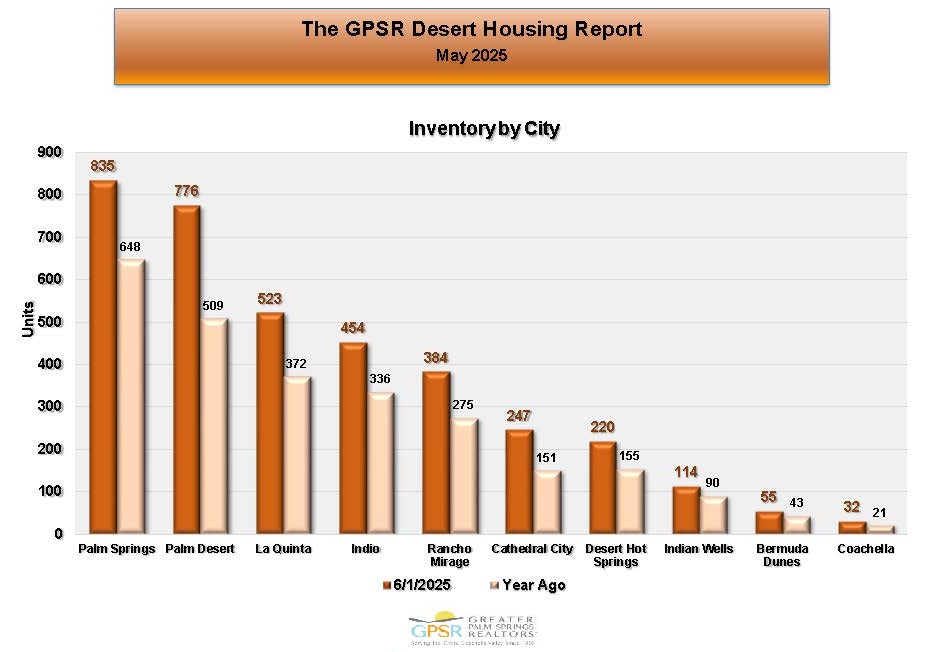 COACHELLA VALLEY JUNE 1st INVENTORY OF ACTIVE LISTINGS BY CITY: The largest active listings inventory in the Coachella Valley on June 1st was in Palm Springs at 835 homes (up 187 homes or 28.9% from 648 homes on June 1st, 2024). The smallest active listings inventory in the Coachella Valley on June 1st was in Coachella at 32 homes (up 11 homes or 52.4% from 21 homes on June 1st, 2024). Market Watch suggested that this information could help identify those Coachella Valley cities where homeowners had the greatest selling interest compared to the same time last year.
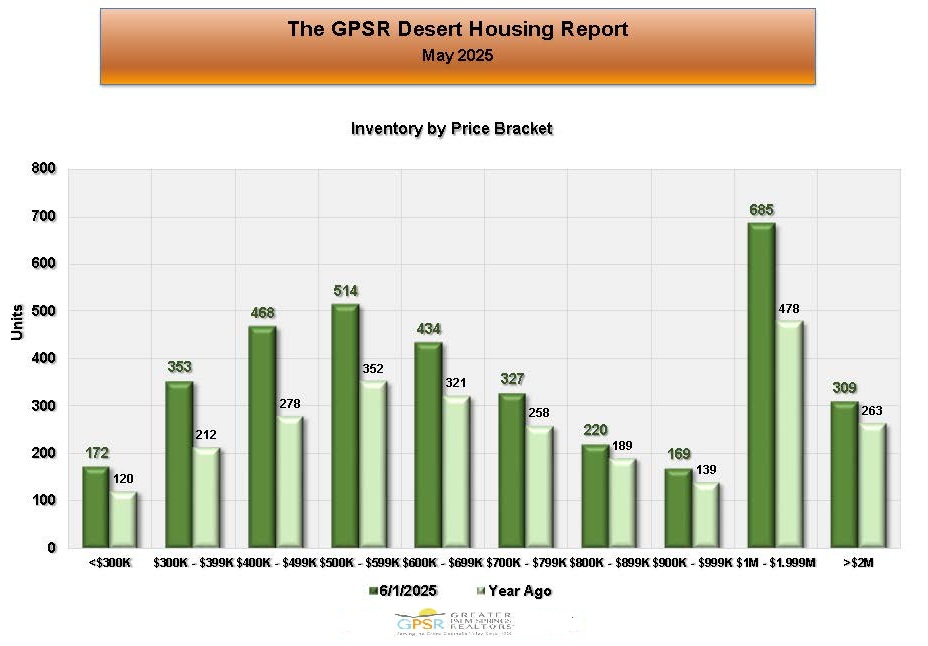 COACHELLA VALLEY JUNE 1st INVENTORY OF ACTIVE LISTINGS BY PRICE RANGE: The largest active listings inventory in the Coachella Valley on June 1st was for homes priced between $1M and $1.999M at 685 homes (up 207 homes or 43.3% from 478 homes on June 1st, 2024). The smallest active listings inventory in the Coachella Valley on June 1st was for homes priced between $900K and $999K at 169 homes (up 30 homes or 21.6% from 139 homes on June 1st, 2024). Market Watch noted that this information could be useful in identifying those price ranges responsible for inventory growth or contraction.
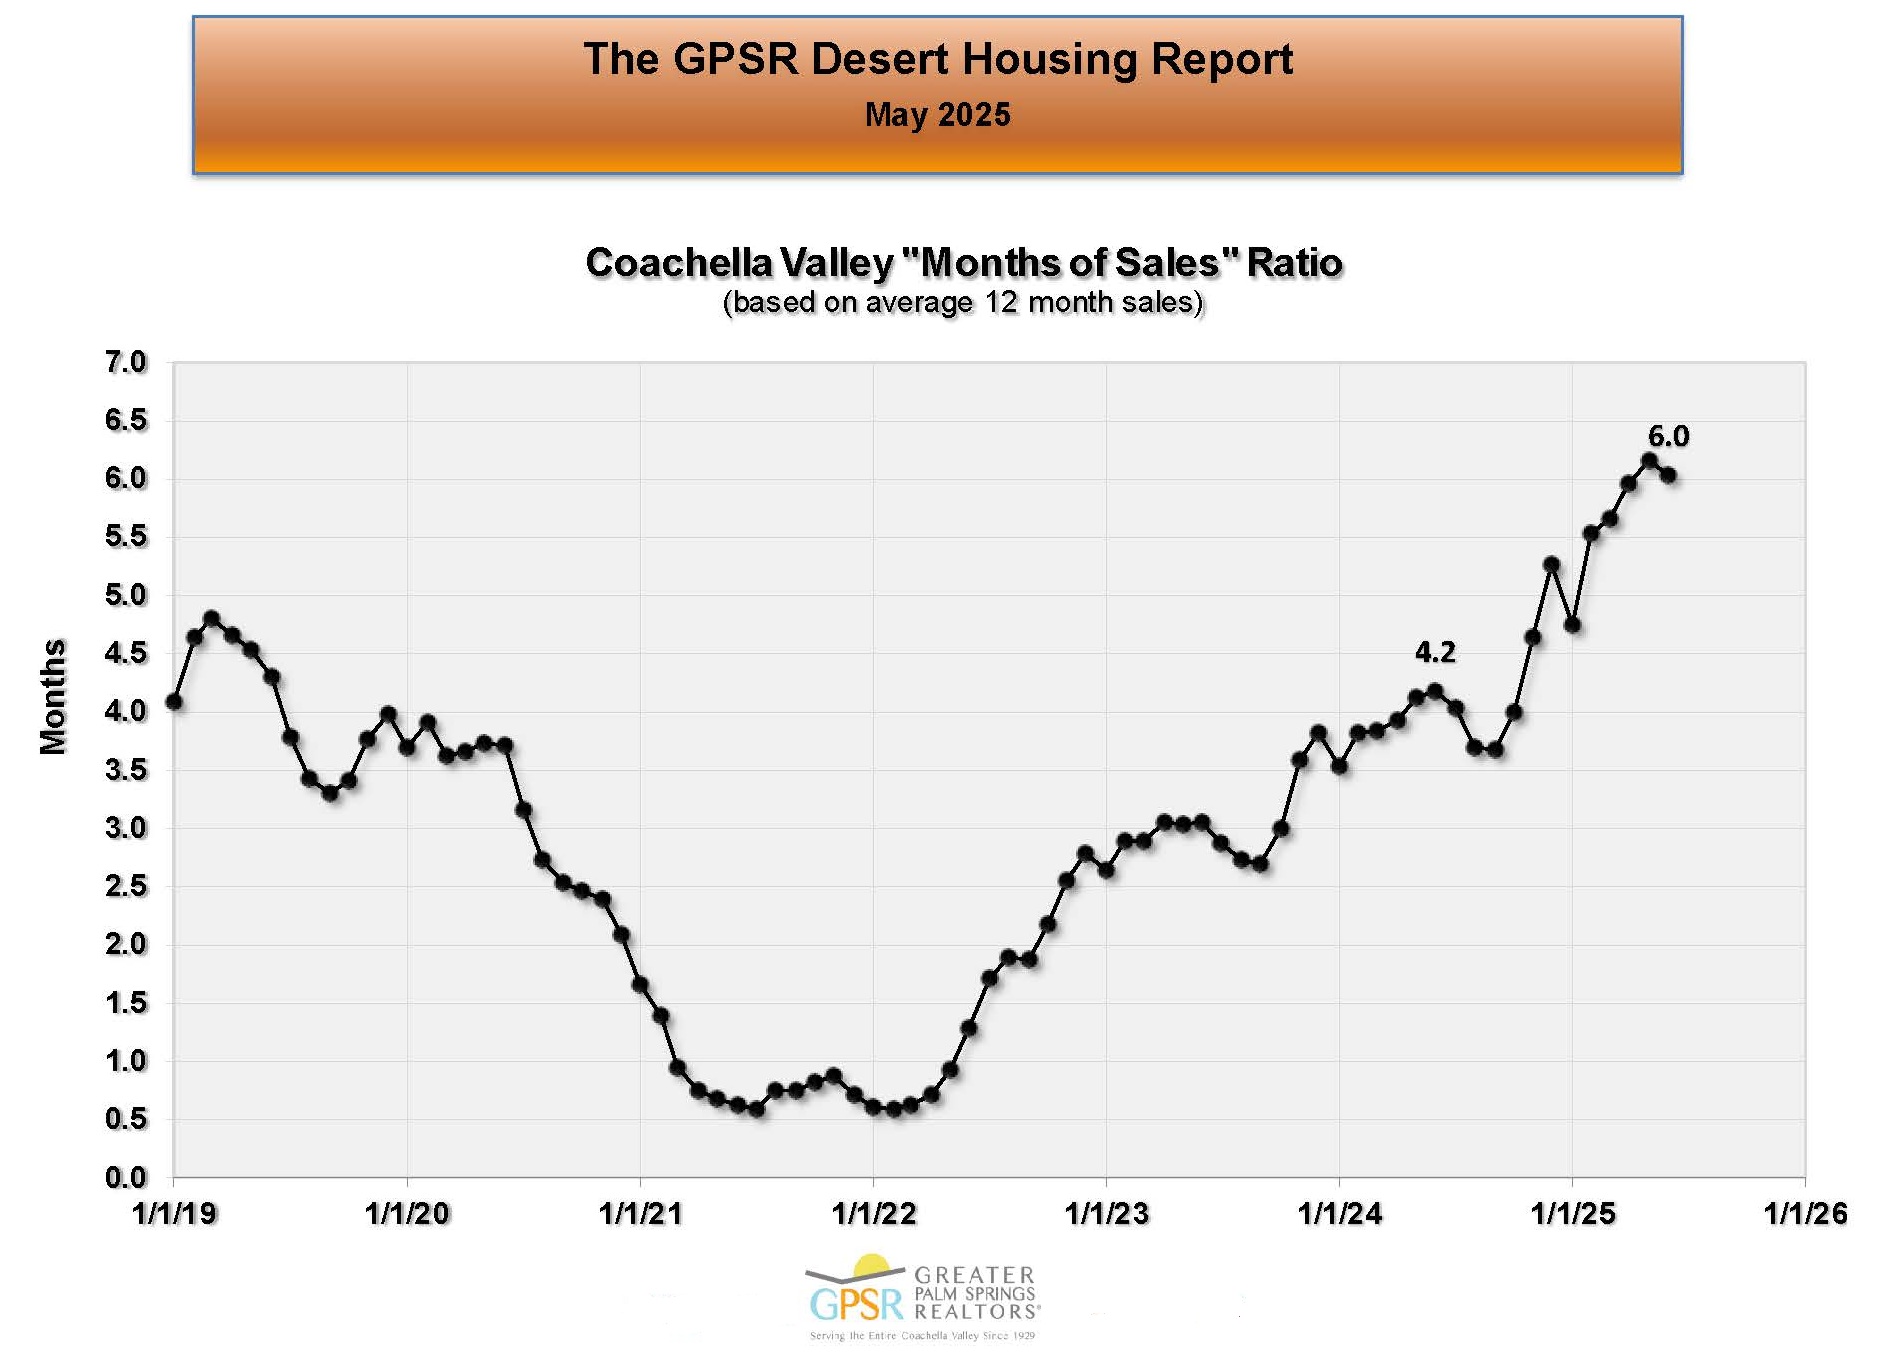 COACHELLA VALLEY JUNE 1st MONTHS OF SALES RATIO: On June 1st, the Coachella Valley’s months of sales ratio was 6.0 months (up 1.8 months or 42.9% from 4.2 months on June 1st, 024). Market Watch explained that this fundamental ratio, which measures housing supply and demand, was above pre-pandemic levels. They noted that while inventory has recovered, because of low sales, home sale supply was beginning to exceed home purchase demand. They further explained that this should not cause a problem for home prices unless it begins to extend average selling times, which are currently normal.
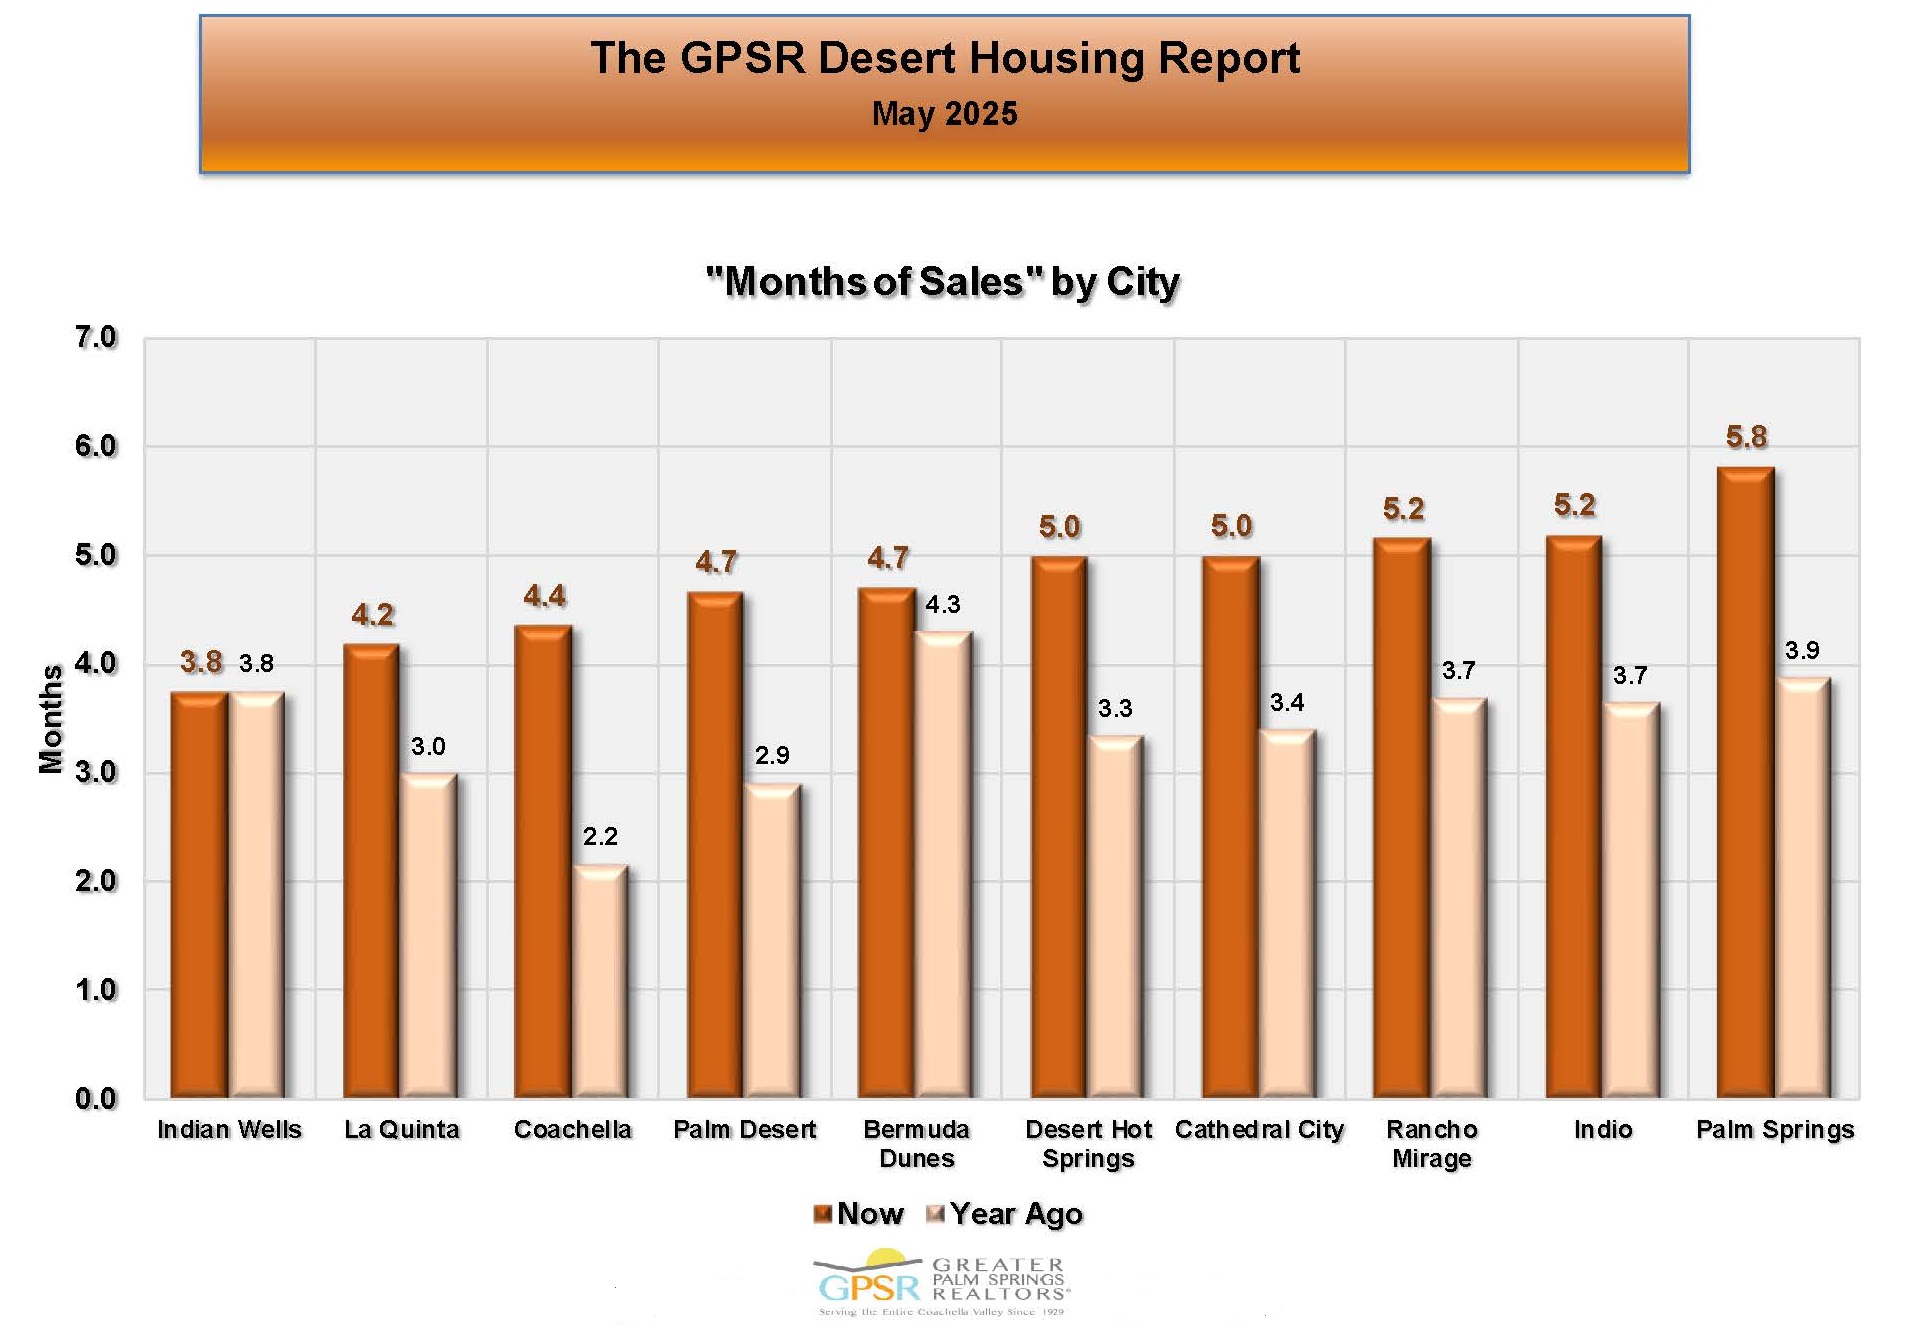 COACHELLA VALLEY JUNE 1st MONTHS OF SALES RATIO BY CITY: On June 1st in the Coachella Valley, the highest months of sales ratio was in Palm Springs at 5.8 months (up 1.9 months or 48.7% from 3.9 months on June 1st, 2024). On June 1st in the Coachella Valley, the lowest months of sales ratio was in Indian Wells at 3.8 months (the same as on June 1st, 2024). Market Watch did comment that since the months of sales ratio is really the housing supply-demand equation, it showed that the Coachella Valley housing market was becoming supply-heavy.
 COACHELLA VALLEY JUNE 1st MONTHS OF SALES RATIO BY PRICE RANGE: On June 1st in the Coachella Valley, the highest months of sales ratio was for homes priced between $1M and $1.999M at 6.0 months (up 1.7 months or 68% from 2.5 months on June 1st, 2024). On June 1st in the Coachella Valley, the lowest months of sales ratio was for homes priced between $300K and $399K at 4.2 months (the same as on June 1st, 2024). Market Watch did state that since months of sales ratios were really the housing supply and demand equation, the large increases in the months of sale ratios over last year showed that supply was starting to exceed demand in almost all price ranges. They felt that this hadn’t affected home prices yet and most probably would not until selling times begin to lengthen.
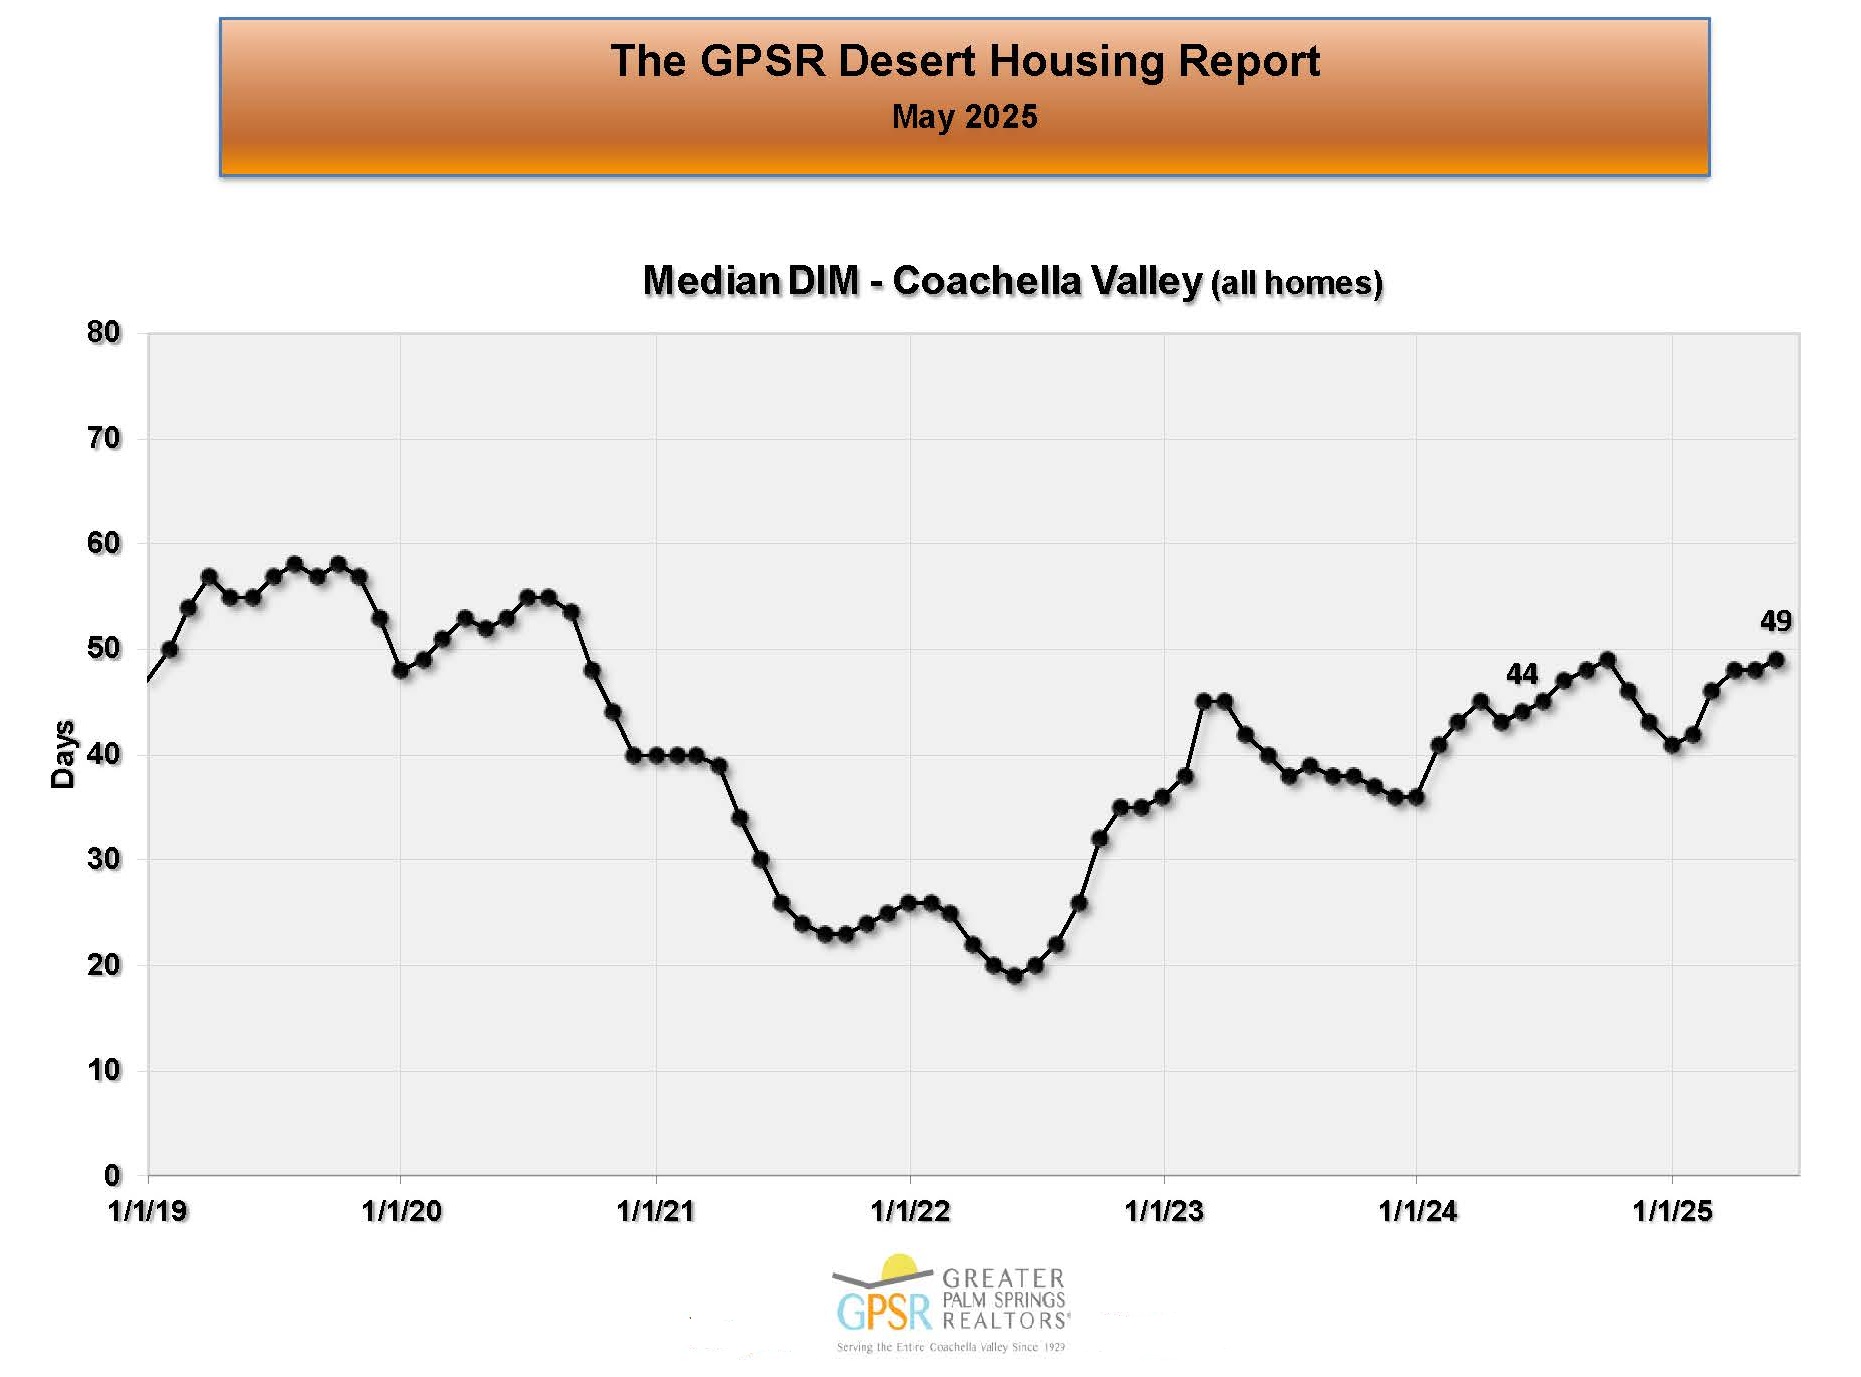 COACHELLA VALLEY MAY OVERALL DAYS IN THE MARKET: At the end of May, the median number of days in the market in the Coachella Valley was 49 days (up 5 days or 11.4% from 44 days at the end of May 2024). Market Watch commented that the median selling time in the Coachella Valley region had been between 40 and 50 days for over two years.
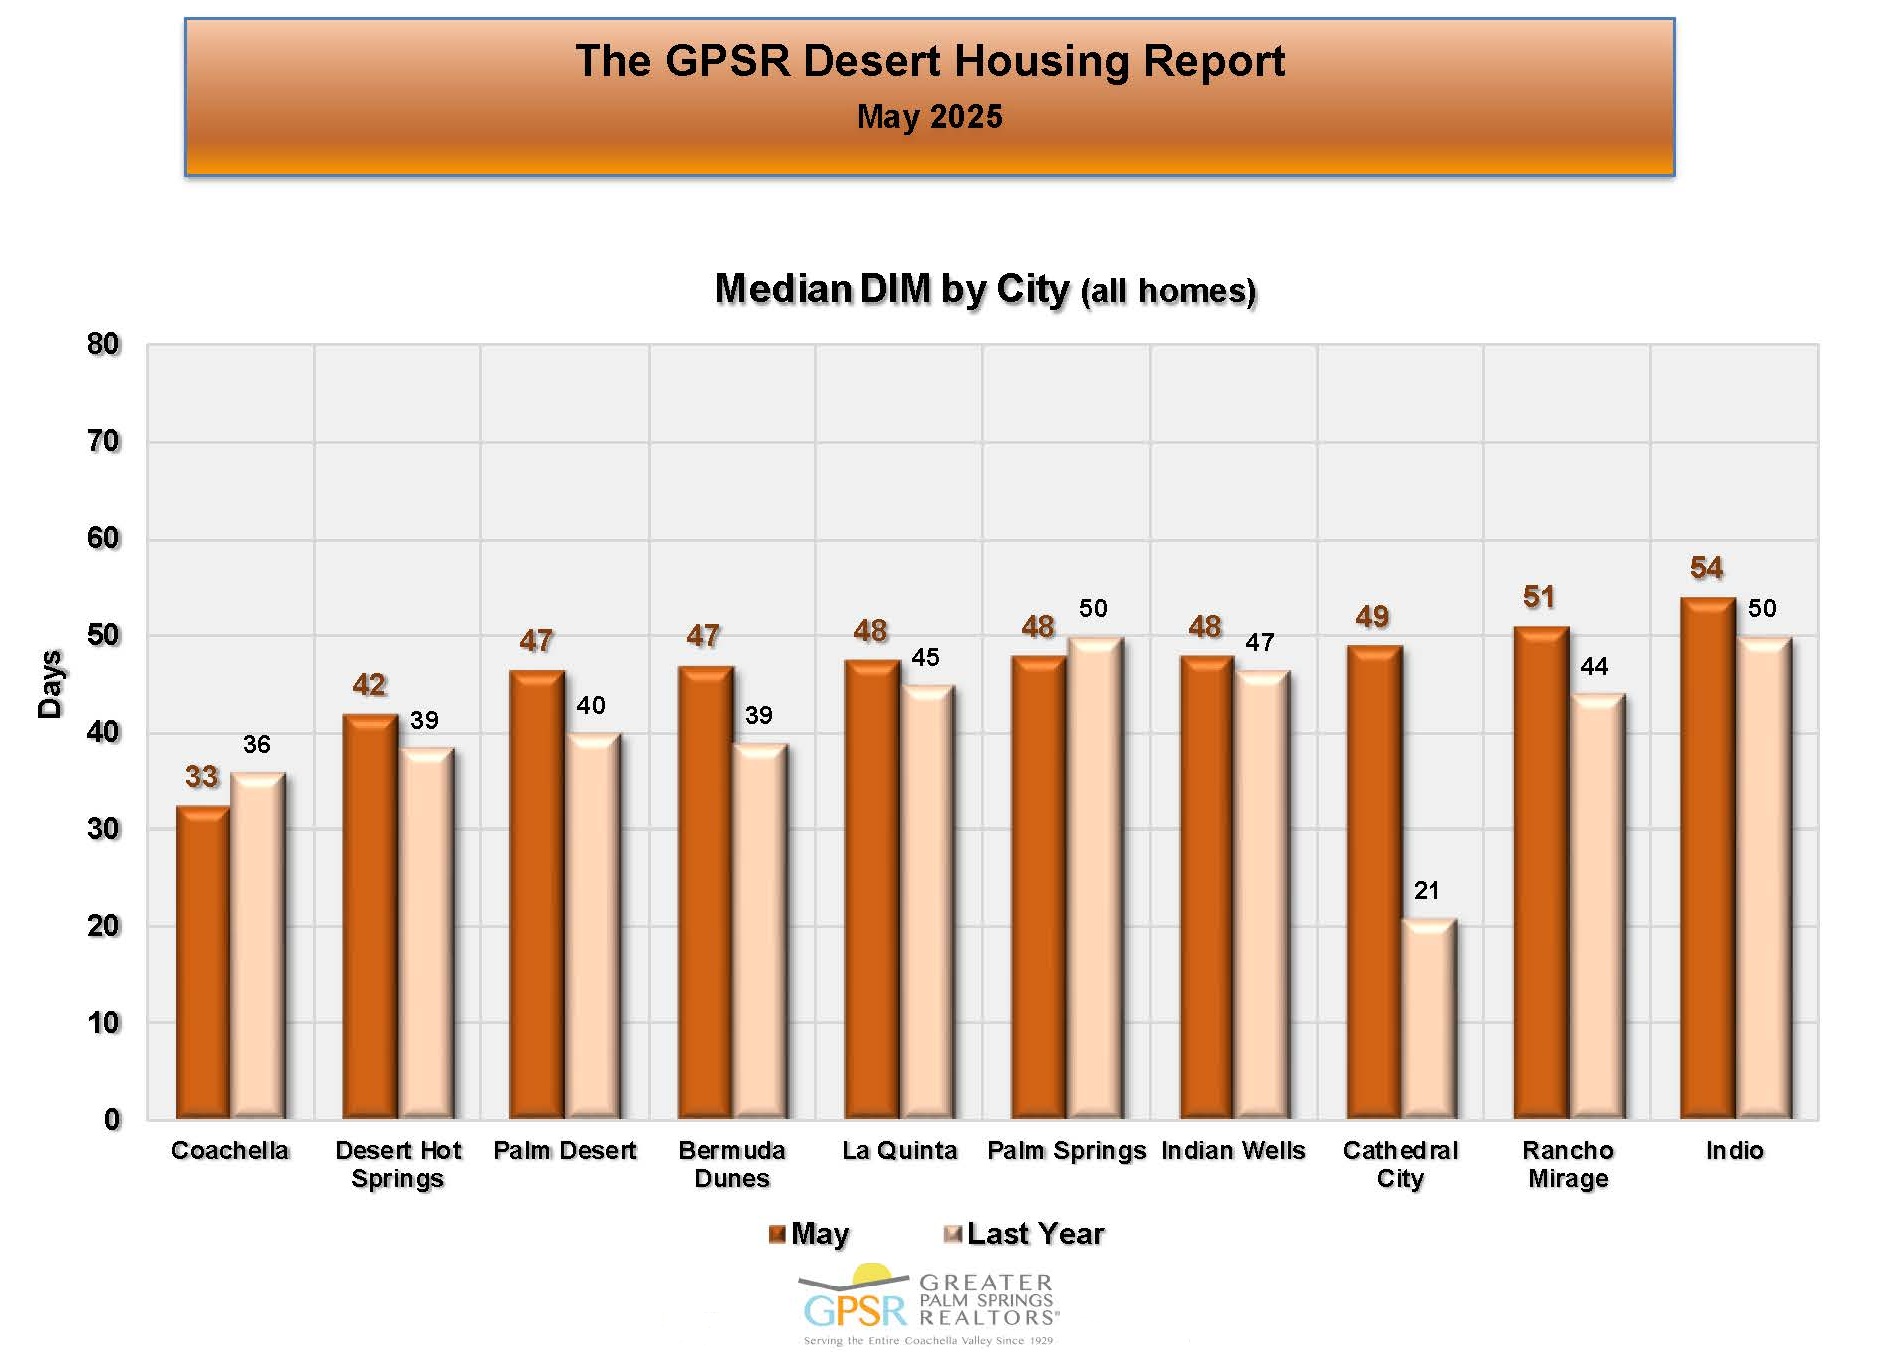 COACHELLA VALLEY MAY DAYS IN THE MARKET BY CITY: In the Coachella Valley in May, Coachella had the shortest median selling time at 33 days (down 3 days or 8.3% from 36 days in May 2024). In the Coachella Valley in May, Indio had the longest median selling time at 54 days (up 4 days or 8% from 50 days in May 2024).
 COACHELLA VALLEY MAY DAYS IN THE MARKET BY PRICE RANGE: In the Coachella Valley in May, the shortest median selling time was for homes priced between $900K and $999K and for homes priced between $1M and $1,999M both at 41 days (in both cases down 1 day or 2.4% from 42 days in May 2024). In the Coachella Valley in May, the longest median selling time was for homes priced under $300K at 58 days (up 15 days or 34.9% from 43 days in May 2024). Market Watch stated that usually, selling times increase with higher priced homes. They felt that they didn’t see that in the current Coachella Valley housing market, which they felt was a positive.
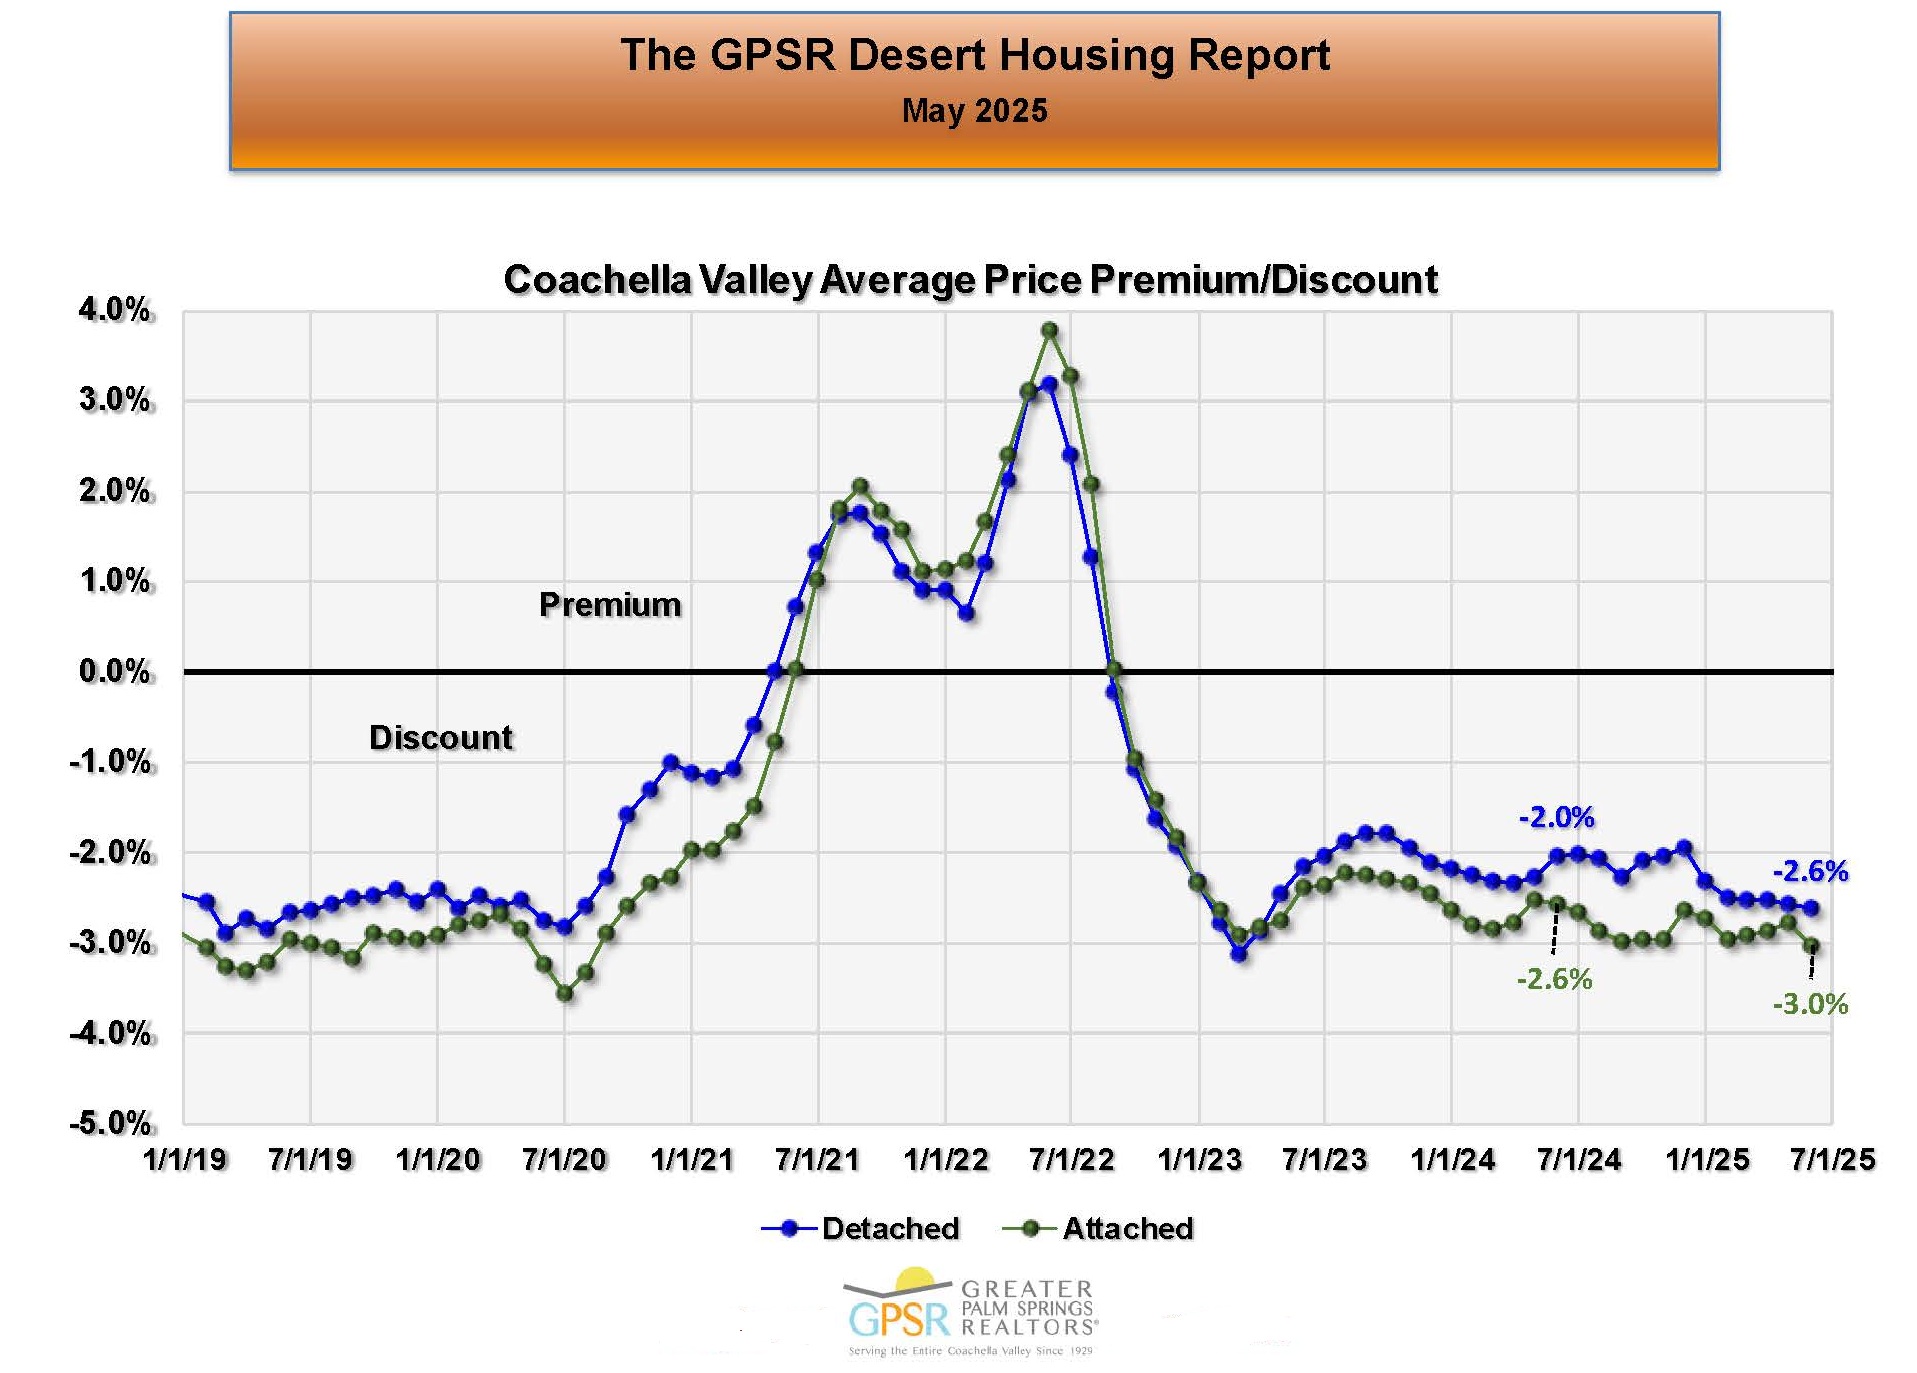 COACHELLA VALLEY MAY AVERAGE SALE PRICE PREMIUM/DISCOUNT: In the Coachella Valley in May, detached homes were selling at an average discount of 2.6% (compared to 2.0% in May 2024). In the Coachella Valley in May, attached homes were selling at a discount of 3.0% (compared to a discount of 2.6% in May 2024). Market Watch pointed out that the premium/discounts for both detached and attached homes seemed to move up and down together. They added that premium/discounts were now back to pre-pandemic norms.
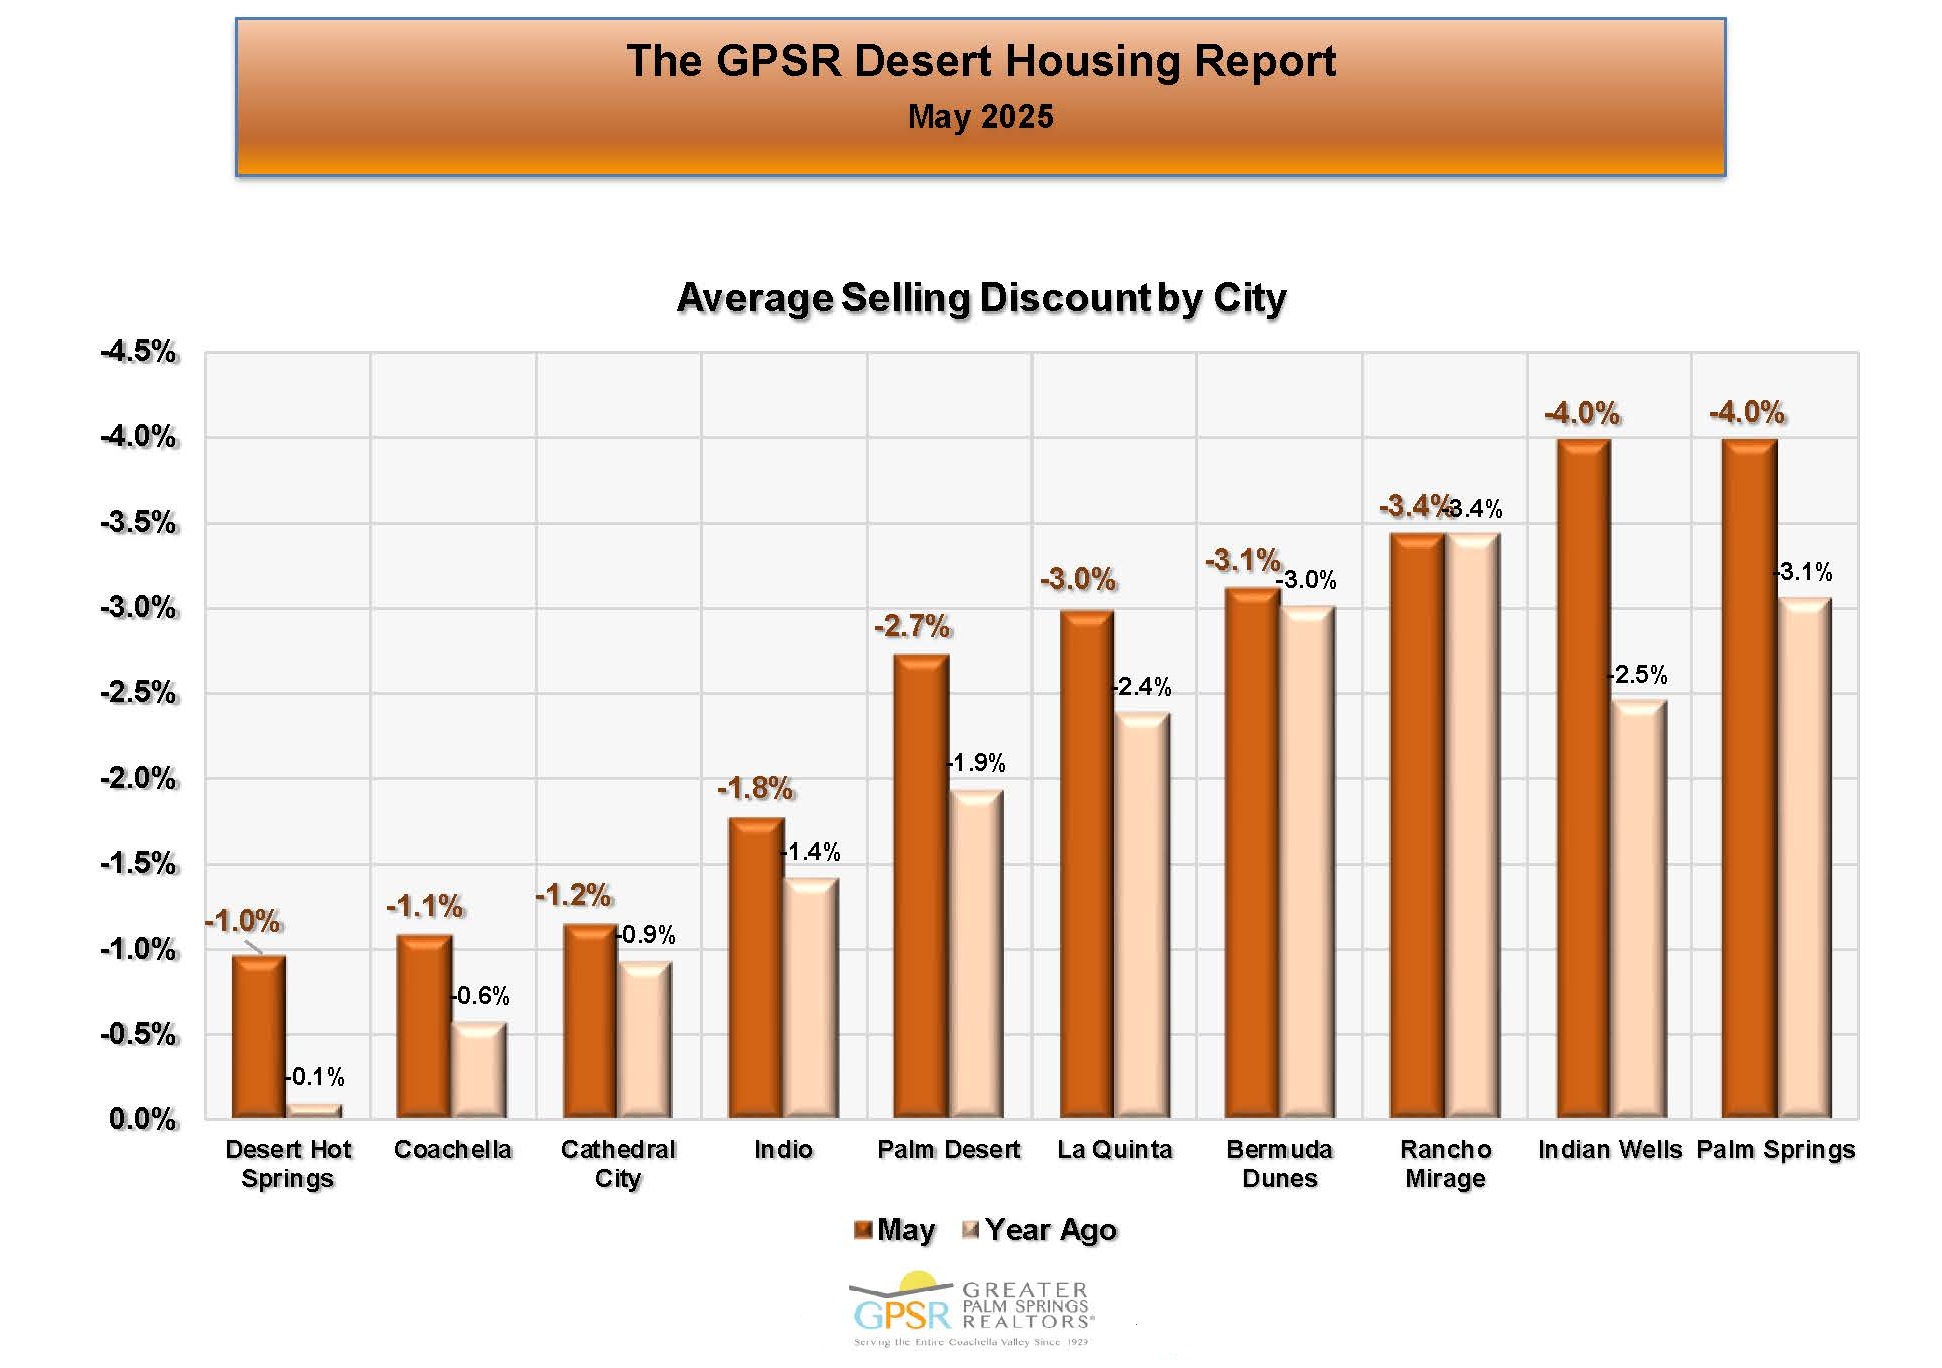 COACHELLA VALLEY MAY AVERAGE SELLING DISCOUNT BY CITY: In the Coachella Valley in May, Desert Hot Springs had the lowest average selling discount at 1% (compared to an average selling discount of 0.1% in May 2024). In the Coachella Valley in May, Indian Wells and Palm Springs had the highest average selling discount at 4.0% (in the case of Indian Well compared to an average selling discount of 2.5% in May 2024 and in the case of Palm Springs compared to an average selling discount of 3.1% in May 2024).
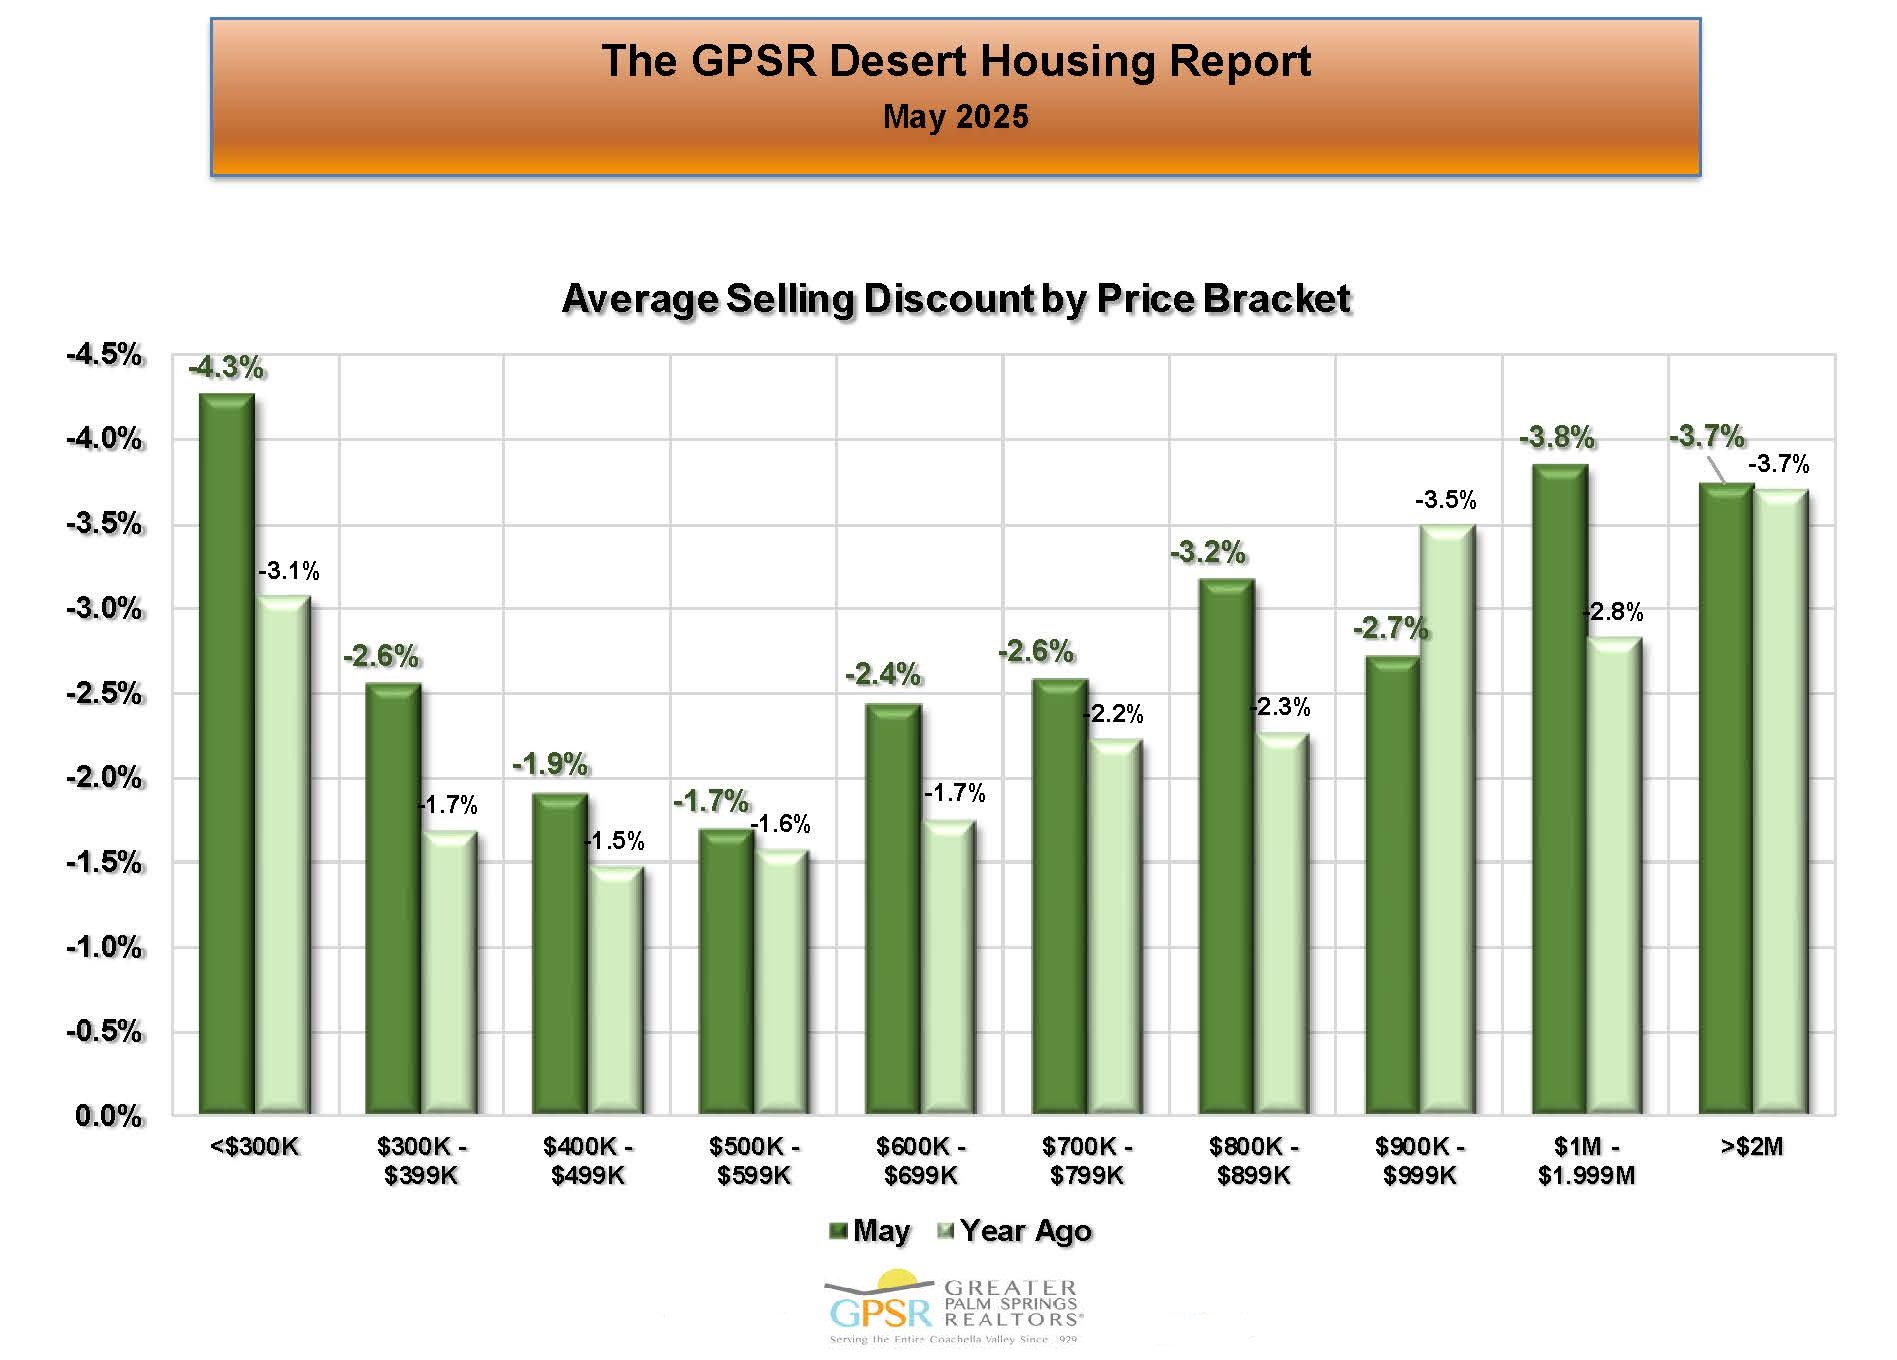
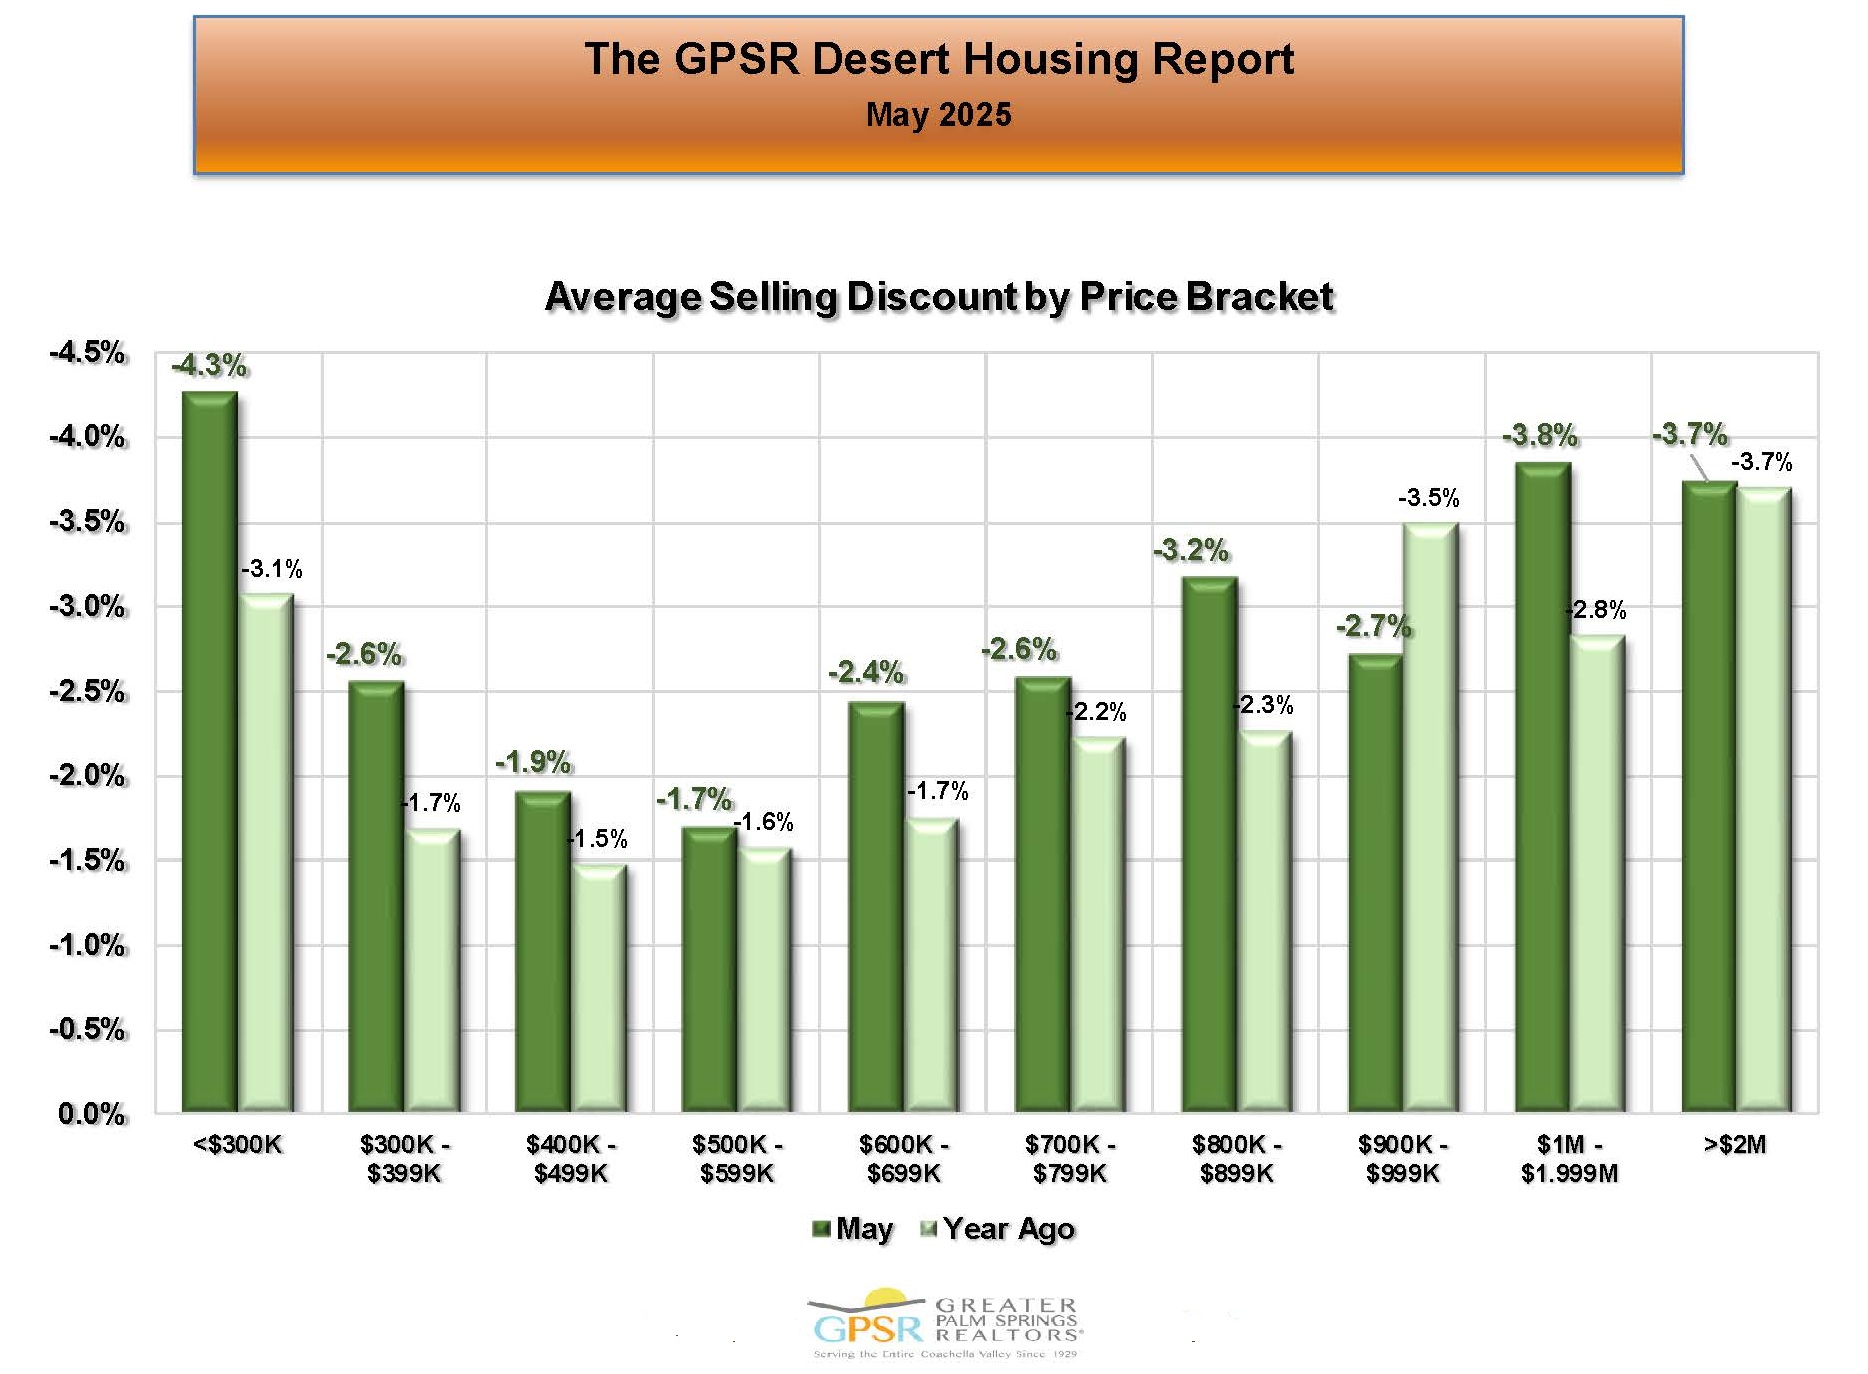 COACHELLA VALLEY MAY AVERAGE SELLING DISCOUNT BY PRICE RANGE: In the Coachella Valley in May, the lowest average selling discount was for homes priced between $500K and $599K at 1.7% (compared to an average selling discount of 1.6% in May 2024). In the Coachella Valley in May, the highest average selling discount was for homes priced under $300K at 4.3% (compared to an average selling discount of 3.1% in May 2024). Market Watch did state that as a rule, price discounts increase with higher priced homes. In the Coachella Valley in May, they pointed out that the mid-range price ranges had the lowest average selling discounts.
 COACHELLA VALLEY MAY PERCENTAGE OF HOMES SELLING ABOVE LIST PRICE: In the Coachella Valley in May, the percentage of homes selling above list price was 10.6% (down from 15.7% in May 2024). Market Watch added that the percentage of homes selling above list price was now back to pre-pandemic levels.
THE BRIGGS GROUP | COLDWELL BANKER | Laurie Briggs - DRE# 01896117 | Tim Briggs - DRE# 01898254 | Coldwell Banker - DRE# 00616212
Our local real estate market experts, Market Watch LLC, have just released their April 2025 Desert Housing Report. Some of the highlights:
 COACHELLA VALLEY APRIL HOME SALES RECOVERY: In the Coachella Valley in April, home sales were 17% below the pre-pandemic normal average April home sales. The pre-pandemic normal is the average April Coachella Valley home sales over the years 2016, 2017, 2018 and 2019. For comparison, in April 2024, Coachella Valley home sales were 34.6% below the pre-pandemic normal average April home sales
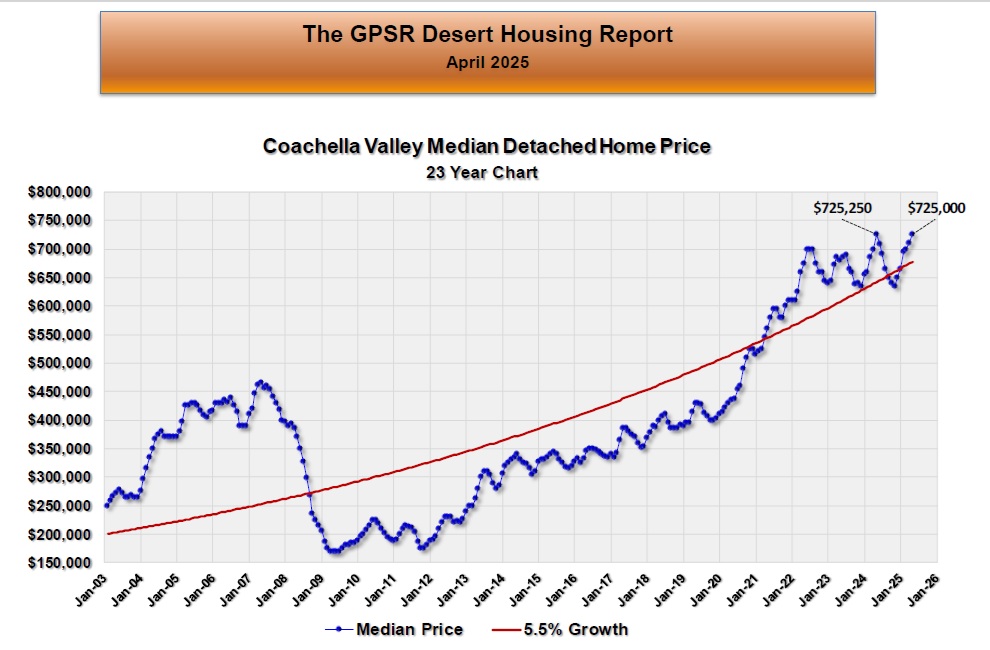 COACHELLA VALLEY APRIL DETACHED HOME MEDIAN PRICE: In April, the median price of a detached home in the Coachella Valley increased for the six straight month to $725,000 (down $250 from $725,250 in April 2024). Market Watch commented that the median detached home price usually hits its seasonal low between September and December, and its high in April or May. They went on to note that the data clearly showed that detached homes have held the price gains made during the pandemic.
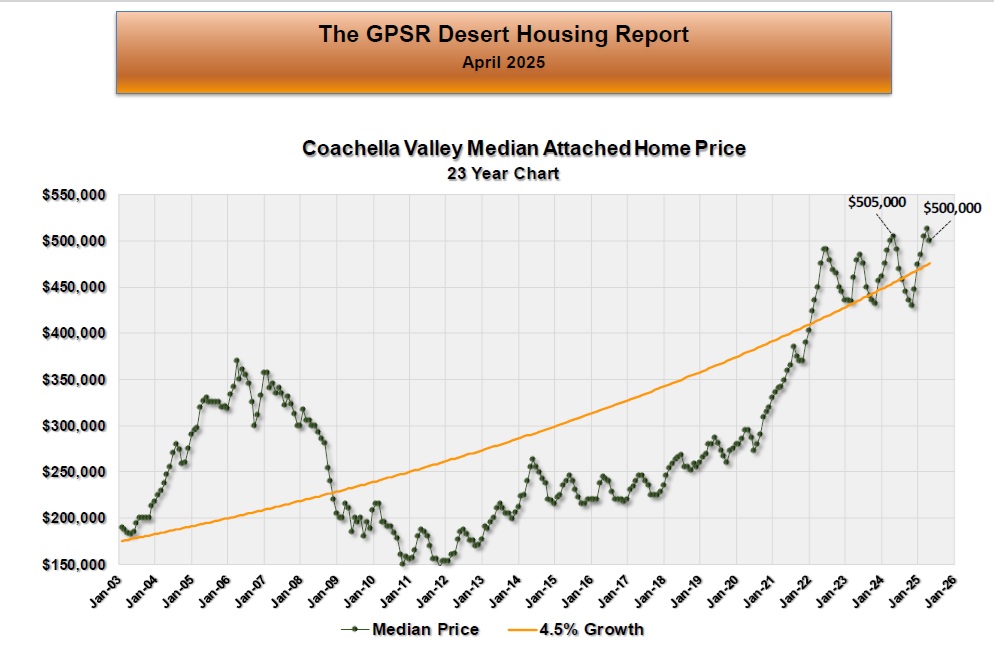 COACHELLA VALLEY APRIL ATTACHED HOME MEDIAN PRICE: In April, the median price of an attached home in the Coachella Valley was $500,000 (down $5,000 or roughly 1% from $505,000 in April 2024). Market Watch commented that the seasonal price swing for attached homes was much larger than for detached homes and that the attached home median price seemed to be following the normal seasonal pattern.
 COACHELLA VALLEY APRIL YEAR-OVER-YEAR CHANGE IN THE PRICE OF THE AVERAGE SIZE HOME BY CITY: In April, the year-over-year price change for the average size detached home by Coachella Valley city ranged from an increase of 22.3% (increasing to $2,261,061 from $1,848,372 in April 2024) for the average size 3,450 sq ft detached home in Indian Wells to a decrease of 3.8% (decreasing to $1,319,790 from $1,371,979 in April 2024) for the average size 2,175 sq ft detached home in Palm Springs. In April, the year-over-year price changes for the average size attached home by Coachella Valley city ranged from an increase of 13.9% (increasing to $792,675 from $695,721 in April 2024) for the average size 1,950 sq ft attached home in Indian Wells to a decrease of 10.5% (decreasing to $634,060 from $708,120 in April 2024) for the average size 1,750 sq ft attached home in La Quinta).
 COACHELLA VALLEY APRIL AVERAGE MONTHLY HOME SALES - THREE MONTH AVERAGE: In April, Coachella Valley home sales averaged (3 month average) 734 home sales (roughly unchanged from 736 home sales in April 2024). Market Watch noted that because of the seasonality in the Coachella Valley’s real estate market, it was difficult to determine where home sales stood on a historical basis. The Sales Recovery information showed that in April Coachella Valley home sales were below pre-pandemic normal by 17%.
 COACHELLA VALLEY APRIL AVERAGE MONTHLY HOME SALES - TWELVE MONTH AVERAGE: In April, Coachella Valley monthly home sales averaged (12-month average, which removes the seasonality from home sales data) 614 home sales (down 15 home sales or 2.4% from 629 average monthly homes sales in April 2024). Market Watch pointed out that the long-term average monthly home sales has been hovering at just over 600 units for two years. They felt that the housing market needs lower mortgage rates, however they also pointed out that the Federal Reserve Board has stopped lowering short-term rates until the effect of the administration’s new economic policies can be determined.
 COACHELLA VALLEY APRIL HOME SALES BY CITY: In the Coachella Valley in April, Palm Desert had the highest average monthly home sales at 172 homes (up 8 home sales or 4.9% from 164 home sales in April 2024), followed by Palm Springs with average monthly home sales at 142 homes (down 19 home sales or 11.8% from 161 home sales in April 2024) and La Quinta with average monthly home sales at 135 homes (up 21 home sales or 18.4% from 114 home sales in April 224). Coachella had the lowest average monthly home sales in April at 8 homes (down 3 home sales or 27.3% from 11 homes sales in April 2024).
 COACHELLA VALLEY APRIL HOME SALES BY PRICE RANGE: The highest average monthly home sales in April in the Coachella Valley was for homes priced between $1M and $1.999M at 126 home sales (down 13 home sales or 9.4% from 139 home sales in April 2024). The lowest average monthly home sales in April in the Coachella Valley was for homes priced between $900K and $999K at 34 homes (up 2 homes or 6.3% from 32 home sales in April 2024).
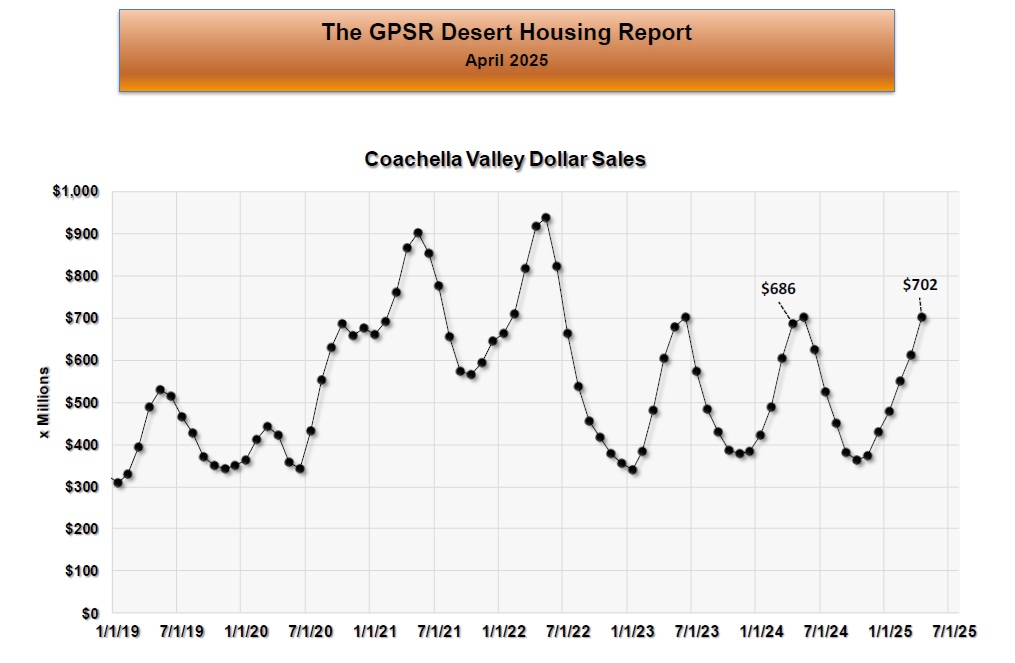 COACHELLA VALLEY APRIL AVERAGE MONTHLY HOME SALES IN DOLLARS: In April in the Coachella Valley, monthly home sales averaged $702M (up $16M or 2.3% from $686M in April 2024).
 COACHELLA VALLEY APRIL AVERAGE MONTHLY HOME SALES IN DOLLARS BY CITY: Market Watch noted that home sales in dollars by city were comparable to April 2024 except in La Quinta (where monthly average home sales of $182M were higher by $47M or 34.8% from $135M in April 2024) and in Palm Springs ((where monthly average home sales of $132M were lower by $35M or 21% from $167M in April 2024).
 COACHELLA VALLEY APRIL AVERAGE MONTHLY HOME SALES IN DOLLARS BY PRICE RANGE: In April in the Coachella Valley, by far the largest monthly average home sales in dollars were for homes priced over $2M at $222M (up $33M or 17.5% from 189M in April 2024). This was closely followed by monthly average home sales in dollars for homes priced between $1M and $1.999M at $173M (down $19M or 9.9% from monthly average home sales of $192M in April 2024). Market Watch did note that monthly average home sales in dollars in these two ranges continued to account for 50% of all dollar home sales in the Coachella Valley.
 COACHELLA VALLEY MAY 1ST HOME INVENTORY: On May 1st, the Coachella Valley home inventory was 3,799 units (up 1,349 homes or 55.1% from 2,450 homes on May 1st, 2024). Market Watch explained that home inventory has been improving, and current numbers were now comparable to inventory before the pandemic. The also noted that the usual seasonal pattern now suggests that inventory is probably near its peak entering into May.
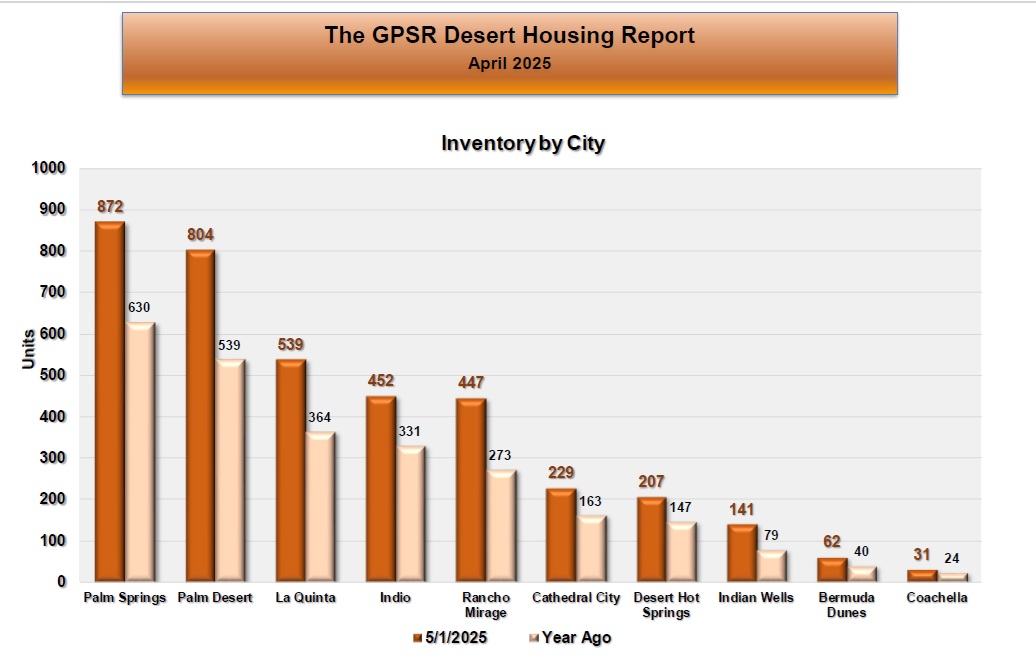 COACHELLA VALLEY MAY 1ST HOME INVENTORY BY CITY: On May 1st in the Coachella Valley, the city with the highest inventory level was Palm Springs at 872 homes (up 242 homes or 38.4% from 630 homes on May 1st, 2024). The city with the lowest inventory level on May 1st was Coachella at 31 homes (up 7 homes or 29.2% from 24 homes on May 1st, 2024). Market Watcj noted that this data could help identify those cities where homeowners had the greatest selling interest and how it compared to last year.
 COACHELLA VALLEY MAY 1ST HOME INVENTORY BY PRICE RANGE: On May 1st in the Coachella Valley, the highest inventory level was for homes priced between $1M and $1.999M at 697 homes (up 225 homes or 47.7% from 472 homes on May 1st, 2024). On May 1st, the lowest inventory was for homes priced under $300K at 175 homes (up 56 homes or 47.1% from 119 homes on May 1st, 2024). Market Watch noted that this data could help to locate those price ranges where home sales might be responsible for the growth or contraction of inventory.
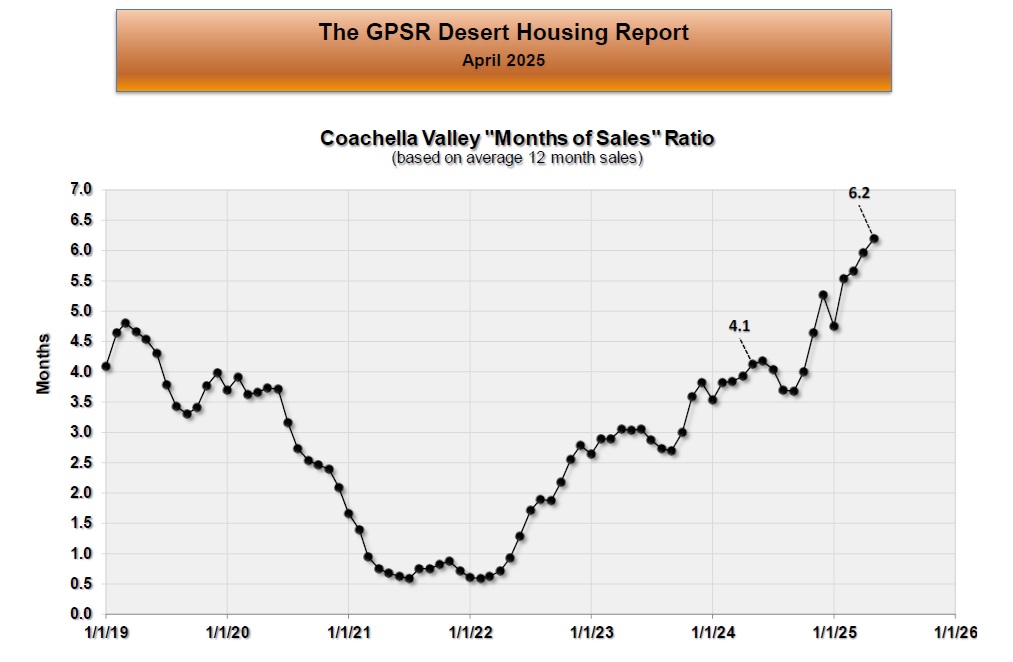 COACHELLA VALLEY MAY 1ST REGIONAL MONTHS OF SALES RATIO: On May 1st, the Coachella Valley’s months of sales ratio was 6.2 months (up 2.1 months or 51.2% from 4.1 months on May 1st, 2024). Market Watch commented that this fundamental ratio, which measures housing supply and demand, was now above pre-pandemic levels. They further explained that while inventory has recovered, because of low sales, supply is beginning to exceed demand. They felt that this should not cause a problem for home prices unless it begins to extend average selling times.
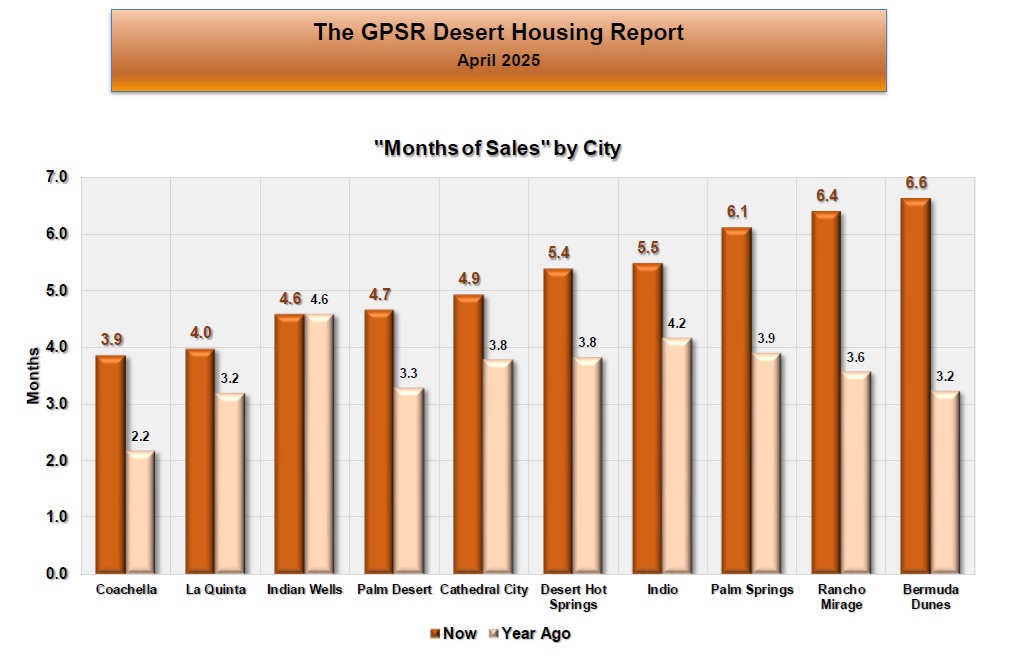 COACHELLA VALLEY MAY 1ST REGIONAL MONTHS OF SALES RATIO BY CITY: On May 1st, the highest months of sales ratio was in Bermuda Dunes at 6.6 months (up 3.4 months or 106% from 3.2 months on May 1st, 2024). On May 1st, the lowest months of sales ration was in Coachella at 3.9 months (up 1/7 months or 77.3% from 2.2 months on May 1st, 2024). Market Watch stated that since months of sales ratios were really the supply-demand equation for housing, this data showed that the Coachella Valley housing market is becoming supply heavy. If the ratios move much higher, it will begin to increase selling times eventually putting downward pressure on home prices.
 COACHELLA VALLEY MAY 1ST REGIONAL MONTHS OF SALES RATIO BY PRICE RANGE: On May 1st, the highest months of sales ratio was for homes priced between $800K and $899K at 6.6 months (up 2.1 months or 46.7% from 4.5 months on May 1st, 2024). On May 1st, the lowest months of sales ratio was for homes priced between $300K and $399K at 4.5 months (up 1.6 months or 55.2% from 2.9 months on May 1st, 2024). Market Watch commented that since months of sales ratios were really the supply-demand equation for housing, the large increases in months of sales ratios over last year showed that housing supply is starting to exceed demand in almost all price brackets. They added that this hadn’t affected prices yet and most probably wouldn’t until selling times began to lengthen.
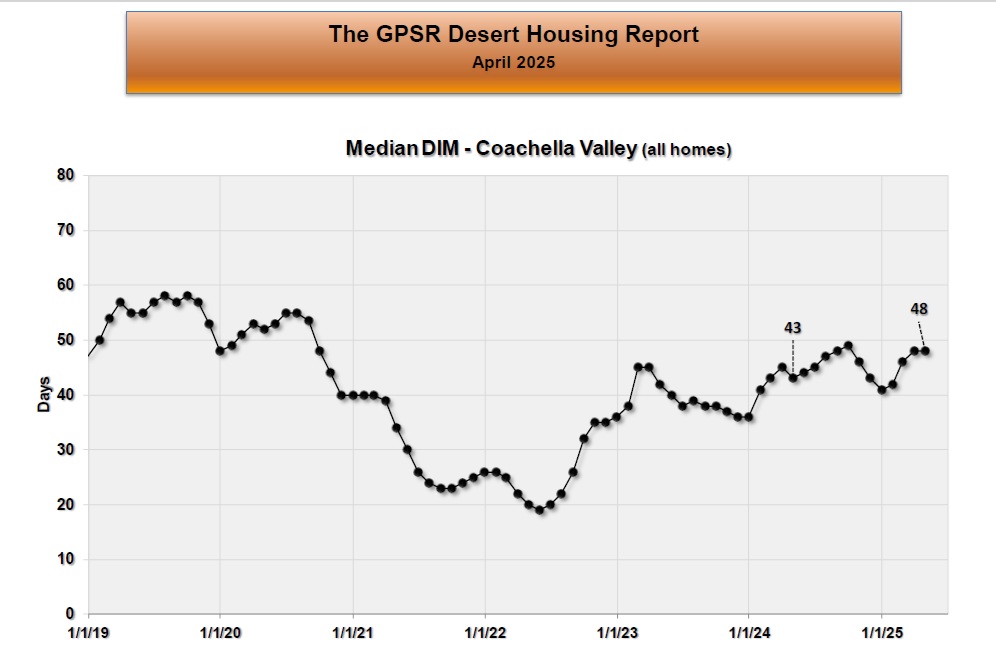 COACHELLA VALLEY APRIL REGIONAL DAYS IN THE MARKET: At the end of April, the median number of days in the market in the Coachella Valley was 48 days (up 5 days or 11.6% from 43 days at the end of April 2024). Market Watch observed that the median days in the market in the Coachella Valley had been running between 40 and 50 days for two years. This includes both detached and attached homes. The current median selling time is near pre-pandemic levels.
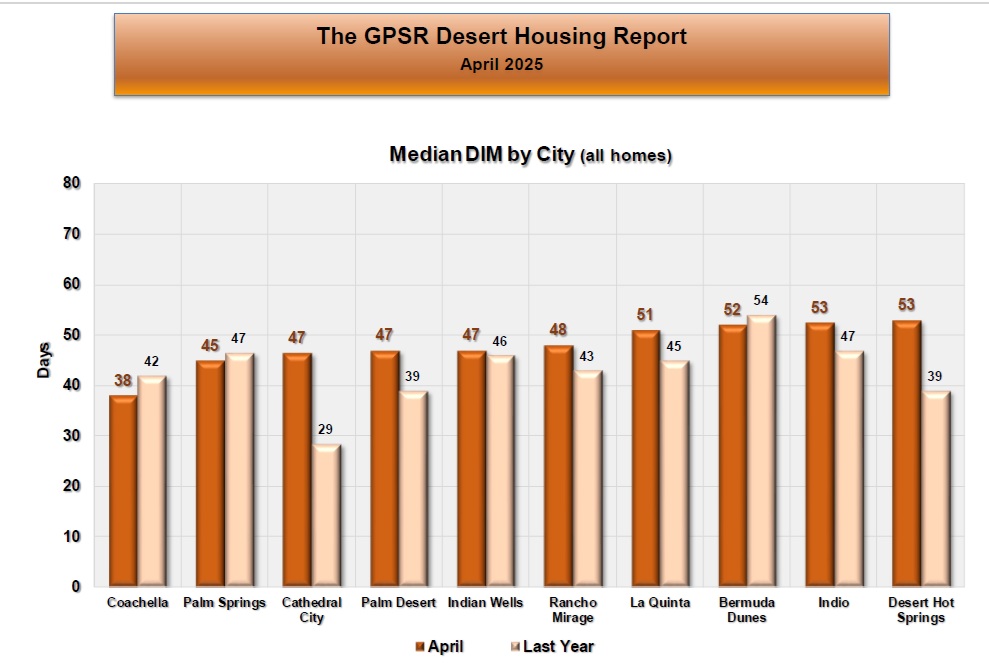 COACHELLA VALLEY APRIL DAYS IN THE MARKET BY CITY: In April, Coachella had the lowest average selling time at 38 days (down 4 days or 9.5% from 42 days in April 2024). In April, Desert Hot Springs and Indio had the highest average selling time at 53 days (in the case of Indio up 6 days or 12.8% from 47 days in April 2024 and in the case of Desert Hot Springs up 14 days or 35.9% from 39 days in April 2024).
 COACHELLA VALLEY APRIL DAYS IN THE MARKET BY PRICE RANGE: In April in the Coachella Valley, the highest average selling time was for homes priced between $400K and $499K at 54 days (up 17 days or 45.9% from 37 days in April 2024).In April, the lowest average selling time was for homes priced between $800K and $899K at 43 days (down 5 days or 10.4% from 48 days in April 2024). Market Watch stated that usually, selling times increase with higher priced homes. They went on to state that in the current Coachella Valley housing market that is not the case, which they felt was a positive.
 COACHELLA VALLEY APRIL AVERAGE PRICE PREMIUM/DISCOUNT FROM LIST PRICE: In April in the Coachella Valley, detached homes were selling at an average discount of 2.6% from list price compared to 2.3% in April 2024. In April, attached homes were selling at a 2.8% discount from list price compared to 2.5% in April 2024. Market Watch pointed out that these discounts were now back to pre-pandemic norms.
 COACHELLA VALLEY APRIL AVERAGE PRICE PREMIUM/DISCOUNT FROM LIST PRICE BY CITY: In April in the Coachella Valley, Coachella had the smallest average discount from list price at 0.2% (down from a discount of 1.2% in April 2024). In April in the Coachella Valley, Palm Springs and Rancho Mirage had the highest average discount from list price at 3.7%.(in the case of Palm Springs, up from a discount of 3.2% in April 2024 and in the case of Rancho Mirage down from an average discount of 3.8% in April 2024). Market Watch noted that in general, those cities with higher priced homes sell at larger discounts.
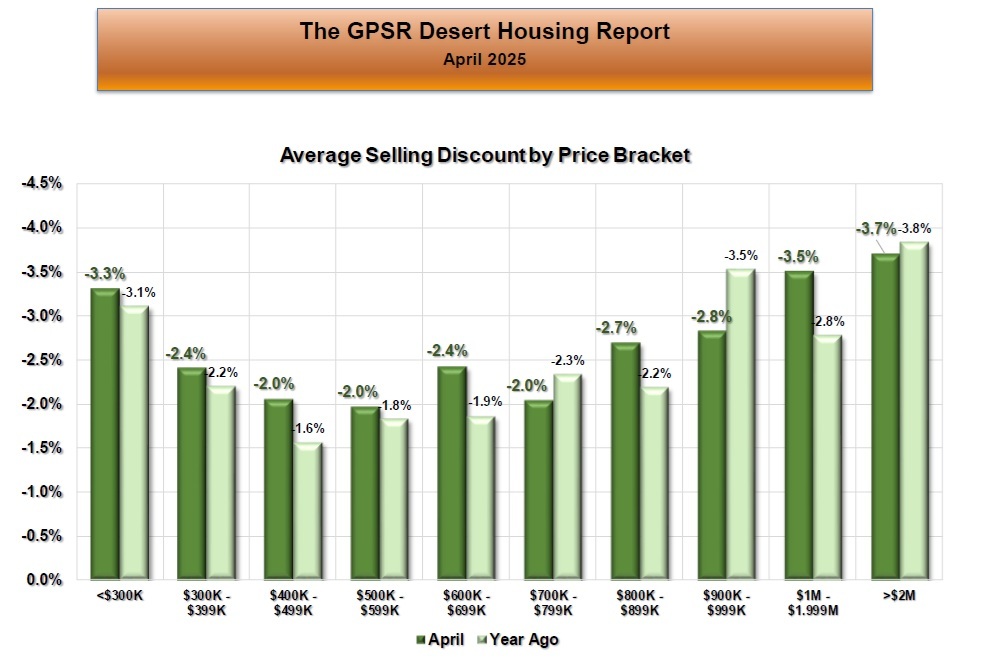 COACHELLA VALLEY APRIL AVERAGE PRICE PREMIUM/DISCOUNT FROM LIST PRICE BY PRICE RANGE: In April in the Coachella Valley, homes priced between $400Kand $499K, homes priced between $500K and $599K and homes priced between $700K and $799K all had the lowest average discount from list price at 2.0%. In April in the Coachella Valley, homes priced over $2M had the highest average discount from list price at 3.7%. Market Watch noted that as a general rule, price discounts increase with higher priced homes. They noted that this data showed the lowest discounts from list price in the mid range price ranges.
 COACHELLA VALLEY APRIL PERCENTAGE OF HOMES SELLING OVER LIST PRICE: In April in the Coachella Valley, the percentage of homes selling over list price was 11.3%. (down 3.5% from 14.8% in April 2024). Market Watch noted that the percentage of Coachella Valley homes selling above list price was now back to pre-pandemic levels.
THE BRIGGS GROUP | COLDWELL BANKER | Laurie Briggs - DRE# 01896117 | Tim Briggs - DRE# 01898254 | Coldwell Banker Realty - DRE# 00616212
Our local real estate market experts, Market Watch LLC, have just released their March 2025 Desert Housing Report. Some of the highlights:
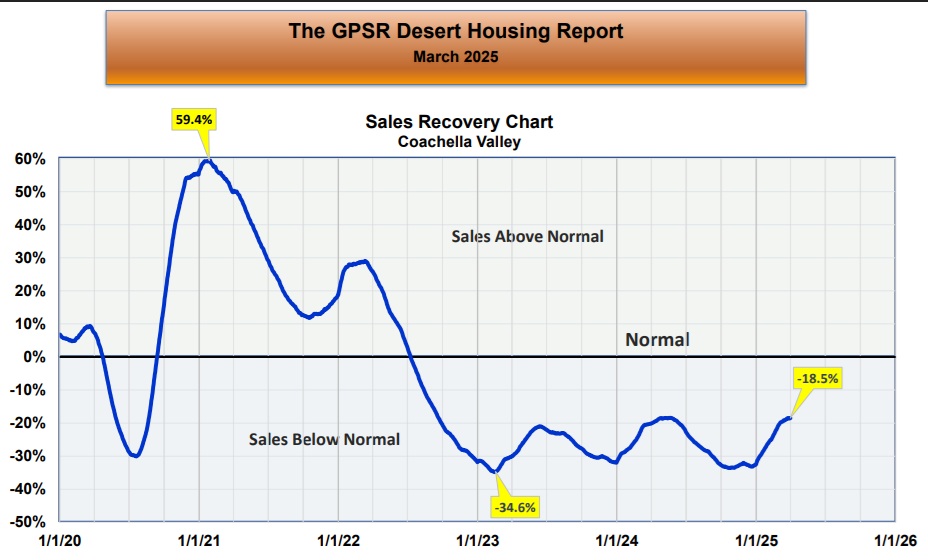 COACHELLA VALLEY MARCH HOME SALES RECOVERY: Home sales have been gradually improving and are now only below the pre-pandemic normal by 18.5% (with normal calculated from March home sales over the four years 2016 through 2019).
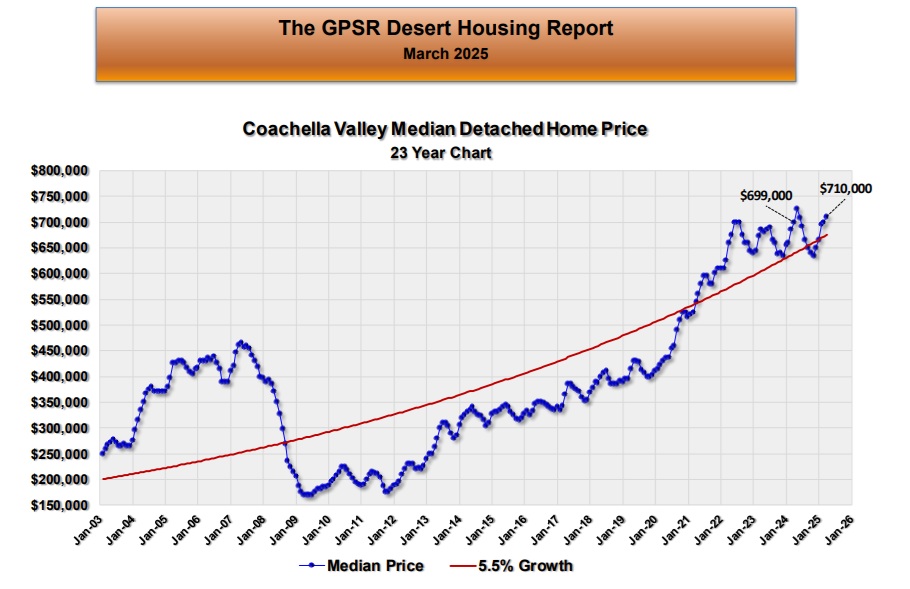 COACHELLA VALLEY MARCH DETACHED HOME MEDIAN PRICE: In March, the Coachella Valley detached home median price increased for the fifth straight month to $710,000 (up $11,000 or 1.6% from $699,000 in March 2024). Market Watch instructed that the median price usually hits its seasonal low between September and December, and that appeared to be the case again in fall 2024/spring 2015. Market Watch also stated that the data clearly showed that there has been little progress in increases to the detached home median price over the last three years.
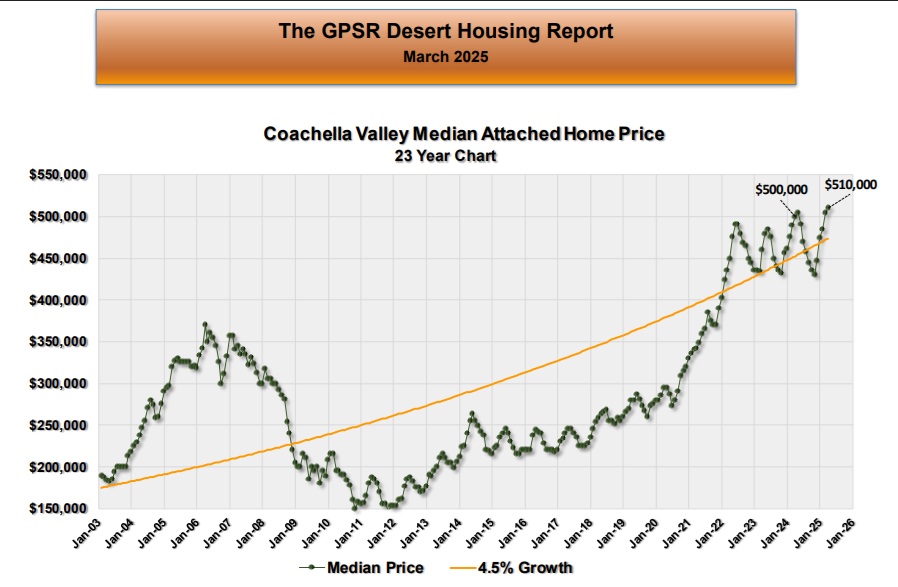 COACHELLA VALLEY MARCH ATTACHED HOME MEDIAN PRICE: In March, the Coachella Valley attached home median price increased to $510,000 (up $10,000 or 2% from $500,000 in March 2024). Market Watch commented that the attached home median price seemed to be following its normal seasonal pattern.
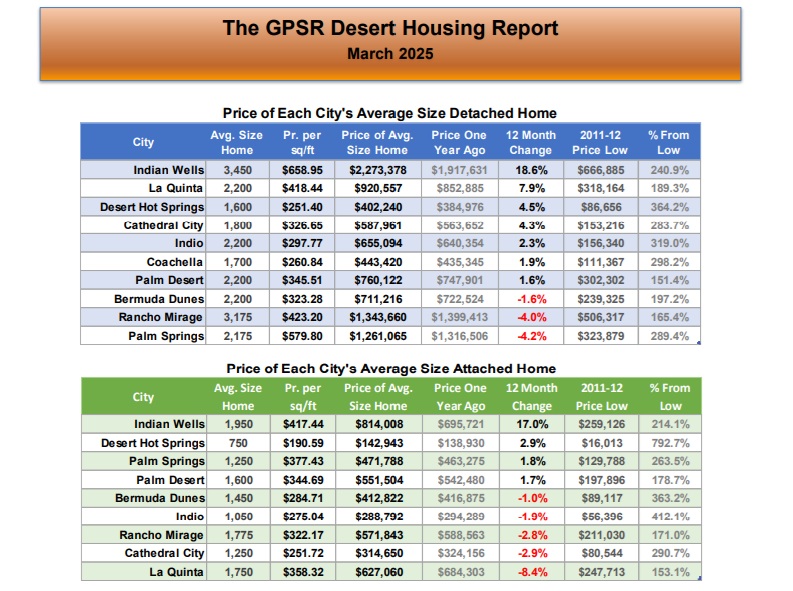 COACHELLA VALLEY MARCH YEAR-OVER-YEAR CHANGE IN THE PRICE OF THE AVERAGE SIZE HOME BY CITY: Year over year price changes for the average size detached home by city ranged from an increase of 18.6% for the average size 3,450 sq ft detached home in Indian Wells to a decrease of 4.2% for the average size 2,175 sq ft detached home in Palm Springs. Year over year price changes for the average size attached home by city ranged from an increase of 17% for the average size 1,950 sq ft attached home in Indian Wells to a decrease of 8.4% for the average size 1,750 sq ft attached home in La Quinta.
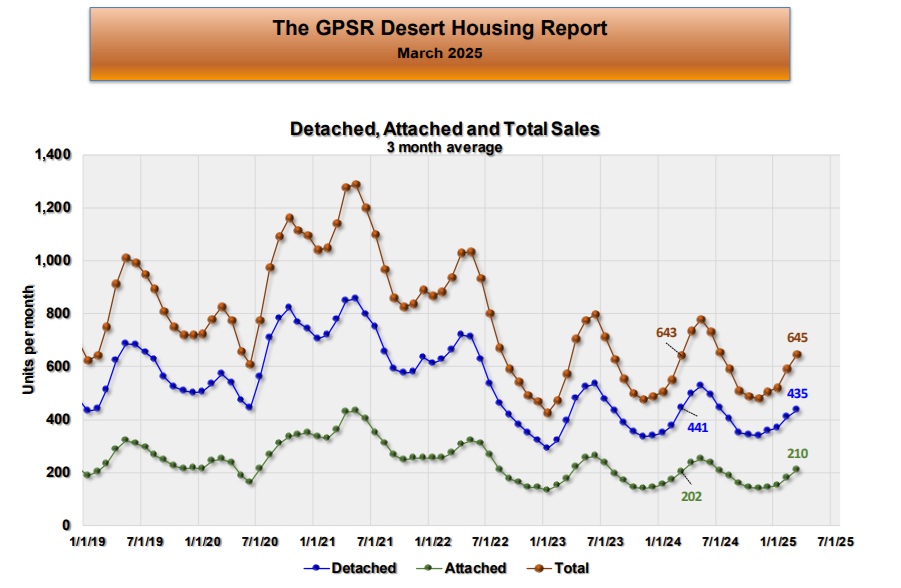 COACHELLA VALLEY MARCH MONTHLY HOME SALES (THREE-MONTH AVERAGE): The three month average of Coachella Valley home sales in March was 645 homes (roughly the same as March 2024 monthly home sales of 643 homes). Market Watch explained that because of the seasonality in Coachella Valley home sales, it was difficult to determine where March home sales stood on a historical basis. However, they added that the Sales Recover data showed that Coachella Valley March home sales were below normal by 18.5%.
 COACHELLA VALLEY MARCH MONTHLY HOME SALES (TWELVE-MONTH AVERAGE): The 12-month average of Coachella Valley home sales in March, which removes seasonality from the home sales data, was 611 homes (down 12 homes or 1.9% from 623 home sales per month in March 2024). March watch noted that the 12-month average of home sales in the Coachella Valleys has hovered just over 600 homes for the last two years. They stated that the housing market needs lower mortgage rates, but that the Federal Reserve Board has stopped lowering short-term rates until the effect of the administration’s new economic policies can be determined.
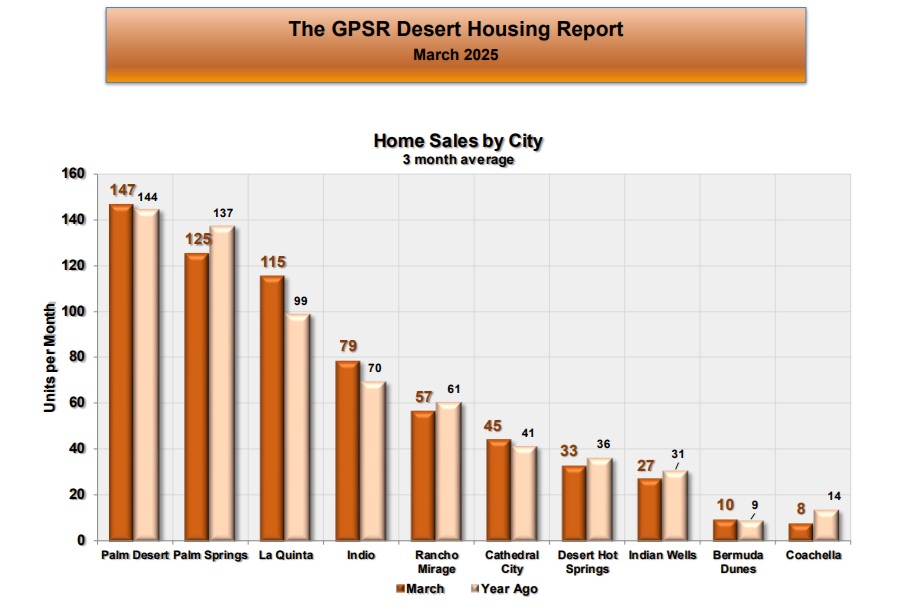 COACHELLA VALLEY MARCH MONTHLY HOME SALES BY CITY: The highest monthly home sales in the Coachella Valley in March were in Palm Desert at 147 homes (up 3 homes or 2% from 144 homes in March 2024), followed by Palm Springs at 125 homes (down 12 homes or 8.6% from 137 homes in March 2024) and La Quinta at 115 homes (up16 homes or 16.2% from 99 homes in March 2024). The lowest monthly home sales in the Coachella Valley in March were in Coachella at 8 homes (down 6 homes or 42.9% from 14 homes in March 2024)
 COACHELLA VALLEY MARCH MONTHLY HOME SALES BY PRICE RANGE: The highest monthly Coachella Valley March home sales were for homes priced between $1M and $1.99M at 111 homes (down 4 homes or 3.5% from 115 homes in March 2024). The lowest monthly Coachella Valley March home sales were for homes priced between $900K and $999K at 31 homes (up 6 homes or 24% from 25 homes in March 2024).
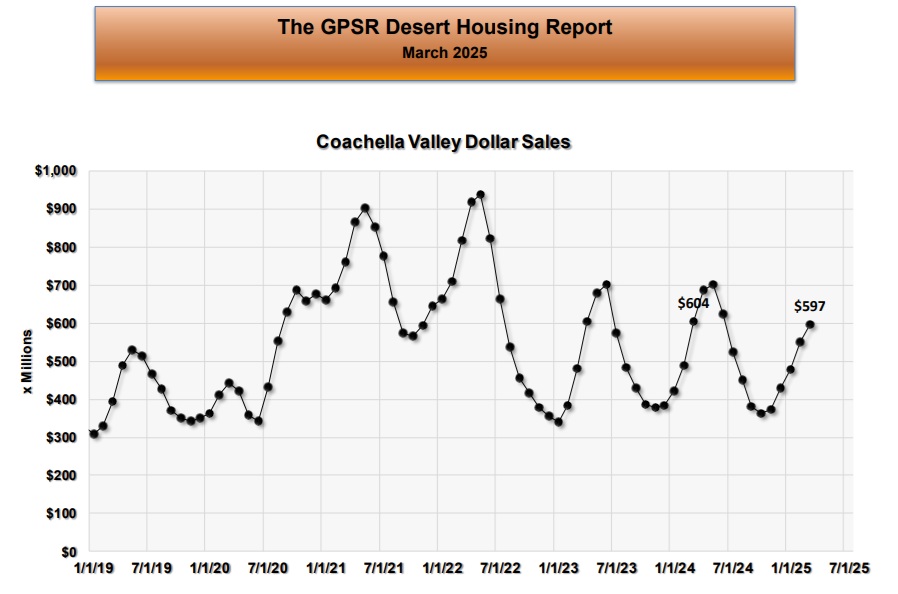 COACHELLA VALLEY MARCH MONTHLY HOME SALES IN DOLLARS: In March, Coachella Valley home sales in dollars were $597 million (down $7 million or 1.2% from monthly home sales of $604 million in March 2024).
 COACHELLA VALLEY MARCH MONTHLY HOME SALES IN DOLLARS BY CITY: In March, in the Coachella Valley, monthly home sales were the highest in La Quinta at $148 million (up $21 million or 16.5% from monthly home sales of $127 million in March 2024). The lowest monthly home sales in March were in Coachella at $4 million (down $3 million or 42.9% from monthly home sales of $7 million in March 2024).
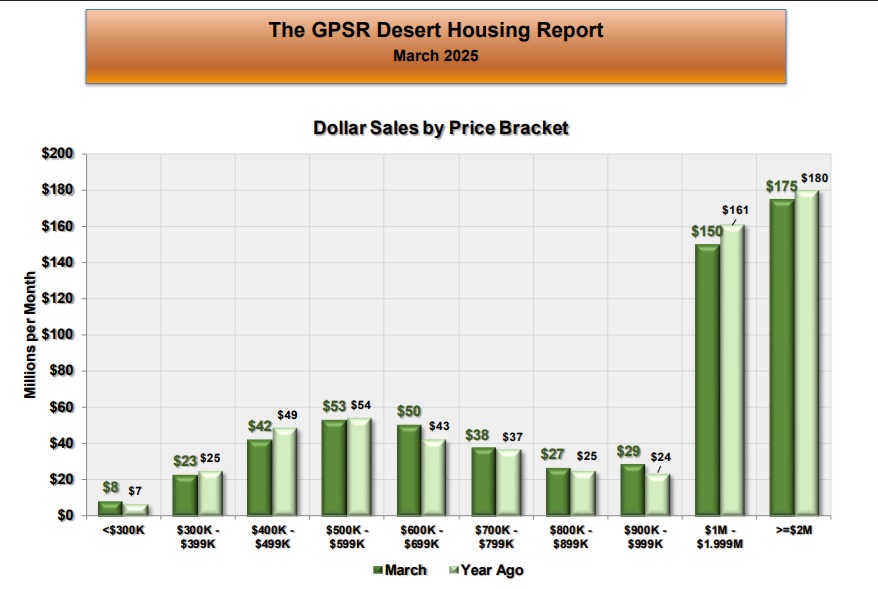 COACHELLA VALLEY MARCH MONTHLY HOME SALES IN DOLLARS BY PRICE RANGE: In March, in the Coachella Valley, monthly home sales were the highest for homes priced over $2 million at $175 million (down $5 million or 2.8% from monthly home sales of $180 million in March 2024). The lowest March monthly home sales were for homes priced under $300K at $8 million (up $1 million or 14.3% from monthly home sales of $7 million in March 2024). Market Watch pointed out that in March monthly Coachella Valley home sales (in dollars) for homes priced over $1 million continued to account for 50% of all home sales in dollars).
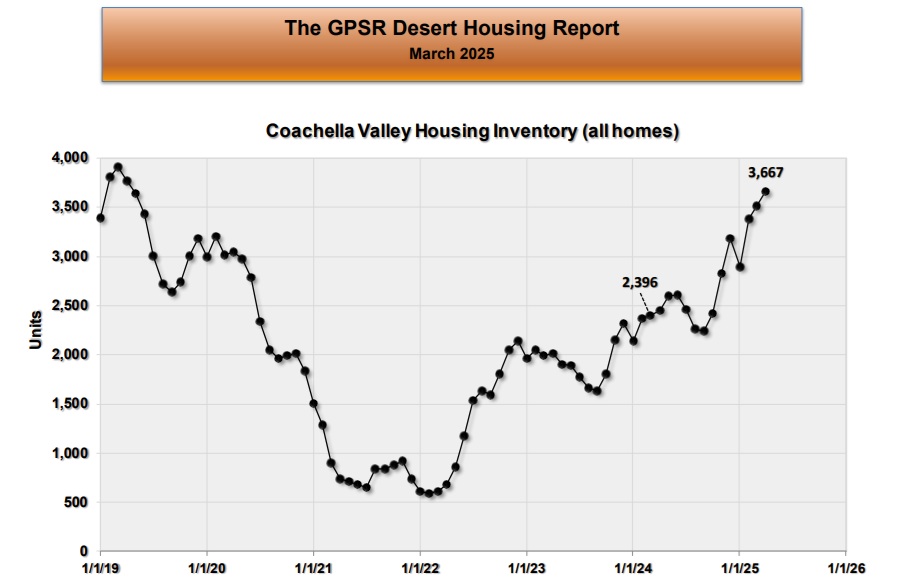 COACHELLA VALLEY APRIL 1ST HOME INVENTORY: On April 1st, Coachella Valley home inventory was 3,667 homes (up 1,271 homes or 53% from 2,396 homes on April 1st, 2024). Market Watch commented that Coachella Valley home inventory has been improving, with the current level comparable to inventory levels before the pandemic. They further noted that the seasonal pattern now suggests that home inventory is near its peak passing into April.
 COACHELLA VALLEY APRIL 1ST HOME INVENTORY BY CITY: On April 1st, the highest Coachella Valley home inventory by city was in Palm Springs at 823 homes (up 253 homes or 44.4% from 570 homes on April 1st, 2024). On April 1st, the lowest Coachella Valley home inventory by city was in Coachella at 31 homes (up 14 homes or 82.4% from 17 homes on April 1st, 2024). Market Watch believed that this data could help agents know what cities had homeowners with the greatest selling interest and how it compared to last year.
 COACHELLA VALLEY APRIL 1ST HOME INVENTORY BY PRICE RANGE: On April 1st, the highest Coachella Valley home inventory was for homes priced between $1M and $1,999M at 667 homes (up 221 homes or 49.6% from 446 homes on April 1st, 2024). On April 1st, the lowest Coachella Valley home inventory was for homes priced under $300K at 177 homes (up 53 homes or 42.7% from 124 homes on April 1sr, 2024). Market Watch commented that this data could help locate what home sales by price range might be responsible for the growth or contraction of home inventory.
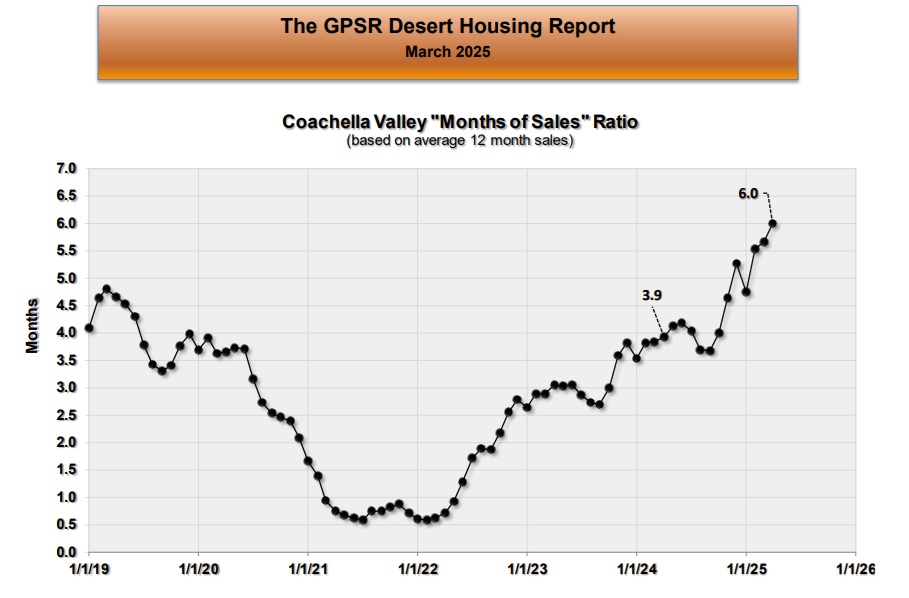 COACHELLA VALLEY APRIL 1ST MONTHS OF SALES RATIO: On April 1st, the Coachella Valley months of sales ratio was 6.0 months (up 2.1 months from 3.9 months on April 1st, 2024). Market Watch pointed out that this fundamental ratio, which measures housing supply and demand, was now above pre-pandemic levels. They added that while home inventory has recovered, because of low sales, home supply is beginning to exceed demand. They felt that this should not cause a problem for home prices unless it begins to extend average selling times.
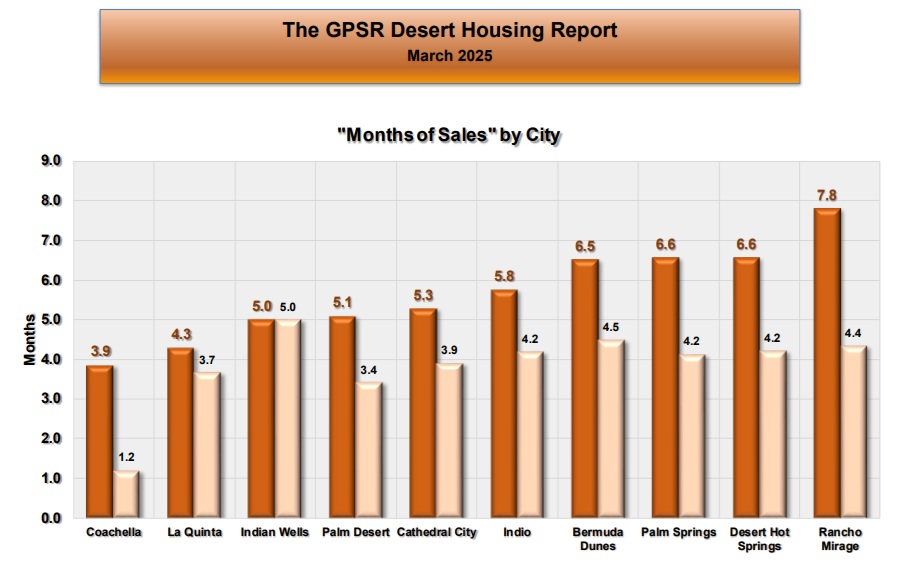 COACHELLA VALLEY APRIL 1ST MONTHS OF SALES RATIO BY CITY: On April 1st, the lowest months of sales ratio in the Coachella Valley was in Coachella at 3.9 months (up from 1.2 months on April 1st, 2024). On April 1st, the highest months of sales ratio in the Coachella Valley was in Rancho Mirage at 7.8 months (up from 4.4 months on April 1st, 2024). Market Watch stated that since months of sales ratios are really the supply-demand equation for housing, the increases in months of sales ratios showed that the housing market is becoming supply heavy. They added that if the months of sales ratio moved much higher, selling times would begin to increase which in turn would eventually put a downward pressure on home prices.
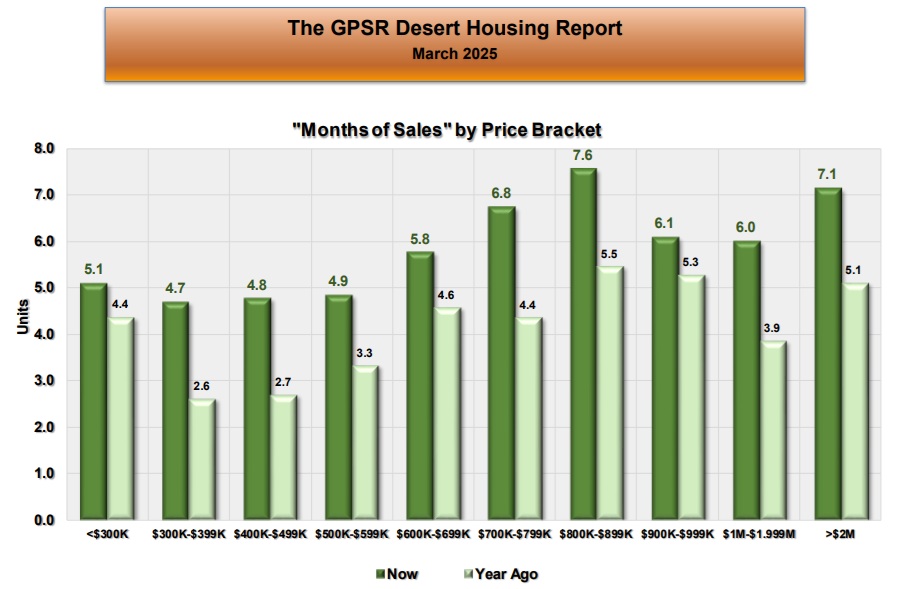 COACHELLA VALLEY APRIL 1ST MONTHS OF SALES RATIO BY PRICE RANGE: On April 1st, the lowest months of sales ratio in the Coachella Valley was for homes priced between $300K and $399K at 4.7 months (up from 2.6 months on April 1st, 2024). On April 1st, the highest months of sales ratio in the Coachella Valley was for homes priced between $800K and $899K at 7.6 months (up from 5.5 months on April 1st, 2024). Market Watch went on the state that these months of sales ratios showed that supply was starting to exceed demand in almost all price brackets. They added that this had not affected home prices yet and most probably would not until selling times began to lengthen.
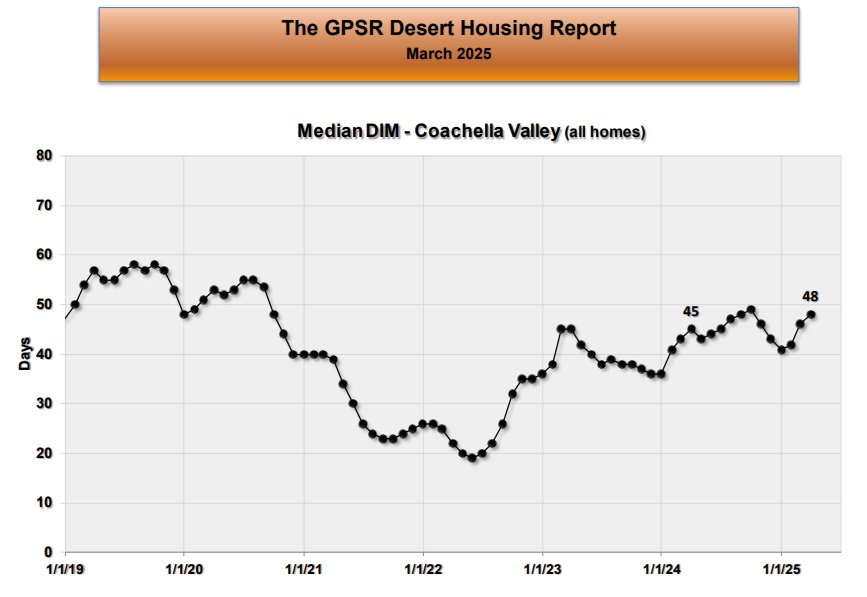 COACHELLA VALLEY MARCH DAYS IN THE MARKET: At the end of March, the median number of days in the market in the Coachella Valley was 48 days (up 3 days from 45 days at the end of March 2024). Market Watch noted that the median selling time in the Coachella Valley has been running between 40 and 50 days for the last two years (near pre-pandemic levels).
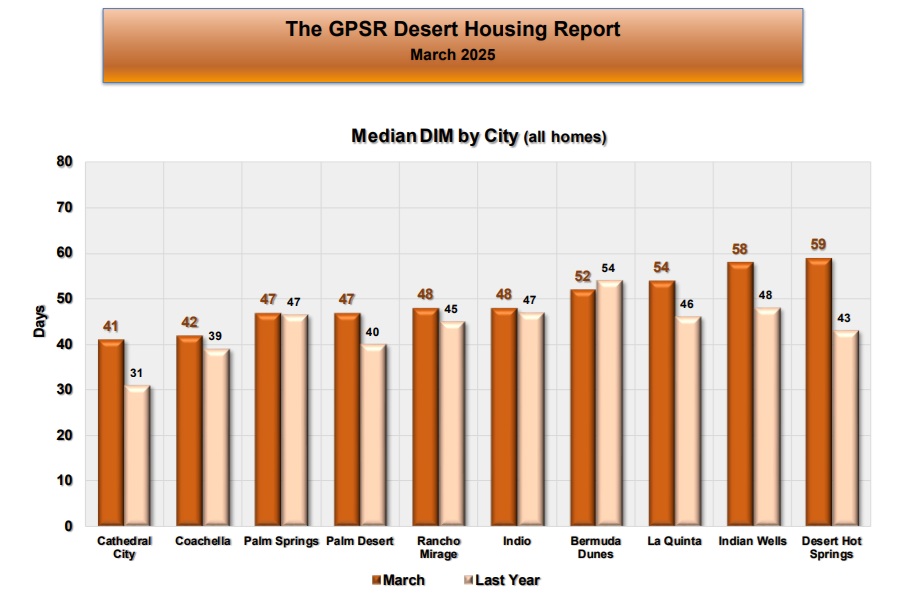 COACHELLA VALLEY MARCH DAYS IN THE MARKET BY CITY: At the end of March in the Coachella Valley, Cathedral City had the lowest average selling time at 41 days (up from 31 days at the end of March 2024). This was followed by Coachella at 42 days (up from 39 days at the end of March 2024) and Palm Springs at 47 days (the same as at the end of March 2024). At the end of March in the Coachella Valley, Desert Hot Springs had the highest median selling time at 59 days (up from 43 days at the end of March 2024).
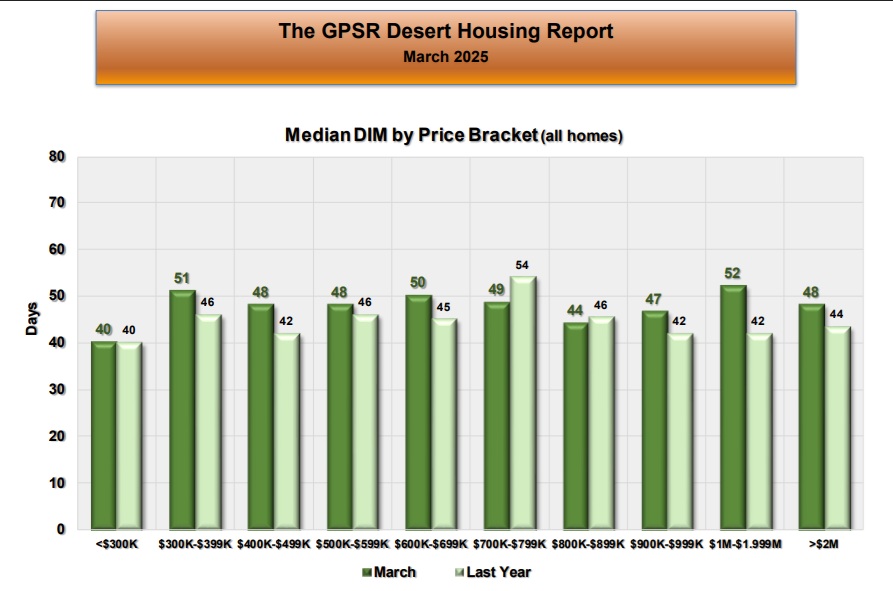 COACHELLA VALLEY MARCH DAYS IN THE MARKET BY PRICE RANGE: At the end of March in the Coachella Valley, the lowest average selling time was for homes priced under $300K at 40 days (the same as at the end of March 2024). At the end of March in the Coachella Valley, the highest median selling time was for homes priced between $1M and $1.999M at 52 days (up from 42 days at the end of March 2024). Market Watch advised looking for any price range with an abnormal number of days in the market. They added that usually selling times increase with higher priced homes. This was not the case in the current Coachella Valley housing market, which they felt was a positive situation.
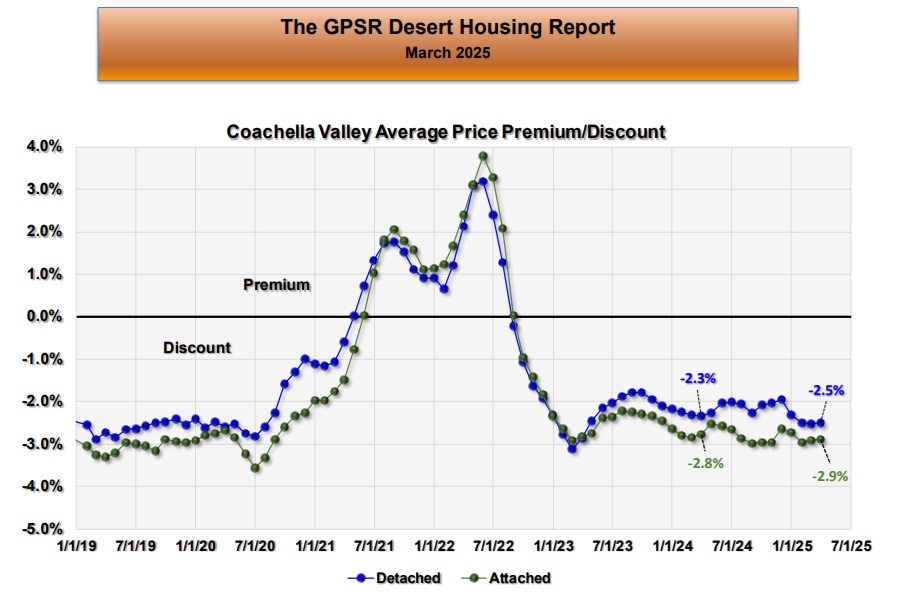 COACHELLA VALLEY MARCH AVERAGE PRICE PREMIUM/DISCOUNT: In March in the Coachella Valley, detached homes were selling at an average discount of 2.5% (compared to 2.3% in March 2024). In March in the Coachella Valley, attached homes were selling at an average discount of 2.9% (compared to 2.8% in March 2024). Market Watch said that the Coachella Valley average price premium/discounts were back to pre-covid norms.
 COACHELLA VALLEY MARCH AVERAGE PRICE DISCOUNT FROM LIST PRICE BY CITY: In March in the Coachella Valley, Coachella had the lowest average discount from list price at 0% (compared to an average discount of 0.8% in March 2024). In March in the Coachella Valley, Palm Springs had the highest average discount from list price at 4.1% (compared to an average discount of 2.6% in March 2024).
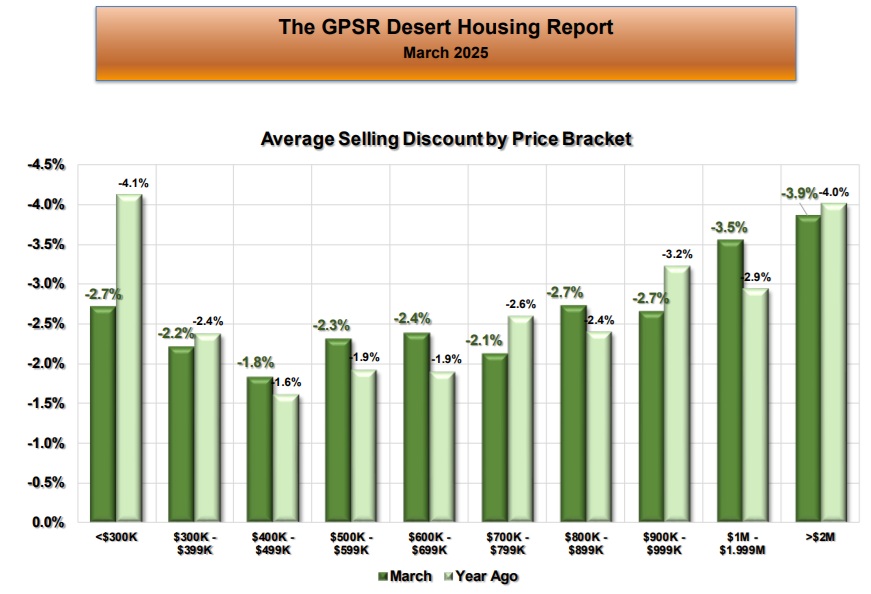 COACHELLA VALLEY MARCH AVERAGE PRICE DISCOUNT FROM LIST PRICE BY PRICE RANGE: In March in the Coachella Valley, the lowest average discount from list price was for homes priced between $400K and $499K at 1.8% (compared to an average discount of 1.6% in March 2024). In March in the Coachella Valley, the highest average discount from list price was for homes priced over $2M at 3.9% (compared to an average discount of 4.0% in March 2024). Market Watch observed that usually price discounts increased with higher priced homes. However, they noted that in March in the Coachella Valley, the lowest discounts occurred in the mid-range price brackets.
 COACHELLA VALLEY MARCH PERCENTAGE OF HOMES SELLING OVER LIST PRICE: In March in the Coachella Valley, the percentage of homes selling over list price was 11.5% (down 1.2% from 14.3% in March 2024). Market Watch stated that the percentage of Coachella Valley homes selling above list price was back to pre pandemic levels.
THE BRIGGS GROUP | COLDWELL BANKER | Laurie Briggs - DRE# 01896117 | Tim Briggs - DRE# 01898254 | Coldwell Banker Realty - DRE# 00616212
Address Search
Follow Us On:


Click on the image below to read our Zillow client reviews:


We are honored to have been named Palm Springs Life Magazine’s list of top Coachella Valley real estate teams.
A big THANK YOU to all our buyers and sellers. We know you have a lot of choices when it comes to selecting a real estate agent and appreciate you placing your trust and confidence in us to advise and assist you. And last but definitely not least, a huge round of applause and thanks to our team and to all of the Coldwell Banker team who help us in so many ways each and every day.