 (Please click on the image above to view our YouTube Shorts video)
Our local Coachella Valley real estate market experts, Market Watch LLC, are out with their August 2022 Desert Housing Report. Some highlights:

COACHELLA VALLEY DETACHED HOME MEDIAN PRICE: The median price of a detached home in the Coachella Valley in August was $682,000. While this is down from the detached home median price of $710,000 in July, it is still an increase of 17.4% from the detached home median price of $581,500 in August 2021. Market Watch noted that this time of the year is historically a seasonal period where home prices usually slow or even decline. They felt that while some of this decrease in the detached home median price was seasonal, most of the decrease reflects the general corrective turn that is occurring in home prices everywhere.
 COACHELLA VALLEY ATTACHED HOME MEDIAN PRICE: The median price of an attached homes in the Coachella Valley in August was $467,500. While this is down from the attached home median price of $479,500 in July, it is still an increase of 25.2% from the attached home median price of $373,500 in August 2021. Market Watch pointed out that historically, seasonal price corrections of roughly 10% usually occur in the Coachella Valley attached home market during summer. Market Watch acknowledged that it is difficult to distinguish this seasonal price decrease from a real price correction, but they stated that they would not be surprised to see a larger than normal adjustment during this year’s seasonal period, resulting in an attached home median price of around $435,000.
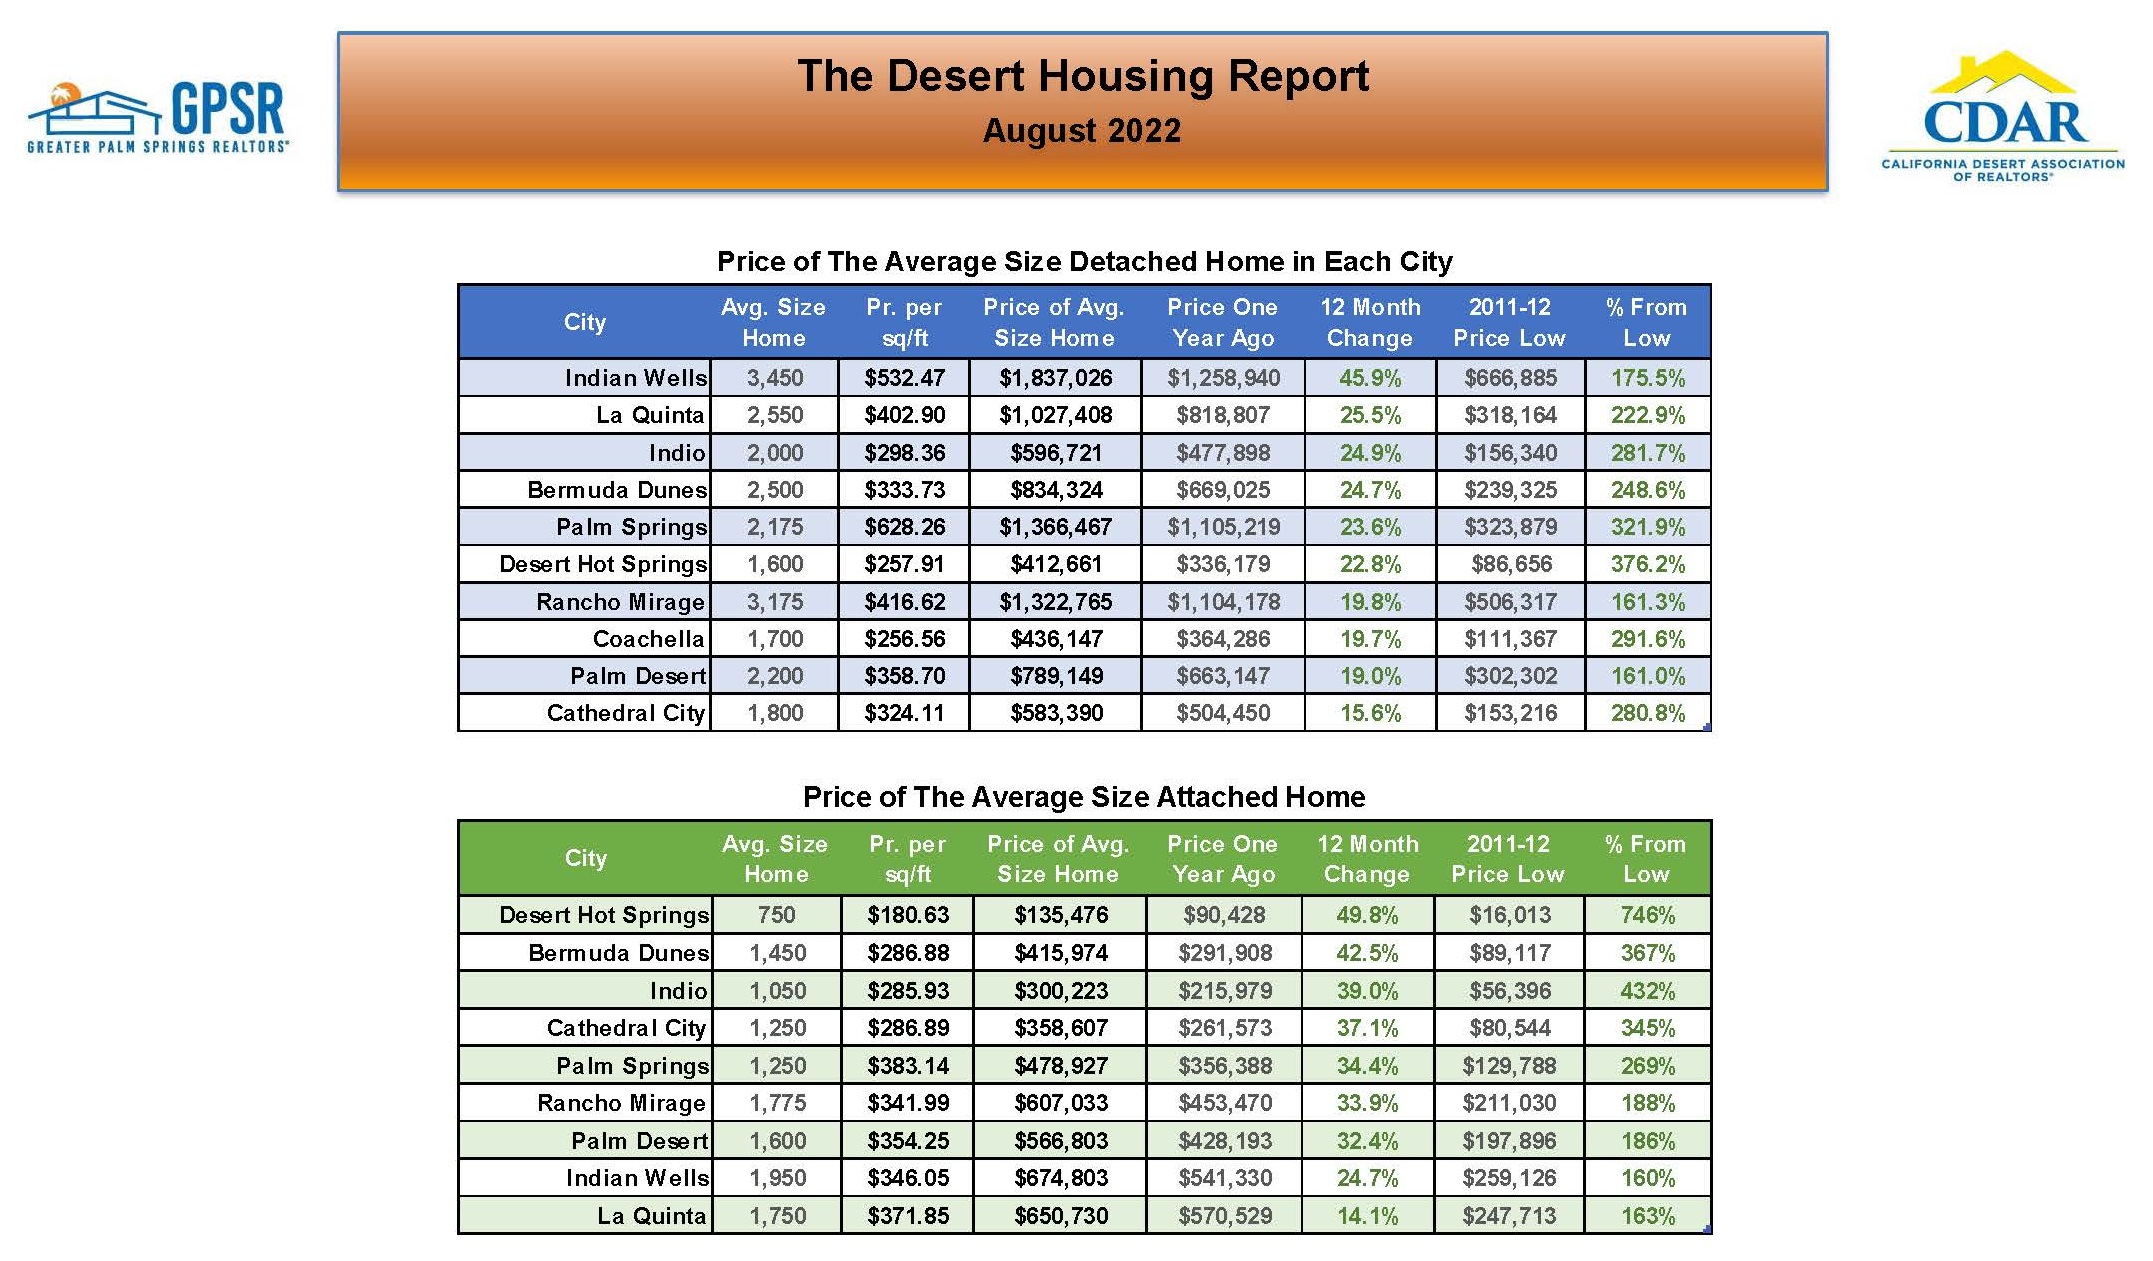 TWELVE MONTH CHANGE IN PRICE OF THE AVERAGE SIZE HOME BY CITY: Year-over-year gains in detached home median prices were still large in August, ranging from an increase of 45.9% year-over-year for the average size 3,450 sq ft detached home in Indian Wells to 15.6% for the average size 1,800 sq ft detached home in Coachella. Year-over-year increases in attached home median prices in August ranged from 49.8% for the average size 750 sq ft attached home in Desert Hot Springs to 14.1% for the average size 1,750 sq ft attached home in La Quinta.
 MONTHLY COACHELLA VALLEY HOME SALES (THREE MONTH MOVING AVERAGE): Market Watch noted that home sales in the Coachella Valley have been falling dramatically, with the three-month average of sales in August at 674 homes per month. This is down 30.9% year-over-year from sales of 976 homes per month in August 2021 and down 23% from pre-pandemic August average monthly sales of around 875 homes. Market Watch noted that these are the lowest average home sales numbers since the housing crash 15 years ago.
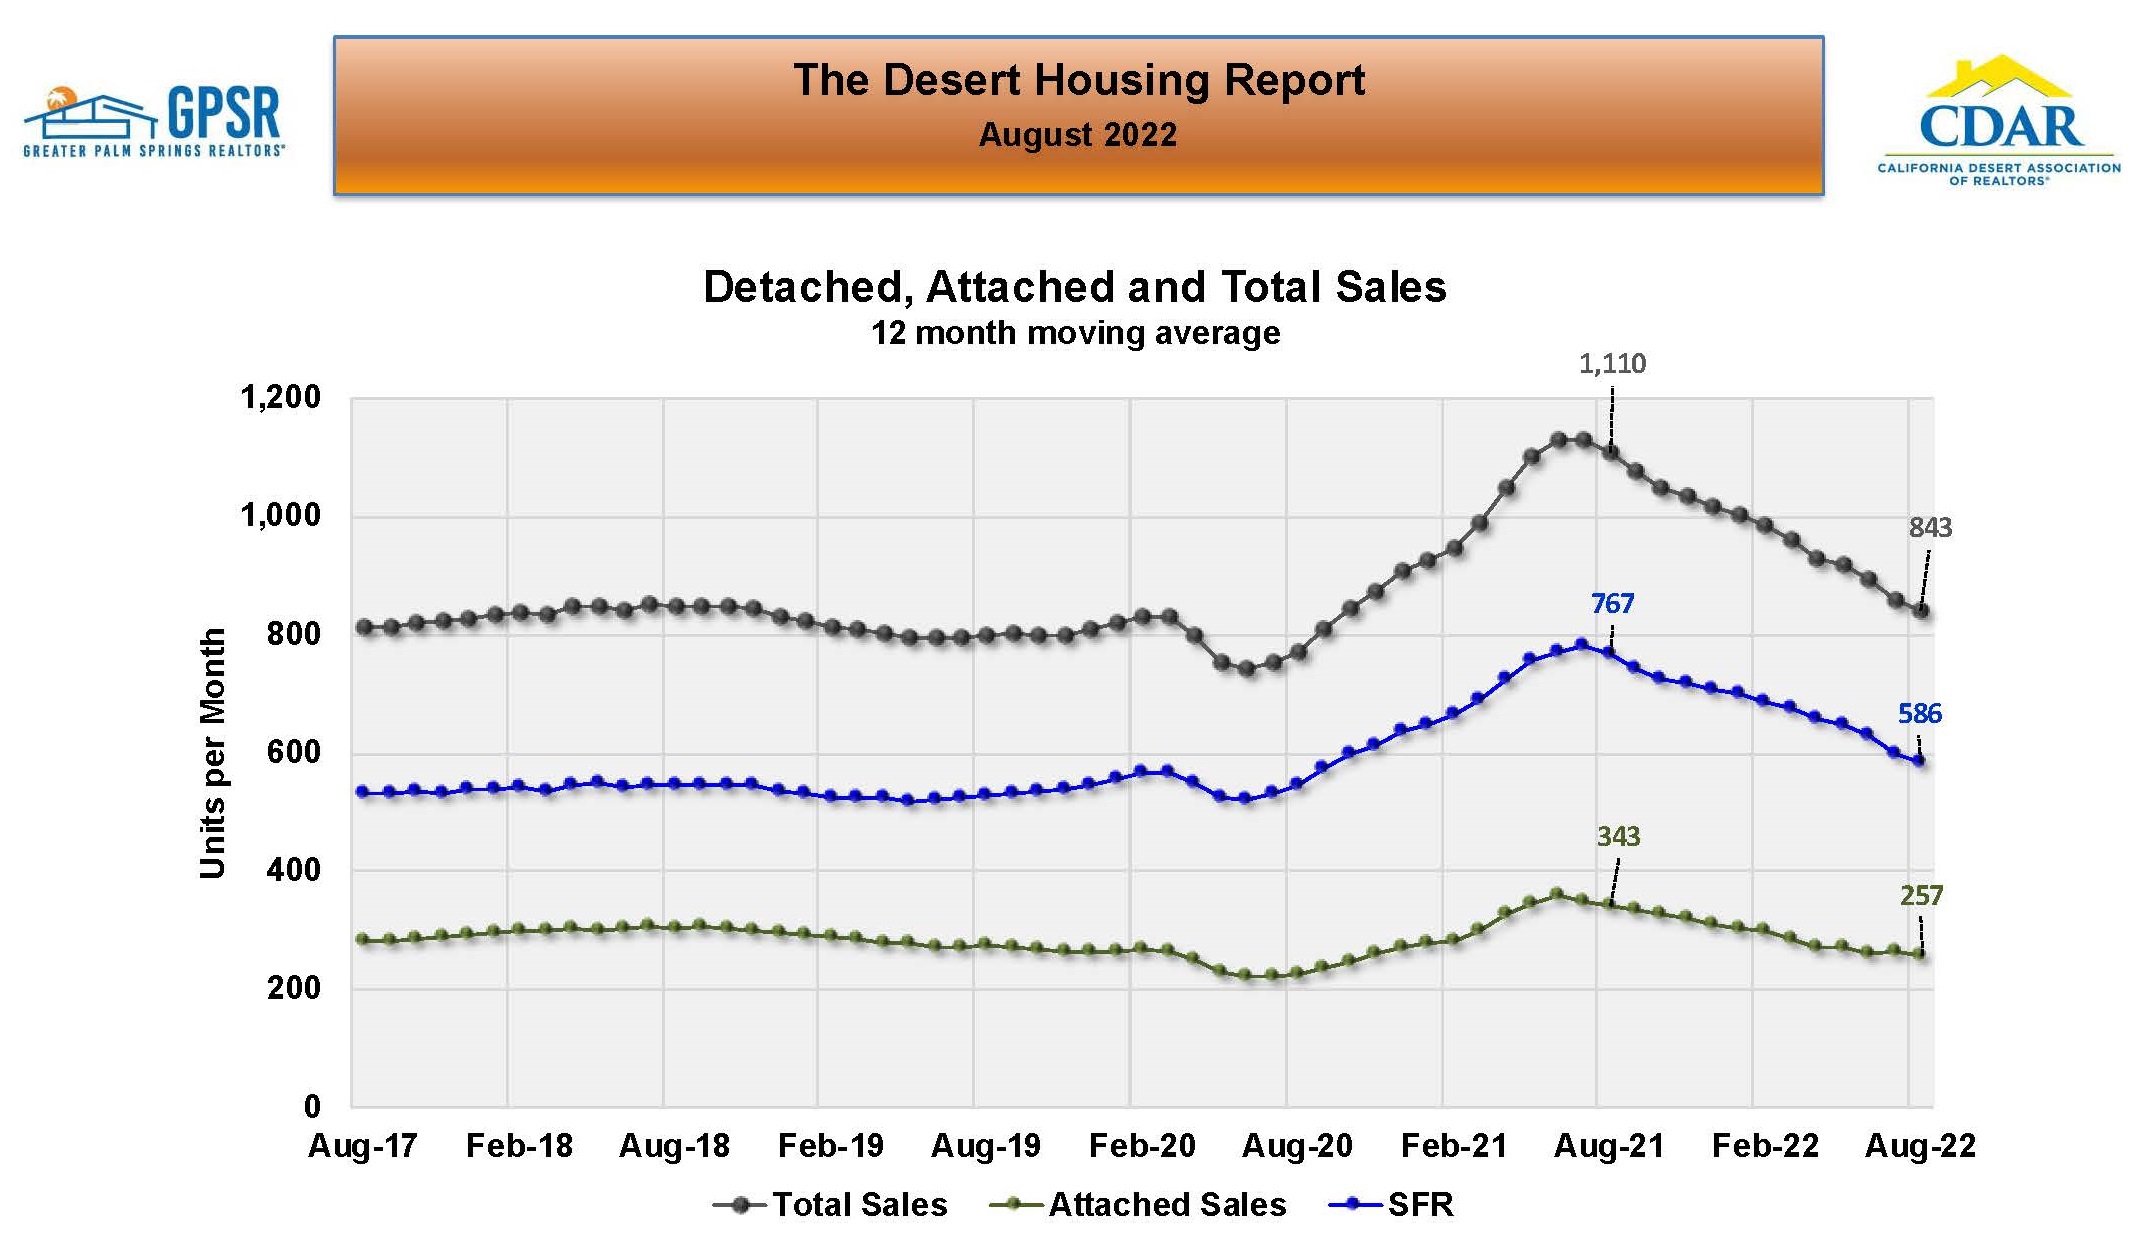 MONTHLY COACHELLA VALLEY HOME SALES (TWELVE MONTH MOVING AVERAGE): The 12-month average of home sales, which removes all seasonality, shows total home sales averaged 843 homes per month in August (down 24.1% year-over-year from the average 1,110 homes sales per month in August 2021). Market Watch noted that longer term detached home sales in August were still above pre-pandemic averages and that longer term attached home sales were slightly below pre-pandemic averages. Market Watch noted that because shorter term home sales are dropping so dramatically, total longer term home sales will continue to decline to below normal pre-pandemic levels.
 COACHELLA VALLEY HOME SALES BY CITY: Home sales declined year-over-year in every Coachella Valley other than Coachella and Thousand Palms. The largest home sales declines year-over-year occurred in La Quinta (down 41.7%), Cathedral City (down 40.5%), Rancho Mirage (down 39.1%) and Palm Desert (down 34.2%). Year-over-year home sales declines were much smaller in Bermuda Dunes, Desert Hot Springs and Indio.
 COACHELLA VALLEY HOME SALES BY PRICE RANGE: The Coachella Valley year-over-year decline in home sales of 30.9% was not evenly distributed by price range. August home sales were lower in every price range other than $800,000 to $900,000. Market Watch noted that there were only five sales of detached and attached homes priced under $200,000 (compared to 38 in August 2021).
 COACHELLA VALLEY HOME SALES INVENTORY: On September 1st, there were 1,593 homes for sale in the Coachella Valley units (757 homes or 90.6% more than the 836 homes for sale on September 1st, 2021). Market Watch noted that after surging for three months, the Coachella Valley home sale inventory has remained around 1,600 homes for the last two months. Market Watch noted that some of this is seasonal and they expect Coachella Valley home sale inventory to stay at this level for another month or so. Then, if historically seasonal forces continue, Coachella Valley home sale inventory should increase, possibly reaching 2,500 units by February. However, the historical average home sale inventory at that time of year is between 3,000 and 3,500 homes, so while this would be an improvement there is still a ways to go before inventory finally returns to normal levels.
 COACHELLA VALLEY REGIONAL MONTHS OF SALES RATIO: On September 1st, the Coachella Valley months of sales ratio was 1.9 months (the same as last month but significantly higher than the 0.8 months on September 1st, 2021). Market Watch did point out that this 1.9 months of sales ratio was still considerably below the late-summer normal of 3.0 to 3.5 months. They felt that even though inventories have been rising and sales falling, the changes were not enough to bring the ratio back to normal levels. However, they believe that the Coachella Valley might return to a normal months of sales ratio by February.

COACHELLA VALLEY MONTHS OF SALES RATIO BY PRICE RANGE: Months of sales ratios were considerably higher than one year ago in every price range, indicating that the recovery in inventory was occurring across all price ranges.
 COACHELLA VALLEY MONTHS OF SALES RATIO BY CITY: On September 1st, Thousand Palms had the lowest months of sales ratio in the Coachella Valley at one month (down from 1.7 months on September 1st, 2021), followed by Indian Wells at 1.4 months. Market Watch noted that the months of sales ratios in the other Coachella Valley cities ranged from 1.5 months to 2.5 months.
 COACHELLA VALLEY REGIONAL DAYS IN THE MARKET: Market Watch stated that as the real estate market has been moving away from a seller's market, the average selling times for homes have been increasing. At the end of August, the median number of days in the market for the entire Coachella Valley was 28 days (three days more than at the end of August 2021). Further, they expect the days in market to rapidly increase back to 50 or 60 days, which is normal for the Coachella Valley.
 COACHELLA VALLEY DAYS IN THE MARKET BY CITY: In August, Desert Hot Springs had the shortest median selling time for detached homes at 19 days, followed by Rancho Mirage, Cathedral City and Indian Wells, each at 23 days. The longest median selling time for detached homes in August was in Bermuda Dunes at 37 days. In August, Indio had the shortest median selling time for attached homes at 11 days, followed by Cathedral City at 18 days. The longest median selling time for attached homes in August was in Bermuda Dunes at 35 days.
 PERCENTAGE OF COACHELLA VALLEY HOMES SELLING ABOVE LIST PRICE: At the end of August, 36.1% of Coachella Valley home sales were above list price, compared to 51.1% at the end of August 2021. Market Watch pointed out that the percentage of homes selling above list price Is rapidly declining and they expect that by the end of the year, the percentage of homes selling above list price will be back to pre-pandemic norms of around 10%.
 AVERAGE SALES PRICE DISCOUNTS FROM LIST BY CITY: In August, both Coachella and Desert Hot Springs had the highest average selling premium above list for detached homes at 1.4%, followed by Indian Wells at 1.1%. The highest average price discount from list for detached homes was in La Quinta at 1.8%. In August, Indio had the highest average selling premium above list for attached homes at 2.2%. The highest average sales price discount from list for attached homes was in La Quinta at 2.1%.

Laurie Briggs – CalDRE# 01896117 | Tim Briggs – CalDRE# 01898254 | COMPASS – CalDRE# 01991628