Local real estate market experts, Market Watch LLC, have just released their February 2022 Desert Housing Report. Some of the highlights:
 Coachella Valley Detached Median Price: The Coachella Valley detached home median price in February was $630,000 (up 19.5% from $527,000 in February 2021, which in turn was up 22.3% from $431,000 in February 2020). Market Watch’s analysis noted that this time of year is the historical seasonal period for price strength and that they expect this to continue. In addition, they noted that the forces that have driven detached home prices higher, i.e., low inventory and rising sales, continue to dominate the Coachella Valley housing market.
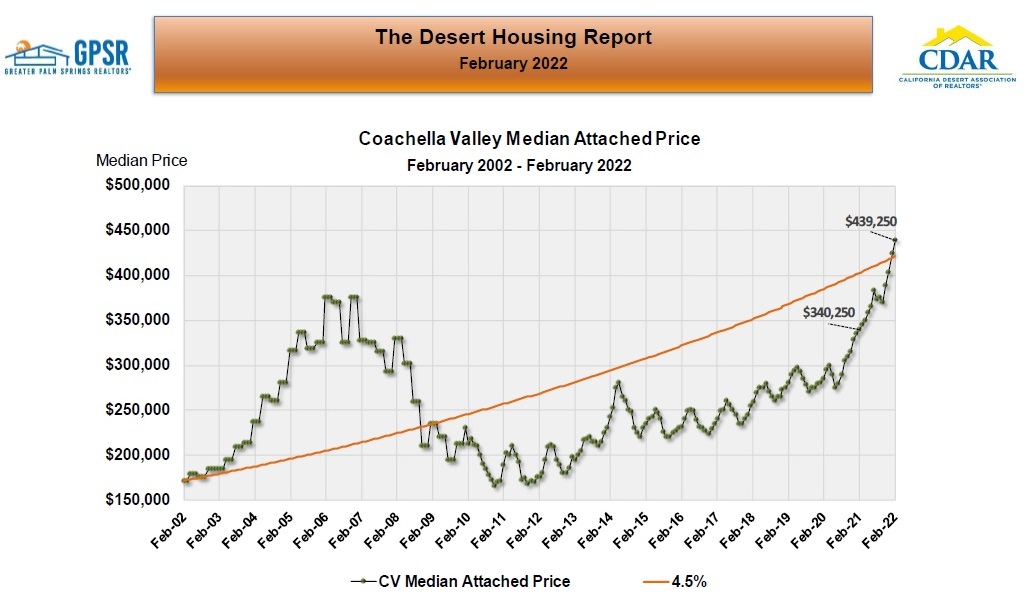 Coachella Valley Median Attached Price: The Coachella Valley attached home median price in February was $439,250 (up 29% from $340,250 in February 2021, which in turn was up 19.4% from $285,000 in February 2020). Market Watch’s analysis pointed out that attached home prices also have a seasonal pattern, in which price usually increases beginning in November and carrying through until May. Because of this pattern, Market Watch expects strong price gains to continue for at least three or four more months.
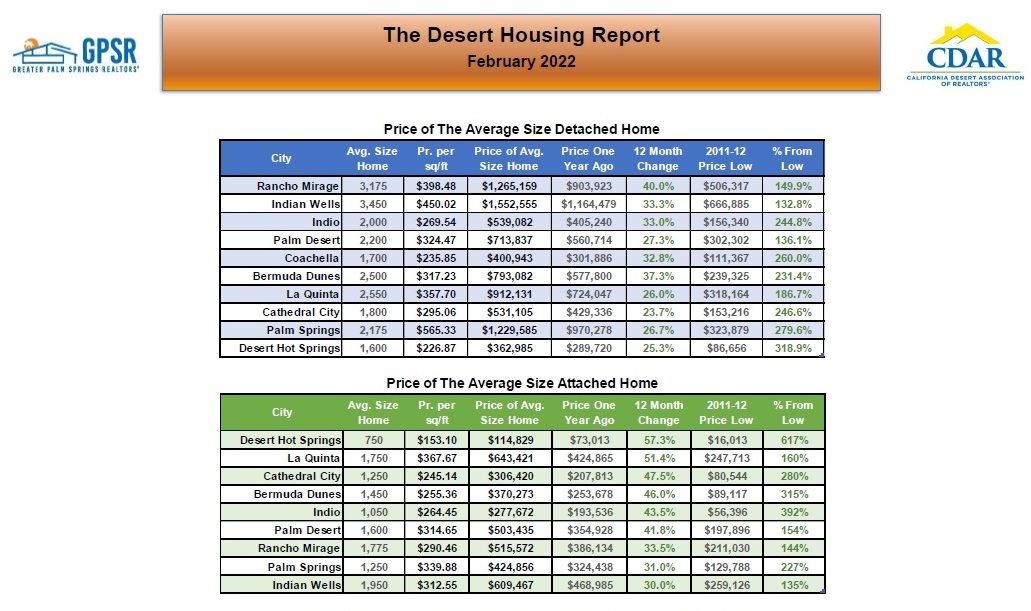 Twelve Month Change in The Price of The Average Size Home By City: This chart shows the size of the average home in each Coachella Valley city, followed by its current price and price per square foot. Current prices are then compared to levels one year ago and to the all-time low prices that occurred in 2011 and 2012. Rancho Mirage, Indian Wells and Indio had year-over-year average detached home price increases above 30%. In the case of attached homes, all nine Coachella Valley cities surveyed (Desert Hot Springs, La Quinta, Cathedral City, Bermuda Dunes, Indio, Palm Desert, Rancho Mirage., Palm Springs and Indian Wells) had year-over-year average attached home price increases of 30% or above. Average attached home prices increased by 57.3% year-over-year in Desert Hot Springs and by 51.4% year-over-year in La Quinta.
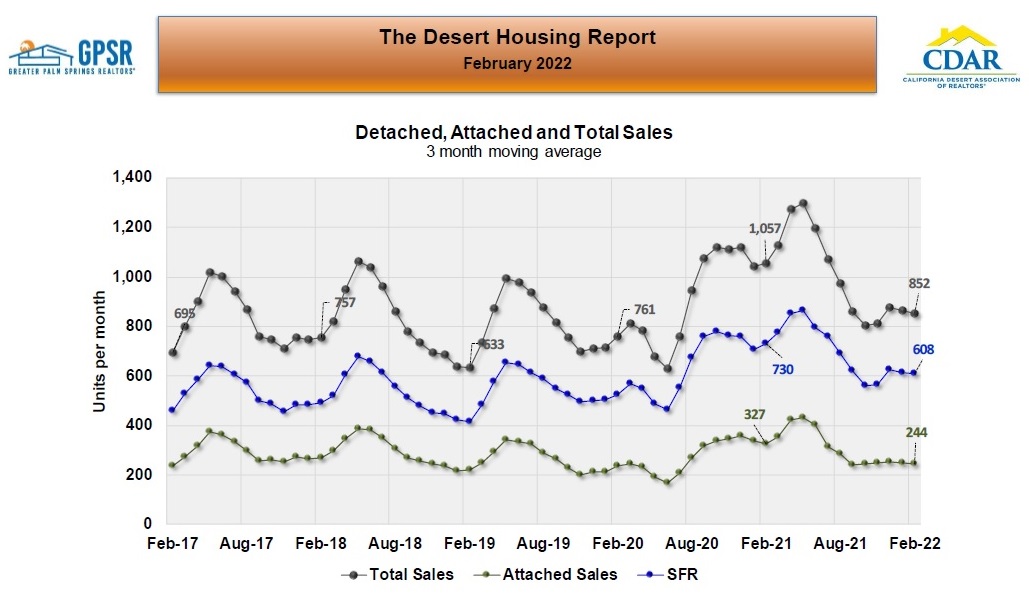 Monthly Sales – Three-Month Trailing Average: Total monthly home sales in the Coachella Valley averaged 852 homes in February (down 19% from February 2021 but still almost 100 homes more than the pre-pandemic average total monthly home sales of 761 homes in February 2021.). Monthly detached home sales averaged 608 homes in February (down 17% from average monthly detached home sales in February 2021 of 730 homes). Monthly attached home sales averaged 244 homes in February (down 25% from average monthly attached homes sales in February 2021 of 327 homes).
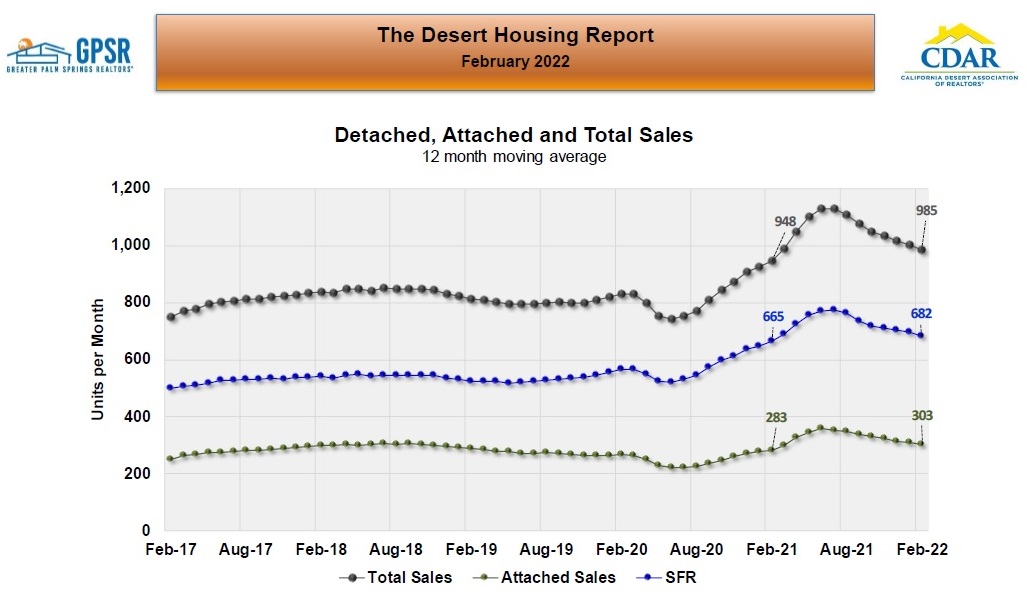 Monthly Sales – Twelve-Month Trailing Average: February total monthly homes sales (using a 12-month trailing average, which removes the seasonality from Coachella Valley home sales) averaged 985 homes (up 4% from total monthly home sales of 948 homes in February 2021). February detached homes sales averaged 682 homes (up 2.5% from average detached homes sales of 665 homes in February 2021). February attached home sales averaged 303 homes (up 7% from average attached home sales of 283 homes in February 2021). Market Watch’s analysis noted that while long-term home sales are trending down, they are still 20% to 25% above pre-pandemic levels. Further, they expect long term sales to continue to retreat from the high levels in June 2021 as supply remains constrained.
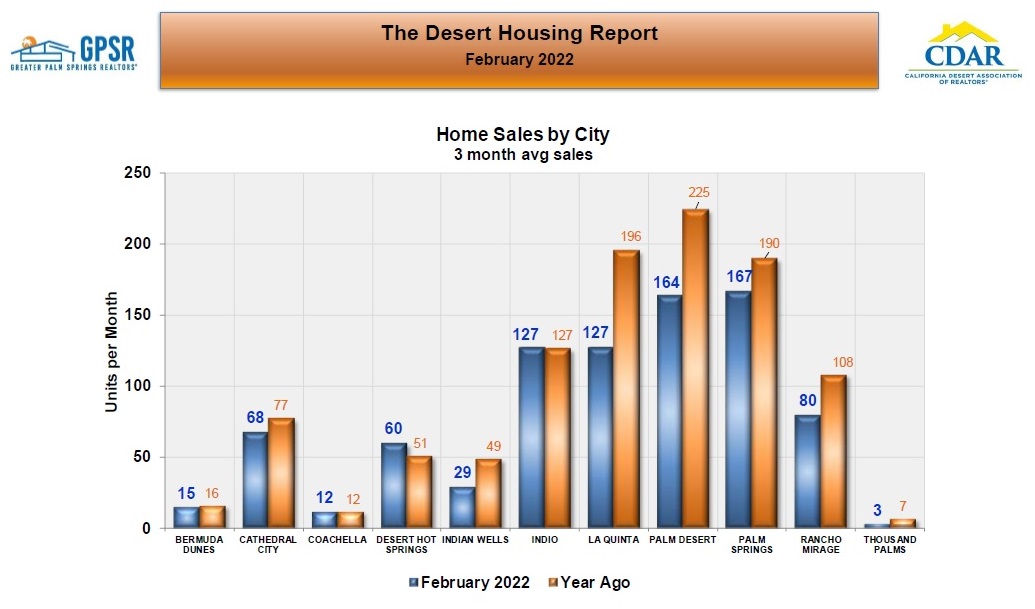 Home Sales by City: The largest decline year-over-year in homes sales occurred in the Coachella Valley’s major resort cities of La Quinta (down 35.2% year-over-year), Palm Desert (down 27.1% year-over-year), Palm Springs (down 12.1% year-over-year) and Rancho Mirage (down 25.9% year-over-year). Market Watch’s analysis noted that some of this decline in sales was due to the large home price increases in these resort cities, which in turn reduced the size of the overall buying pool. Those Coachella Valley cities classified as working cities (Cathedral City, Desert Hot Springs and Indio) show sales comparable to year ago levels in Cathedral City and Indio, with home sales increasing in Desert Hot Springs to 60 homes in February from 51 homes in February 2021.
 Home Sales by Price Range: As has been the case for several months, sales of homes in the Coachella Valley priced under $500,000 continued to decline year-over-year in February and sales of homes in the Coachella Valley priced over $500,000 continued to increase year-over-year in February. Market Watch’s analysis pointed out that most of the decline in home sales priced under $500,000 was due to fewer homes in this price range as a result of the large home price increases over the last two years.
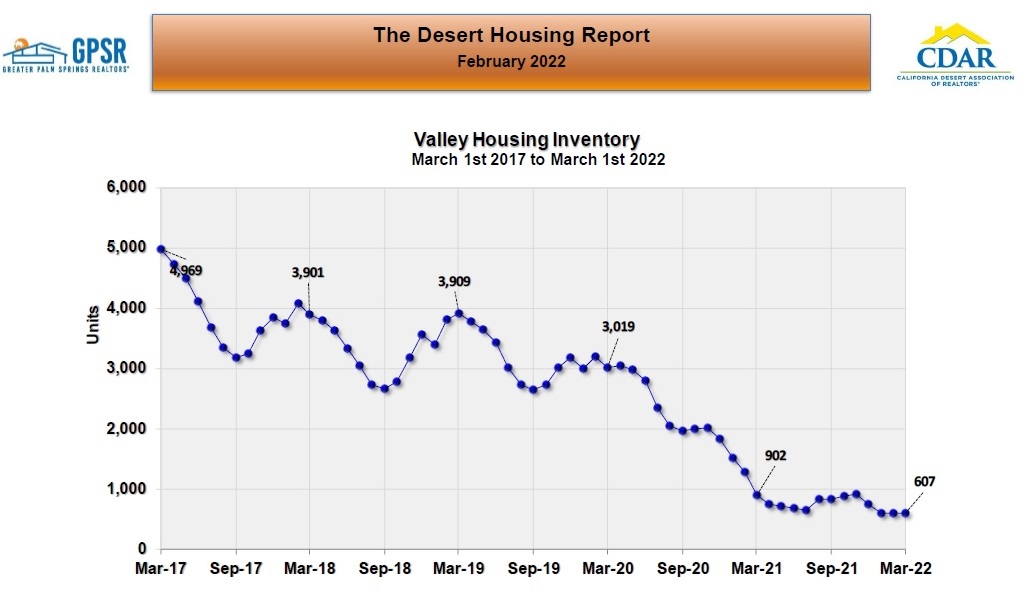
Coachella Valley Home Inventory: Home inventory in the Coachella Valley continues at near record lows and on March 1st stood at 607 homes (down 32.7% from 902 homes on March 1, 2021, which in turn was down 70.1% from 3,019 homes for sale on March 1, 2020). Market Watch’s stated that it was rather disconcerting that the seasonal increase in home inventory that normally occurs between September and March in the Coachella Valley failed to materialize this year (as was also the case a year ago). Further, they noted that unless new listings increase and inventory increases ultimately there will be a reduction of the home sales rate.
 Coachella Valley Months of Sales Ratio: On March 1st, the months of sales ratio for the entire Coachella Valley was the same as last months at 0.6 months (compared to a months of sales ratio of one month on March 1, 2021). Market Watch noted that these historically low months of sales ratios continue to indicate extremely low supply and moderate to strong demand, which are the two ingredients for much higher prices. Further they noted that even though home prices have surged, this fundamental ratio is a strong indicator that the upward price trend will continue.
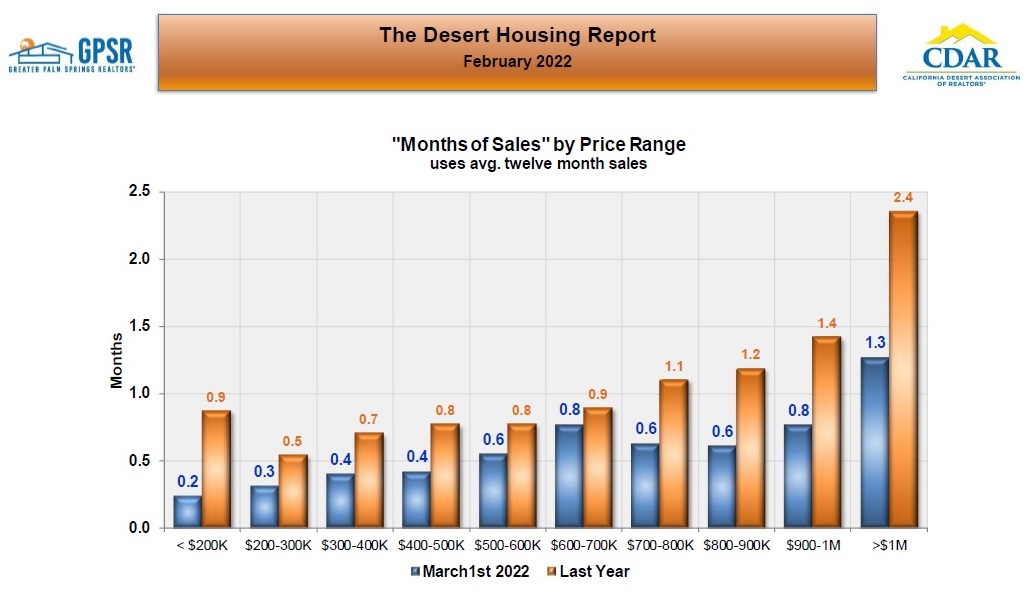 Months of Sales by Price Range: The months of sales ratio in every price range was less than it was one year ago. Even for homes priced over one million dollars, the months of sales ratio was just 1.3 months (the same as last month). Market Watch states that these months of sales ratios show that it’s a strong seller’s market across the entire price spectrum.
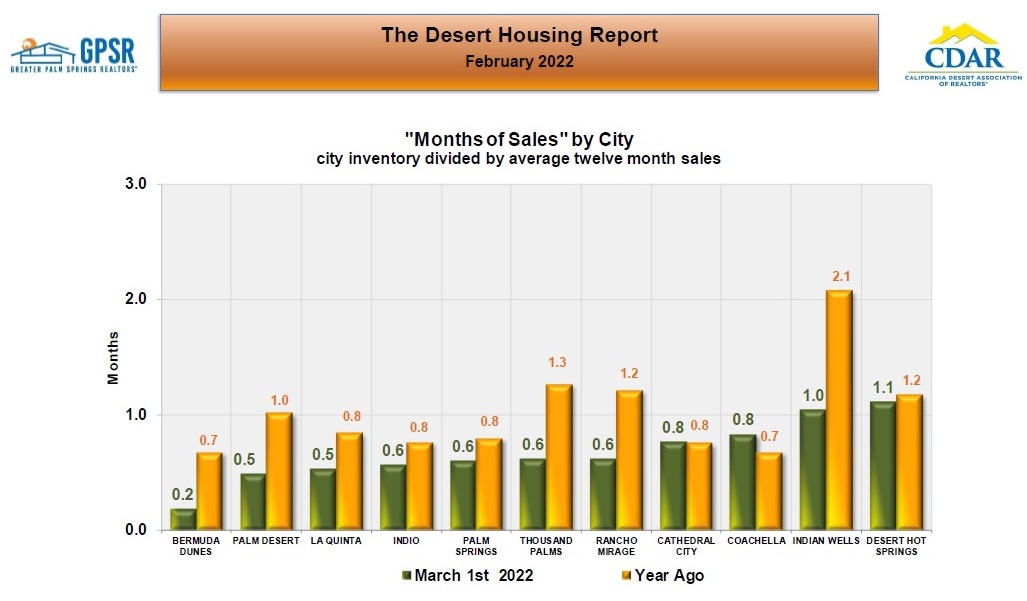 Months of Sales by City: Bermuda Dunes had the lowest months of sales ratio at 0.2 months followed by Palm Desert and La Quinta at 0.5 months each. Only Desert Hot Springs had a months of sales ratio higher than one month.
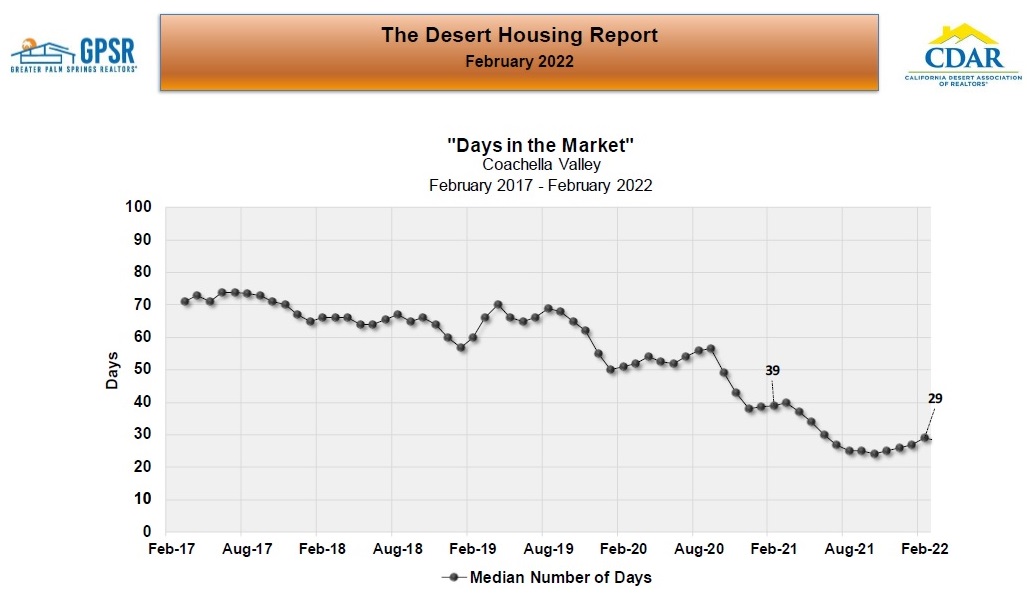 Coachella Valley Days in the Market: In February, the median number of days in the market for the entire Coachella Valley was 29 days (down 25.6% from 39 days in February 2021). Market Watch did note that selling times in the Coachella Valley have been gradually increasing. However, with inventory remaining low and sales staying high, forces continue in place to keep selling times near current low levels.
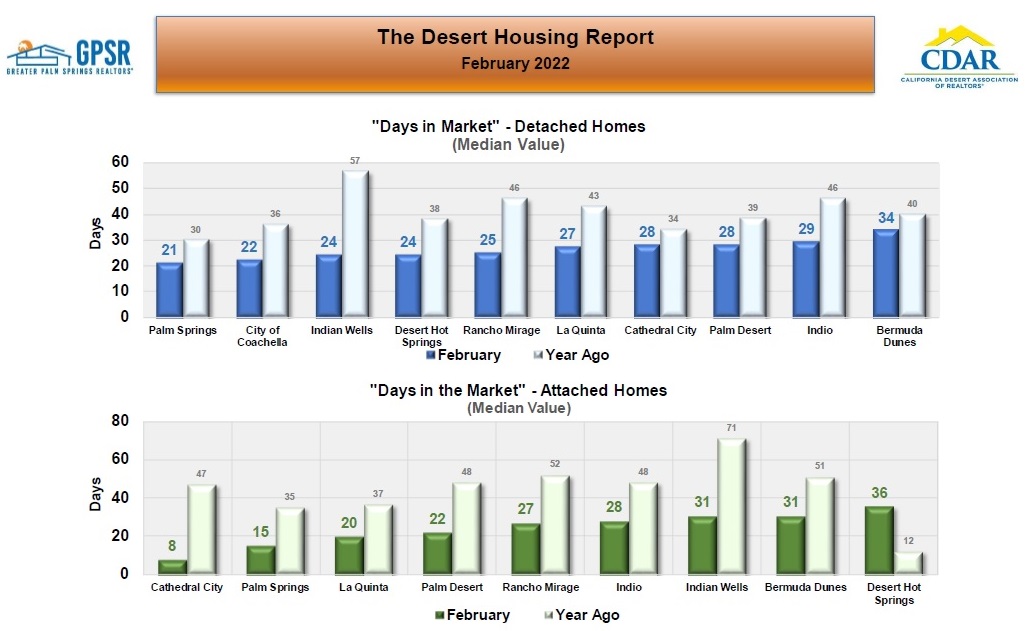 Days in the Market By City: In February, Palm Springs had the lowest selling time for detached homes at just 21 days (down from 30 days in February 2021), followed by the cities of Coachella at 22 days (down from 36 days in February 2021) and Indian Wells at 24 days (down from 57 days in February 2021). In February, Cathedral City had the lowest selling time for attached homes at just 8 days (down from 47 days in February 2021), followed by Palm Springs at 15 days (down from 35 days in February 2021) and La Quinta at 20 days (down from 37 days in February 2021).
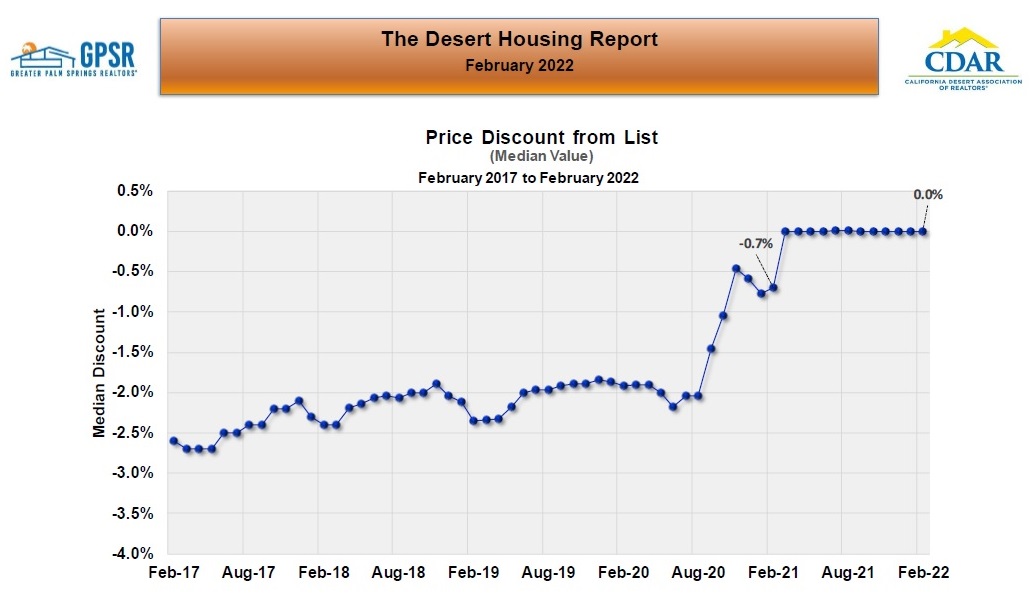 Coachella Valley Home Price Discount: The median value for the sale price discount from list in the Coachella Valley in February was 0.0% (the same as it’s been for the last 12 months). Since so many homes are selling right at list price, the median value of all sales continues to be exactly 0.0%. In February 2021, the sales price discount from list was -0.7%.
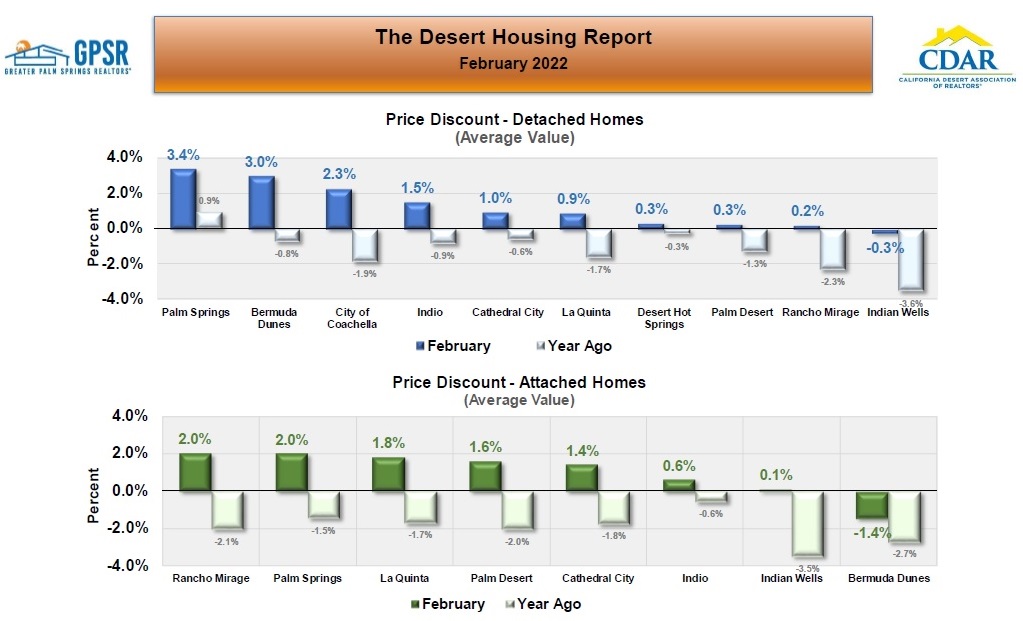 Average Price Discounts By City: In February, Palm Springs had the highest selling premium for detached homes at 3.4% (up from 0.9% in February 2021), followed by Bermuda Dunes at 3% (up from -0.8% in February 2021) and the city of Coachella at 2.3% (up from -1.9% in February 2021). In February, Rancho Mirage had the highest selling premium for attached homes at 2% (up from -2.0% in February 2021) followed by Palm Springs at 2.0% (up from -1.5% in February 2021) and La Quinta at 1.8% (up from -1.7% in February 2021).
 CalDRE# 01898254 | 01896117 | 01991628