Our local real estate experts, Market Watch LLC, have just release their Desert Housing Report for November. Some highlights: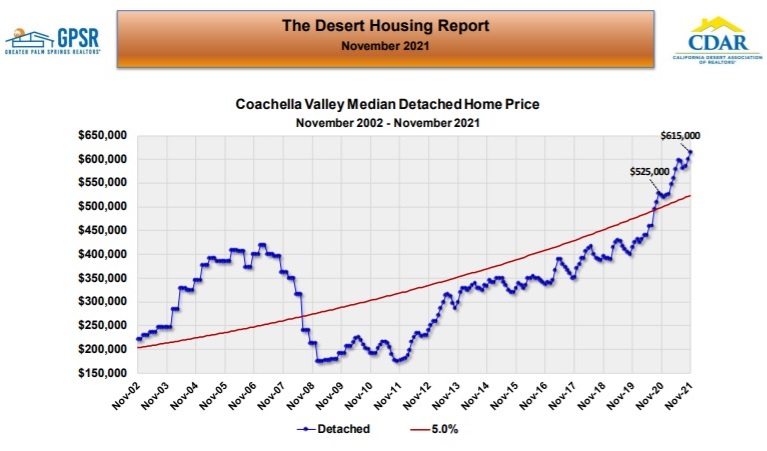 November Coachella Valley Detached Home Median Price: The median price of detached homes in the Coachella Valley in November was $615,000 (up 17.1% year-over-year from $525,000 in November 2020). Market Watch noted that historically the month of November begins a seasonal period of price strength going back at least 15 years or more. They expect this seasonal pattern to continue and to be enhanced by the continuing large over balance of demand versus supply.
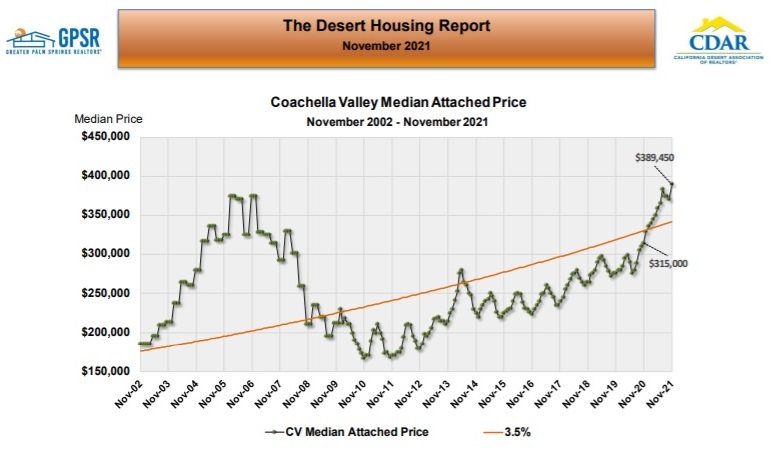 November Coachella Valley Median Attached Price: The median price of attached homes in the Coachella Valley in November was $389,450 (up 23.6% year-over-year from $315,000 in November 2020). Market Watch noted that attached homes also historically have a seasonal period of price strength beginning in November and carrying forward five or six months. They expect this seasonal pattern to continue for attached homes.
 Twelve-Month Change in the Price of the Average Size Home in Each City: In November, the twelve-month price increases for detached homes ranged from an increase of 44.4% in the 2,500 sq ft average size detached home sold in Bermuda Dunes (increasing to $774,599 from $536,575) to an increase of 26.2% in the price of the 1,800 sq ft average size detached home sold in Cathedral City (increasing to $515,614 from $408,483). In November, the twelve-month price increases for attached homes ranged from an increase of 71.2% in the 750 sq ft average size attached home sold in Desert Hot Springs (increasing to $110,071 from $64,298) to an increase of 26.3% in the price of the 1,950 sq ft average size attached home sold in Indian Wells (increasing to $592,220 from $468,985).
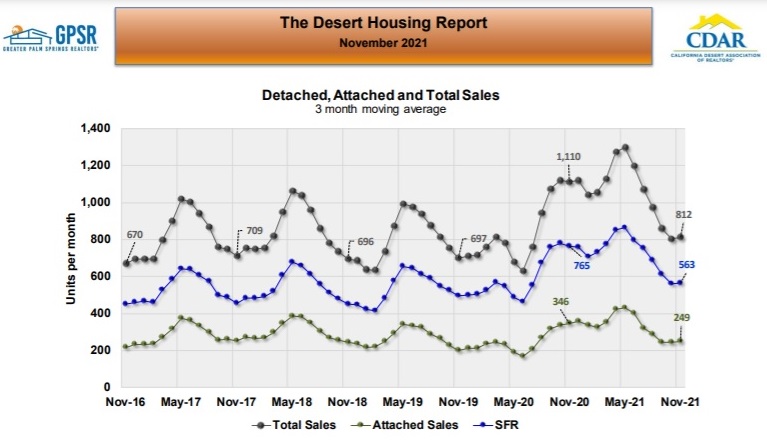 Monthly Home Sales (Three-month trailing avg.): Total home sales in November averaged 812 homes per month (compared to total home sales of 1,120 homes per month in November 2020 and pre-pandemic November average home sales of 693 homes per month). Monthly sales of detached homes averaged 563 homes (down 26% from monthly detached home sales of 765 homes in November 2020). Monthly sales of attached homes averaged 249 homes (down 28% from monthly attached home sales of 346 homes in November 2020). Market Watch noted that with housing inventory levels so low, unless the number of new listings were to surge, it would be hard to imagine sales rising much above current levels.
 Monthly Sales (Twelve-month trailing avg.): Twelve-month average home sales in November averaged 1,036 homes (an increase of 18% year-over-year, but down from the 24% year-over-year increase in total monthly home sales in October). Market Watch felt that the decrease in the twelve-month average of monthly home sales from October to November showed that home sales are beginning to retreat from last year’s high. Market Watch expects long term home sales to continue to decline but stay above pre-pandemic averages.
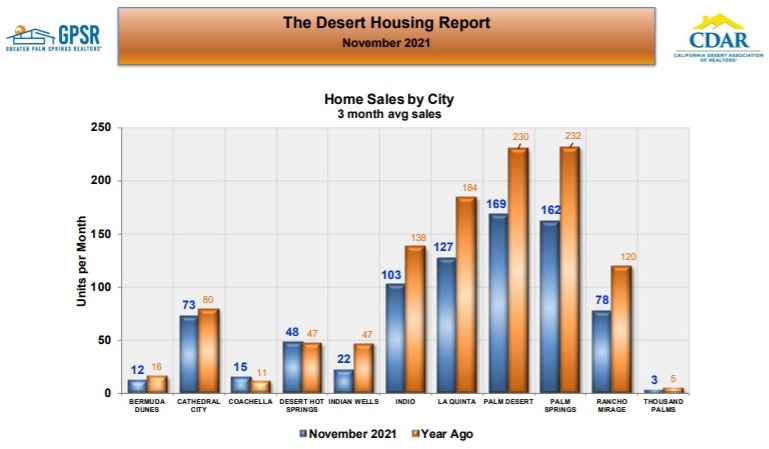 Home Sales by City: The November three month average of home sales by city showed an equally distributed decline in home sales from year ago levels in the five largest cities in the Coachella Valley (Indio, La Quinta, Palm Desert, Palm Springs and Rancho Mirage). November average home sales in Coachella and Desert Hot Springs increased from those in November 2020.
 Home Sales by Price Range: November homes sale by price ranges showed that the decrease in monthly home sales occurred primarily in homes priced under $400,000. Sales of homes priced over $400,000 showed comparable levels to last year. Market Watch noted that some of the decline in monthly home sales for homes priced under $400,000 was due to the general home price increase that resulted in fewer homes listed in this price range.
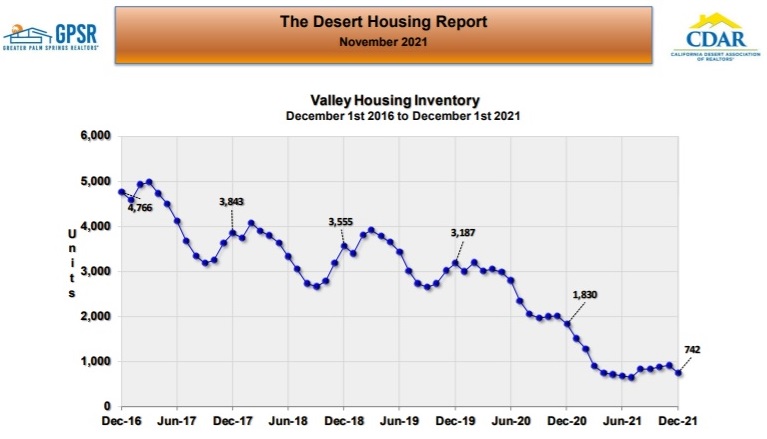 Coachella Valley Housing Inventory: On December 1st, the total housing inventory in the Coachella Valley fell to 742 homes (173 homes less that on November 1st and down 59% from an inventory level of 1,830 homes on December 1st, 2020). Market Watch stated that this low inventory level was somewhat disconcerting since historically there are large inventory increases in November and December. They noted that other regions in Southern California are also experiencing declining housing inventory levels. Their conclusion was that this trend highlights the fact that the restrictive effects of the pandemic still exist even after widespread distribution of vaccines.
 Coachella Valley Overall Months of Sales Ratio: On December 1st, the months of sales ratio for the entire Coachella Valley declined to 0.7 months, which is approaching the months of sales ratio lows registered in mid-summer. One year ago, the months of sales ratio was 2.1 months. Market Watch stated that while these low months of sales ratios continue to bode well for home sellers, they make it very difficult for homebuyers to find homes that meet their wants and needs.
 Months of Sales by Price Range: The months of sales ratio was 1 month or less in all price ranges under one million dollars. Even for homes priced over one million dollars, the months of sales ratio was only 1.4 months.
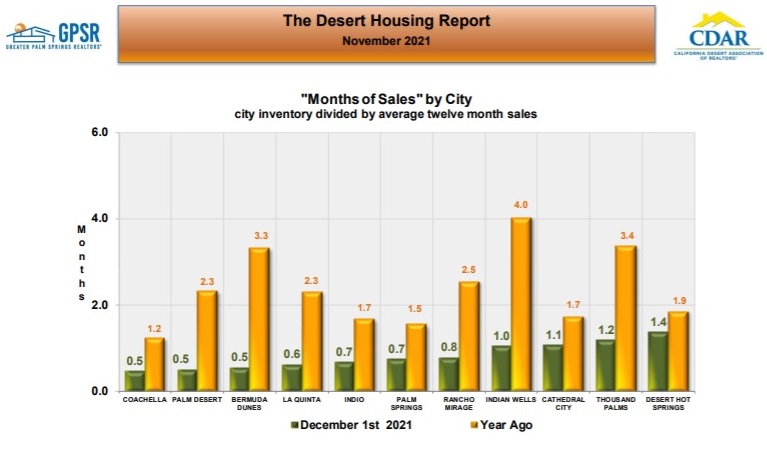 Months of Sales by City: Comparing months of sales ratios in each Coachella Valley city, Market Watch noted that normally the higher median priced cities of Rancho Mirage and Indian Wells have the highest months of sales ratios. On December 1st however, the lower median priced cities of Cathedral City (with a months of sales ratio of 1.1 months), Thousand Palms (with a months of sales ratio of 1.2 months) and Desert Hot Springs (with a months of sales ration of 1.4 months) had the highest months of sales rations in the Coachella Valley.
 Coachella Valley Overall Days in the Market: At the end of November, the median days in the market throughout the Coachella Valley was 25 days (one day more than last month but 18 days less than at the end of November 2020). Market Watch noted that with inventory levels low and demand high, forces are in place to possibly push the days in the market even lower. However, they believe that most of the decline has been realized and that the median number will stay near current levels for a while.
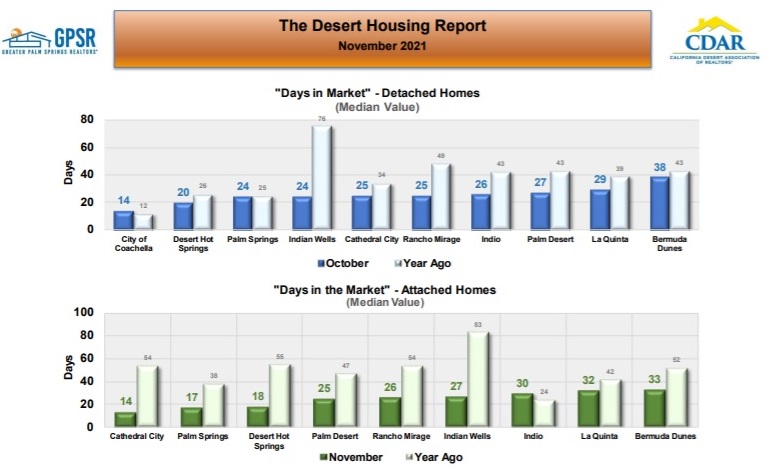 Days in the Market by City: In November, Coachella continued to have the lowest detached home days in the market at 14 days, followed by Desert Hot Springs at 20 days and both Palm Springs and Indian Wells at 24 days. Bermuda Dunes had the highest detached home days in the market at 38 days. For attached homes, in November Cathedral City averaged 14 days to sell a home while Palm Springs averaged 17 days. Bermuda Dunes had the highest attached home days in the market at 33 days.
 Coachella Valley Overall Median Price Discount From List: The median value for sale price discount from list for detached homes in November was again 0.0% (the same discount that it’s been for the last nine months). Market Watch noted that since so many homes are selling at list price, the median value of the discount for all sales was exactly 0.0% in November. One year ago, the median sale price discount from list was -0.5%.
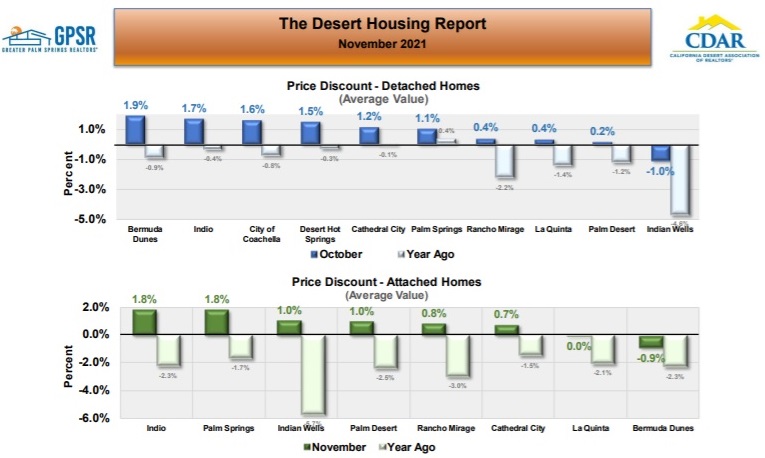 Average Sale Price Discounts from List by City: Detached homes in Bermuda Dunes sold on average at a premium of 1.9% in November, followed by detached home sales in Indio on average at a premium of 1.7% and detached home sales in Coachella on average at a premium of 1.6%. Only in Indian Wells did detached homes on average sell at a discount (of -1%). For attached homes, homes sales on average sold at a premium of 1.8% in both Indio and Palm Springs. Only in Bermuda Dunes did attached homes on average sell at a discount (of -0.9%).
 CalDRE# 01898254 | 01896117 | 01991628