Local real estate market experts, Market Watch LLC have just released their January 2022 Desert Housing Report. Some highlights:
 Coachella Valley Detached Home Median Price: At the end of January, the median price of a detached home in the Coachella Valley was $617,000 (up 17.5% year-over-year). Market Watch’s analysis noted that our housing market has entered the traditionally strong seasonal period for price strength and they expect that trend to continue this year. They stated that they expect home prices to strongly move higher due to the current low inventory and increasing home sales.
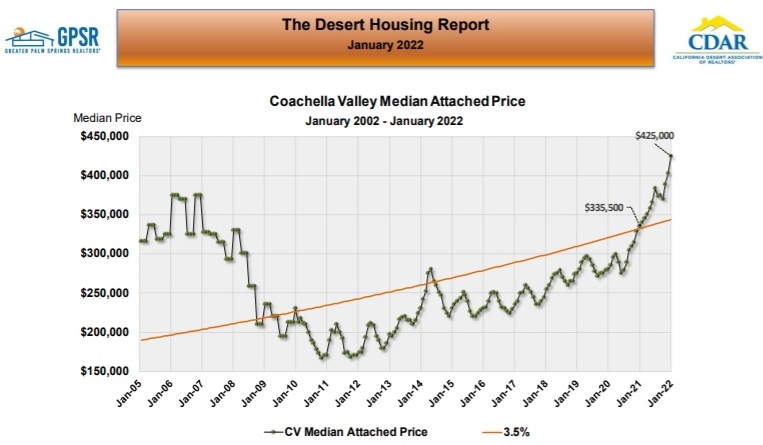 Coachella Valley Attached Home Median Price: At the end of January, the median price of an attached home in the Coachella Valley was $425,000 (up more than $20,000 from last month’s attached home median price and hup 27% year-over-year. Market Watch explained that attached homes also have a traditionally strong seasonal pattern for price strength, beginning in November and carrying through until May. They stated that they expect attached home prices to continue to move strongly higher.
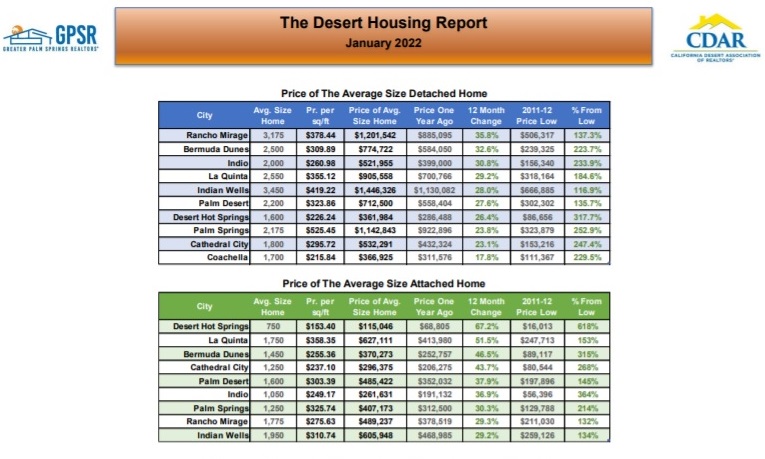 12 Month Change in The Price of The Average Size Home By City: This chart shows the size of the average home in each of the Coachella Valley cities, followed by its price and price per square foot. Current prices are then compared to both year ago prices and the all-time price lows that occurred in 2011 and 2012. Year-over-year, the price of the average size detached home increased by more than 30% in Rancho Mirage, Bermuda Dunes and Indio. Year-over-year, the price of the average size attached home increased by more than 40% in Desert Hot Springs, La Quinta, Bermuda Dunes and Cathedral City..
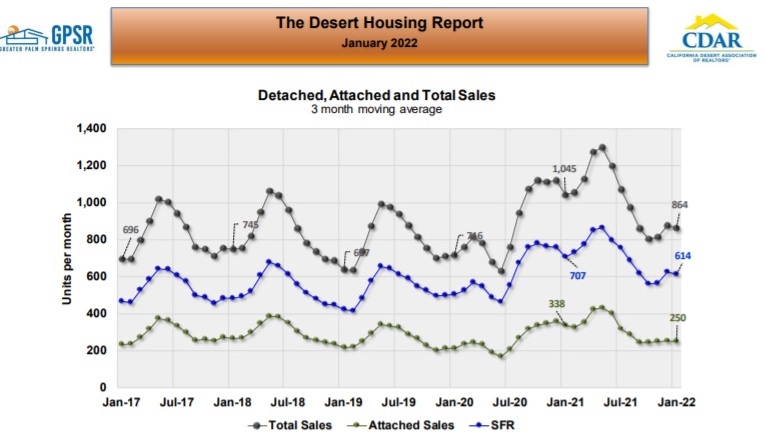 Monthly Sales (3-Month Trailing Average): Total home sales in January averaged 864 units per month (down 17% from January 2021 but up 23% from pre-pandemic January averages). Sales of detached homes in January were down 13% year-over-year and sales of attached homes in January were down 26% year-over-year.
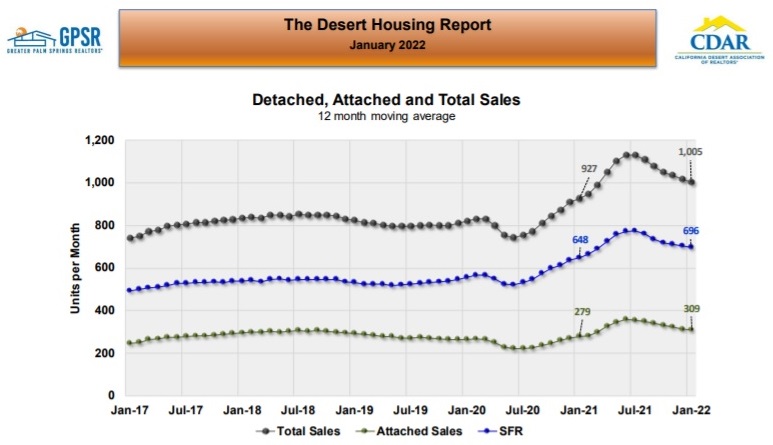 Monthly Sales (12-Month Trailing Average): The 12-month average of total home sales (which takes out all seasonality) in January was 1,005 homes per month (up 8.4% year-over-year but also on a gradual downward trend). Market Watch pointed out that the 12-month average of total home sales in January was still 20% to 25% above pre-pandemic levels. Sales of detached homes in January increased by 7.4% year-over-year. Sales of attached homes in January increased by 10.7% year-over-year. Market Watch expects 12 -month average home sales to continue to slowly retreat from the June highs of last year
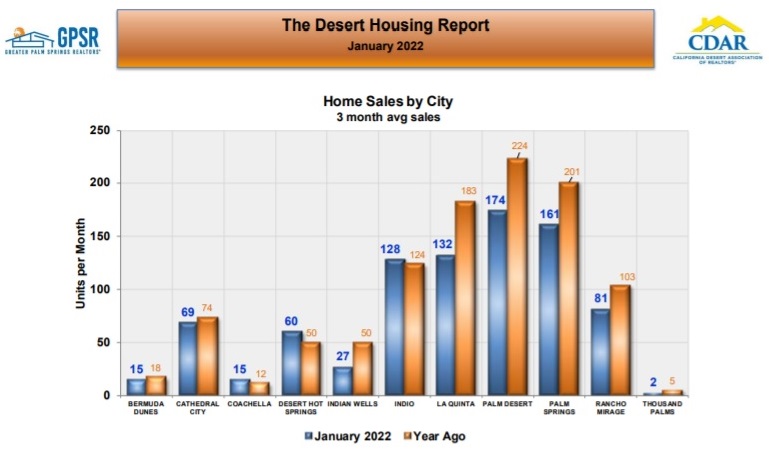 Home Sales by City: Market Watch noted that the 3-month average total home sales decline in January was primarily due to lower home sales in La Quinta (down 27.9% year-over-year), Palm Desert (down 22.3% year-over-year) and Palm Springs (down 19.9% year-over-year). They felt that this sales decrease in these cities was primarily due to shrinking inventory and higher prices. They noted that in those cities with overall lower home prices, sales in January were close to sales one year ago. Home sales in January increased year-over-year in Desert Hot Springs (up 20% year-over-year) and Indio (up 3.2% year-over-year).
 Home Sales by Price Range: As has been the case for a while, the decrease in home sales is occurring primarily in those homes priced under $400,000. Sales of homes priced between $400,000 and $600,000 are effectively unchanged from year ago levels. Sales of homes priced over $600,000 are generally higher than year ago levels.
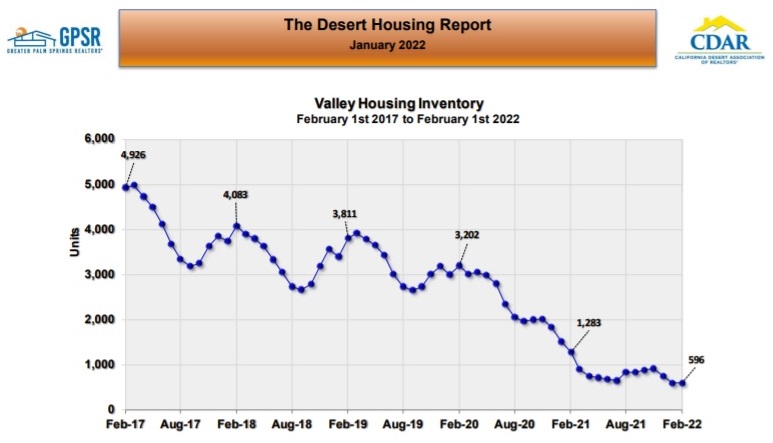 Coachella Valley Total Home Inventory: On February 1st, the total home inventory in the Coachella Valley was 596 homes (effectively at record low levels). Market Watch commented that from a seasonal perspective this low number was rather alarming since historically inventory usually rises between September 1st and March 1st. Market Watch noted that there has been no inventory increase this year, which means that seasonally, there will now be downward pressure on inventory going forward. Market Watch stated that unless new listings explode and create more inventory, the net effect of this will be a reduction in the sales rate as we continue into 2022.
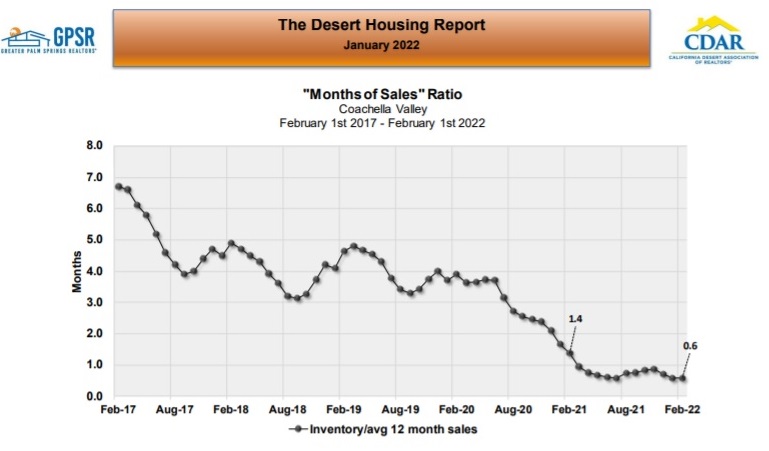 Regional Months of Sales Ratio: On February 1st, the months of sales ratio for the Coachella Valley was 0.6 months (the same as last month and at the historically low ratios registered last summer). A year ago, the ratio was 1.4 months. Market Watch noted that these historically low months of sales ratios indicate heavy demand and very low supply, which are the two requirements for much higher prices. Even though prices are 30% or more above year ago levels, Market Watch felt that this months of sales ratio was a strong indicator that higher prices still lie ahead.
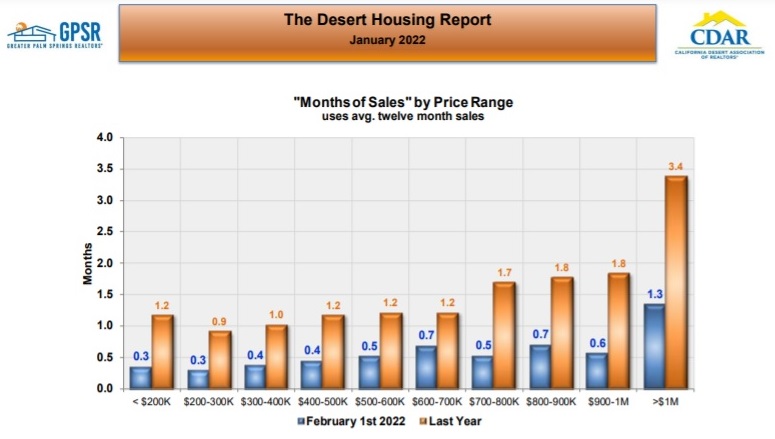 Months of Sales by Price Range: The months of sales ration in every price range other than homes priced over a million dollars was at or below 0.7 months. For homes over a million dollars, the ratio is 1.3 months, which is the same as last month. Market Watch felt that this shows that the strong seller’s market exists across the entire price spectrum.
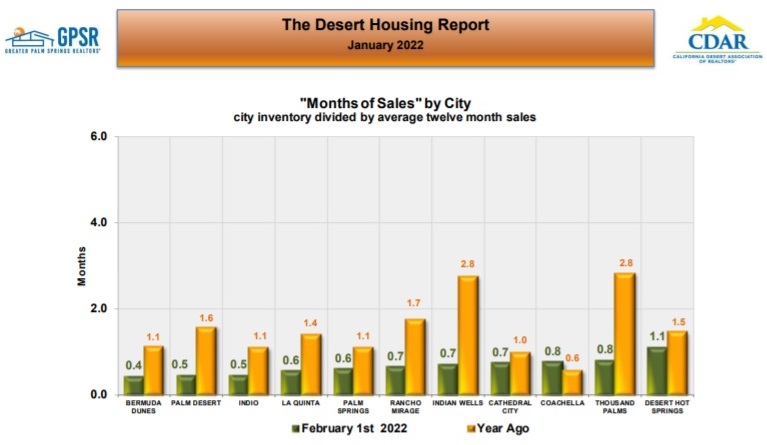 Months of Sales by City: On February 1st, Bermuda Dunes had the lowest months of sales ration (0.4 months), closely followed by Palm Desert and Indio at half a month each. Only Desert Hot Springs had a months of sales ratio over one month.
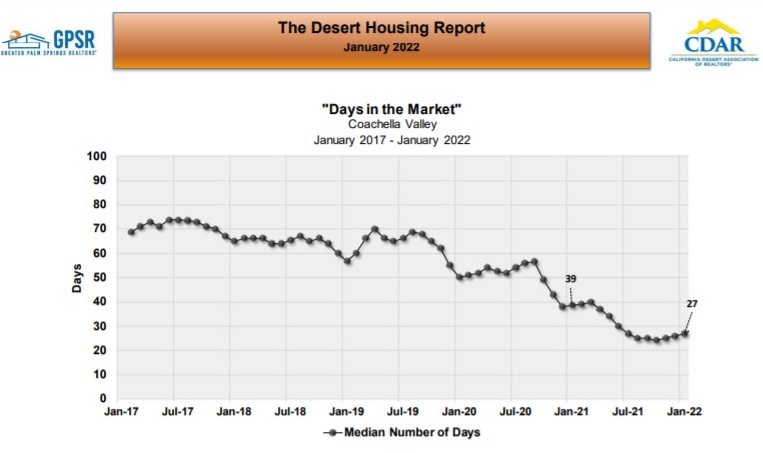 Regional Days in the Market: At the end of January, the median number of days in the market throughout the Coachella Valley was 27 days (same as it was last month). Market Watch noted that while selling times in the Coachella Valley have been gradually inching higher over the last four months, low inventory and high sales should continue to keep selling times at current low levels.
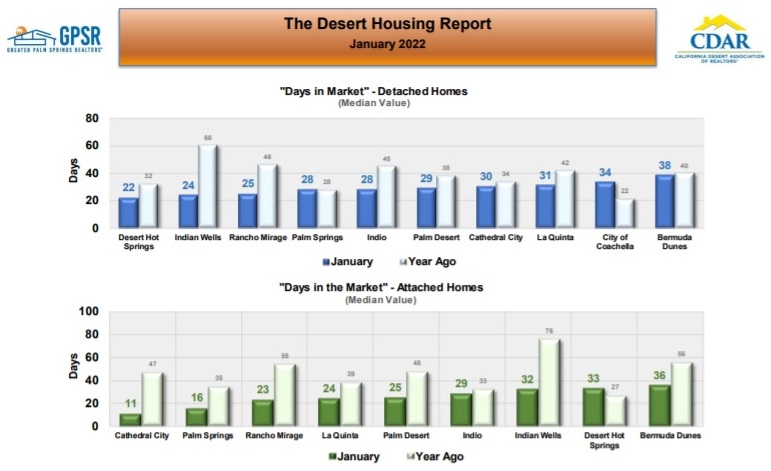 Days in the Market By City & Home Type: In January, Desert Hot Springs had the lowest number of days in the market for detached homes at 22 days, followed by Indian Wells with 24 days and Rancho Mirage at 25 days. In January, Cathedral City had the lowest number of days in the market for attached home at 11 days, followed by Palm Springs at 16 days and Rancho Mirage at 23 days.
 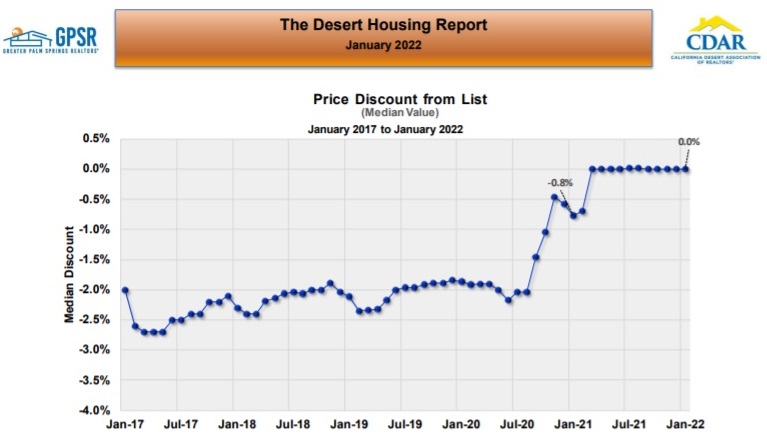 Regional Sales Price Discount From List: The median value for sale price discount from list for detached homes in January was again 0.0% (the same as it’s been for eleven months). Since so many homes are selling at list price, the median value of the price discount from list continues to be exactly 0.0% (compared to -0.8% one year ago).
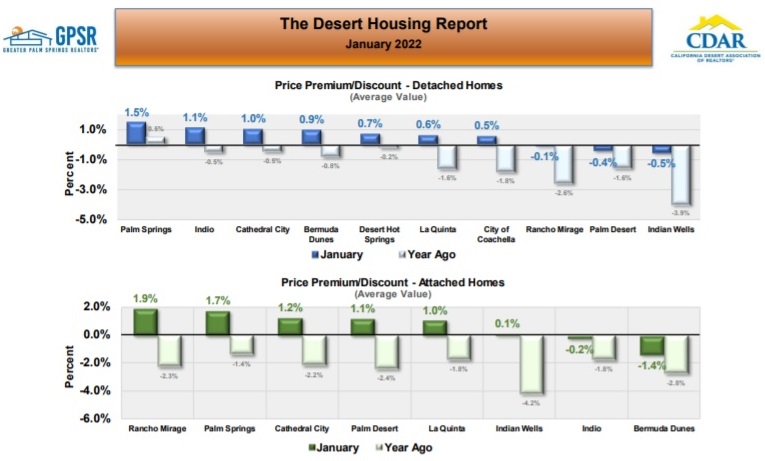 Average Sales Price Discounts From List By City & Home Type: In January, Palm Springs had the highest selling premium for detached homes at 1.5%, followed by Indio at 1.1% and Cathedral City at 1%. In January, Rancho Mirage had the highest selling premium for attached homes at 1.9%, followed by Palm Springs at 1.7% and Cathedral City at 1.2%.

CalDRE# 01898254 | 01896117 | 01991628