
(Please click on the image above to view our short YouTube video)
Local real estate market experts, Market Watch LLC, have just released their July 2019 Desert Housing Report. Some of the highlights:
 The Coachella Valley median detached home price in July was $417,500 (up 4.4% year-over-year, but down from the current 2019 high median detached home price of $430,000 in May).
 The Coachella Valley median attached home price in July was $285,000 (up 1.9% year-over-year, but down from the current 2019 high median attached home price of $297,000 in May). Market Watch pointed out that historically median home prices usually bottom out in September then rise for the next seven months. They expect this pattern to continue again this year.
 On a city by city basis, the median detached home price rose in eight of the nine regional cities, with Indian Wells (up 13.2% year-over-year) and the city of Coachella (up 11.2% year-over-year) leading the pack. Palm Springs continues to be the only city in the Coachella Valley where the median detached home price is now above the 2006-2007 high (8.3% higher). The median detached home price remains at 20% or more below the 2006-2007 high price in Rancho Mirage, La Quinta, Palm Desert and Desert Hot Springs. The median attached home price rose in five of the eight regional cities, with Cathedral City (up 13.5% year-over-year) and Indian Wells (up 12.1% year-over-year) leading the pack. The median attached home price decreased year-over-year in Rancho Mirage, Desert Hot Springs and Indio. The median attached home price remains at 20% or more below the 2006-2007 high price in all eight of the regional cities for which data is available.
 Over the last three months, total Coachella Valley home sales have been averaging 939 units per month (2.5% below total home sales of 963 units per month one year ago). Detached home sales over the last three months averaged 615 units per month (the same as one year ago) and attached home sales averaged 324 sales per month (compared with 348 units per month one year ago).
 Total home sales increased year-over-year in Indio, Palm Desert and Cathedral City, and decreased year-over-year in Bermuda Dunes, Coachella, Indian Wells, La Quinta, Palm Springs. Rancho Mirage and Thousand Palms. Total home sales in Desert Hot Springs were the same as at this time last year. Market Watch pointed out that most of the year-over-year changes were small except in Rancho Mirage, Coachella and Palm Desert, where sales differences year-over-year ranged from 6% to 33%. Further, they noted that total home sales in Palm Springs and Palm Desert accounted for 44% of total sales.
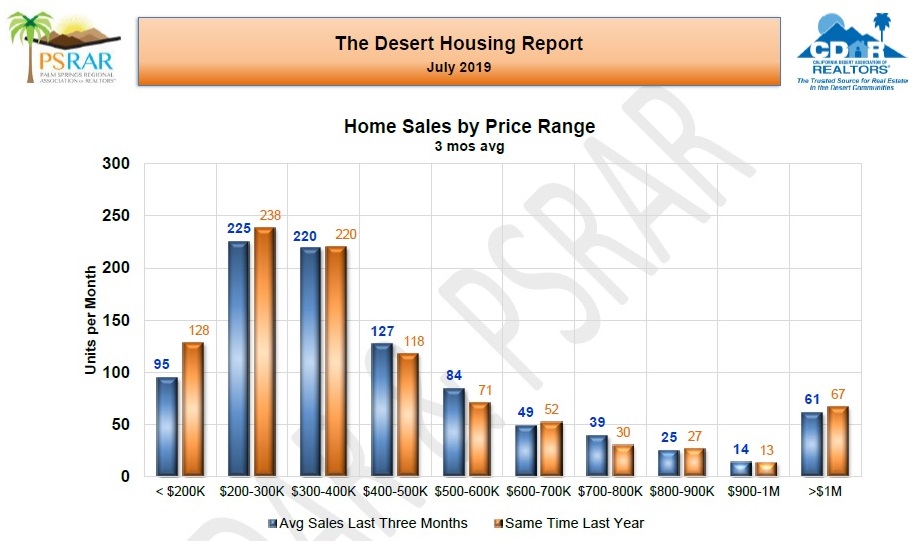 Total home sales for homes priced under $200,000 decreased by 25% from a year ago. Market Watch noted that with recent increases in home prices, most of this decline is due to the fact that there are simply fewer homes and condos selling for under $200,000. Market Watch felt that it was notable that sales of homes over a million dollars were down slightly from 67 units a month to 61 units and questioned whether this was an anomaly or an emerging trend.
 Coachella Valley housing inventory on August 1 stood at 2,722 units, which is the lowest August number in the last five years. Market Watch commented that the historical inventory pattern in the Coachella Valley is for seasonal lows to be reached in September followed by a steady rise in inventory until high numbers are reached, usually in March. Market Watch expects this seasonal pattern to continue this year. They also stated that while low inventory makes it more difficult for homebuyers to find acceptable homes, it is an important factor for maintaining and continuing price gains.
 The months of sales ratio (inventory divided by the average sales rate over the last 12 months) was 3.4 months (compared to 3.2 months of August 1st of last year). Market Watch noted that in the Coachella Valley, any months of sales number under four months is near historically low numbers. At 69 days, the median value of days on the market was just two days more than it was a year ago. Market Watch felt that these months of sales and days on the market numbers were positive indicators for a continuation of the higher price trend.
 In looking at the months of sales ratios across the different price brackets, Market Watch pointed out a consistent pattern of comparable months of sales ratios in all brackets to those of last year, which in their opinion meant that their predicted continuation of higher prices based on months of sales and days on the market should apply across all price ranges.
 In looking at months of sales ratios by city, all of the Coachella Valley cities had comparable ratios to last year except for Bermuda Dunes, Rancho Mirage and Indian Wells. Market Watch did note that the higher ratios for these three cities were still at acceptable levels. In their opinion, these months of sales by city ratios and the months of supply by price range ratios indicate a solid housing market for the Coachella Valley, without any signs of price or market excesses.
 The latest Sale Price Discount from List was -2.0% (the same as last month and at the same time last year). This ratio means the average home listed for $400,000 sold for $392,000 (an $8,000 price discount).

CalDRE# 01898254 | 01896117 | 02043759