Our local residential real estate market experts Market Watch LLC have just released their July 2021 Desert Housing Report. Some highlights:
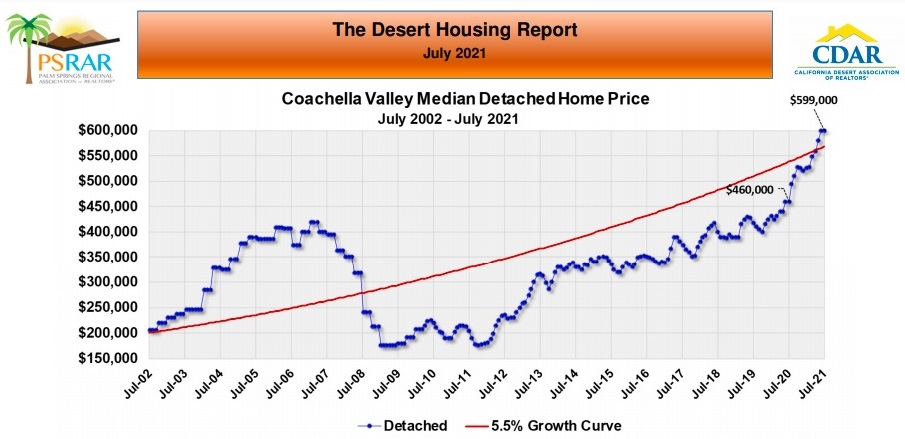 Detached Home Median Price: The Coachella Valley detached home median price was $599,000 in July (up 30.2% from $460,000 year-over-year).
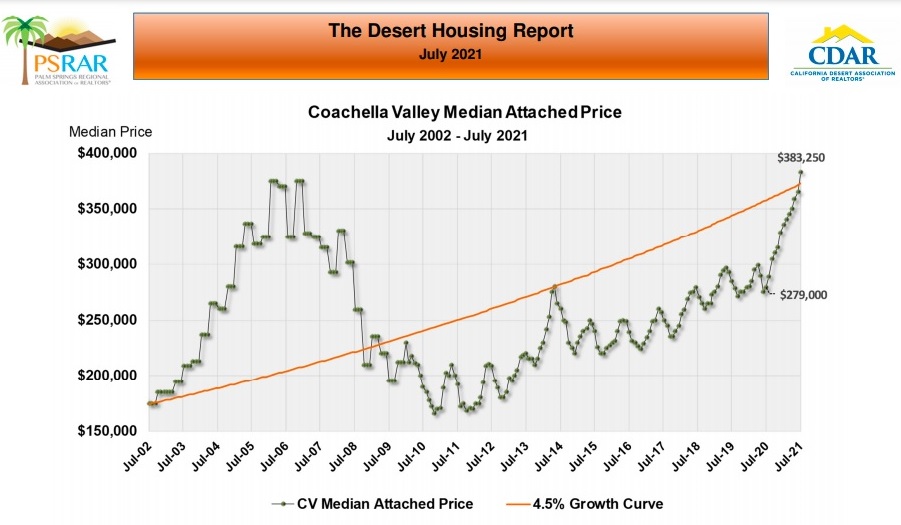 Attached Home Median Price: The Coachella Valley attached home median price was $383,250 in July (up 37.4% from $279,000 year over year). Both detached home and attached home median prices show the price surge in the Coachella Valley over the last twelve months. Again, both detached and attached home median prices also show the historic seasonal price pattern in the Coachella Valley with prices peaking in July before softening somewhat over the next four or five months. Market Watch’s experts expect a similar pattern this year. However, because of the extreme low inventory level and high demand they caution that the trend this year could be very muted.
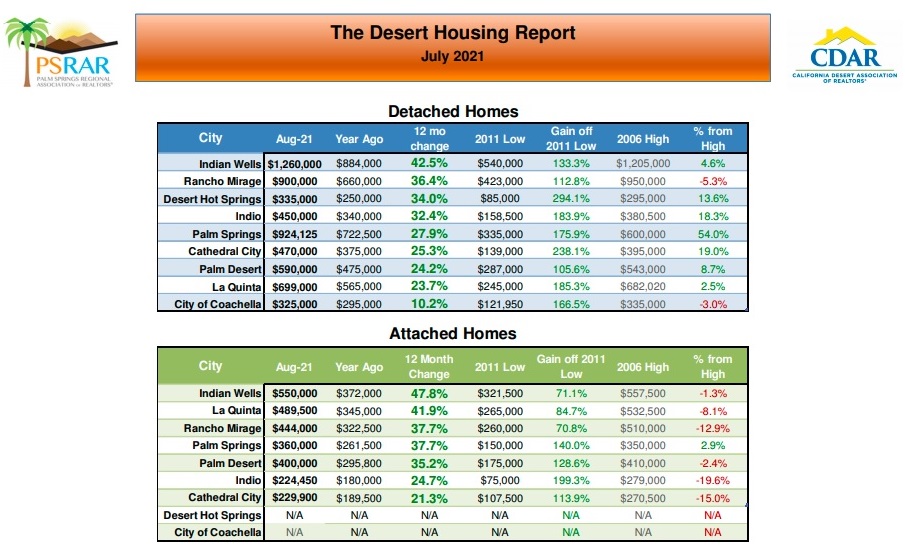 Median Prices By City: Detached home median prices increased year-over-year in July in all of the Coachella Valley cities surveyed. Increases ranged from 42.5% year-over-year in Indian Wells to 10.2% in Coachella. Four cities (Indian Wells, Rancho Mirage, Desert Hot Springs and Indio) had detached home median price increases of over 30% year-over-year. Detached home median prices were above the previous highs reached in 2006/2007 in every city except Rancho Mirage and Coachella. Attached home median prices also increased year-over-year in all of the Coachella Valley cities surveyed. Increases ranged from 47.8% year-over-year in Indian Wells to 21.3% in Cathedral City. Five cities (Indian Wells, La Quinta, Rancho Mirage, Palm Springs and Palm Desert) had attached home median price increases of over 30% year-over-year.
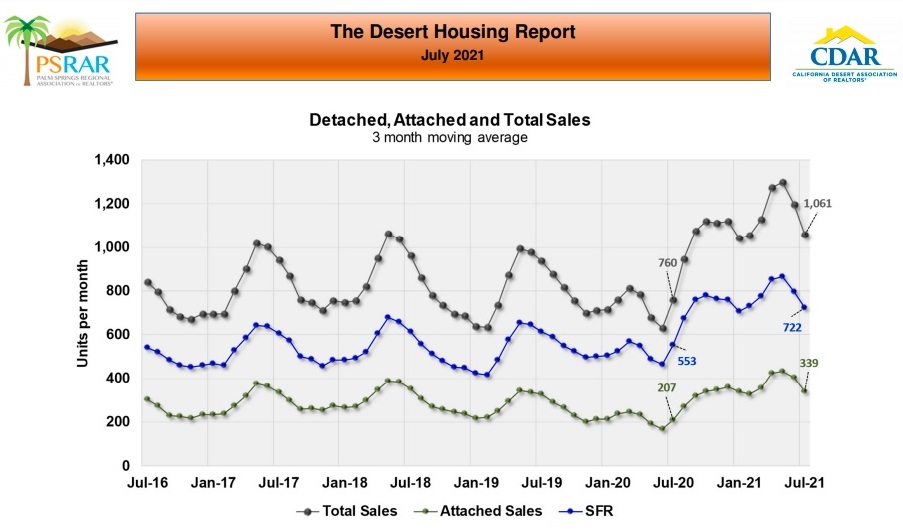 Home Sales (Three Month Moving Average): Total home sales in July averaged 1,061 homes per month. While this is down from total home sales of 1,200 homes per month in June, it is still an increase of 39.6% year-over-year. Market Watch felt that the decrease in home sales from June's sales appears to be the start of the historical normal seasonal sales decrease in the Coachella Valley, which the chart shows typically begins around June and carries through to November.
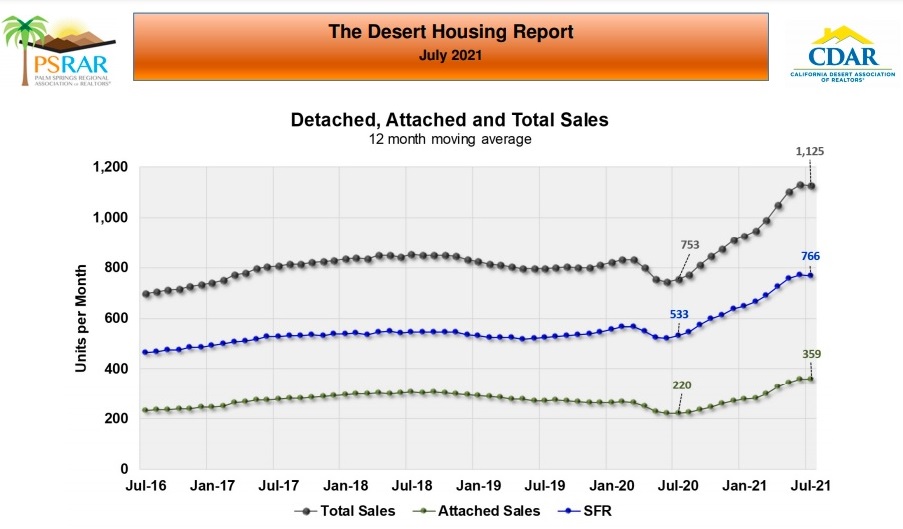 Home Sales (Twelve Month Moving Average): The twelve-month average of home sales, which removes all seasonality from the home sales figure, clearly shows the surge in home sales that began last July and has continued up until now. Total sales are currently averaging 1,125 homes per month (up 49.4% year-over-year).
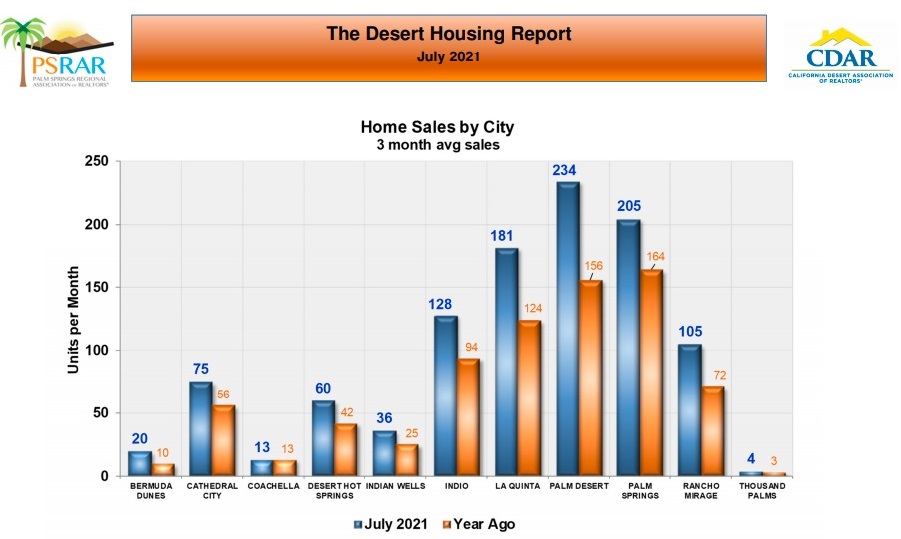 Home Sales By City: Market Watch noted that the largest year-over-year home sales increases in July continued to be in Palm Desert (up 50% year-over-year), La Quinta (up 46% year-over-year) and Rancho Mirage (up 45.8% year-over-year).
 Home Sales By Price Range: Market Watch pointed out that sales of homes priced under $300,000 decreased year-over-year, primarily due to the fact that the large increases in home prices have resulted in fewer and fewer homes in this price range. Sales of homes priced over one million dollars averaged 157 sales per month (up 127.5% from 69 sales per month in July 2020) and sales of homes priced between $900,000 and one million dollars averaged 40 sales per month (up 233.3% from 12 sales per month in July 2020).
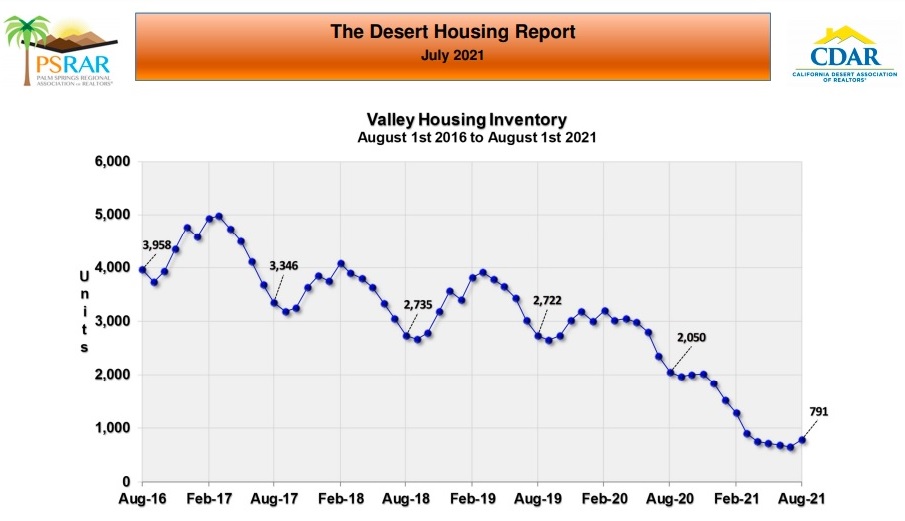 Coachella Valley Housing Inventory: On August 1st, there were 791 homes for sale in the Coachella Valley (down 61.4% from 2,050 homes in July 2020). Market Watch explained that this low level of inventory and surging sales are the two forces that continue to push home prices higher. However, they pointed out that we’re starting the six-month historical seasonal period when inventory normally increases and unless rising Covid infections were to again impede the willingness of homeowners to list their homes, they expect this seasonal pattern of increasing inventory to continue this year.
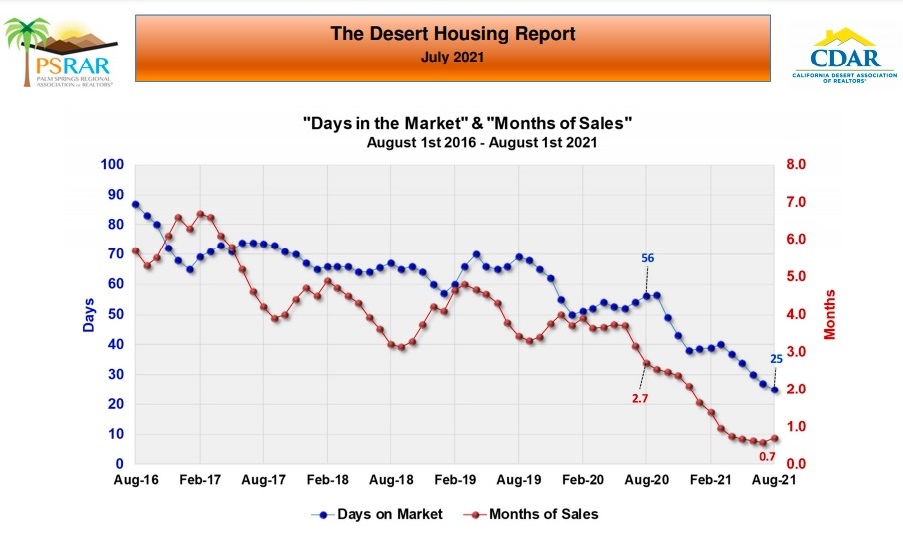 Months Of Sales and Days In The Market: The months of sales ratio at the end of July was 0.7 months or roughly 3 weeks (up slightly from the all-time low 0.6 months of supply in June but down significantly from the 2.7 months of supply in July 2020). The median value for days in the market in the Coachella Valley has dropped to just 25 days (less than half of the days in market of 56 days in July 2020).
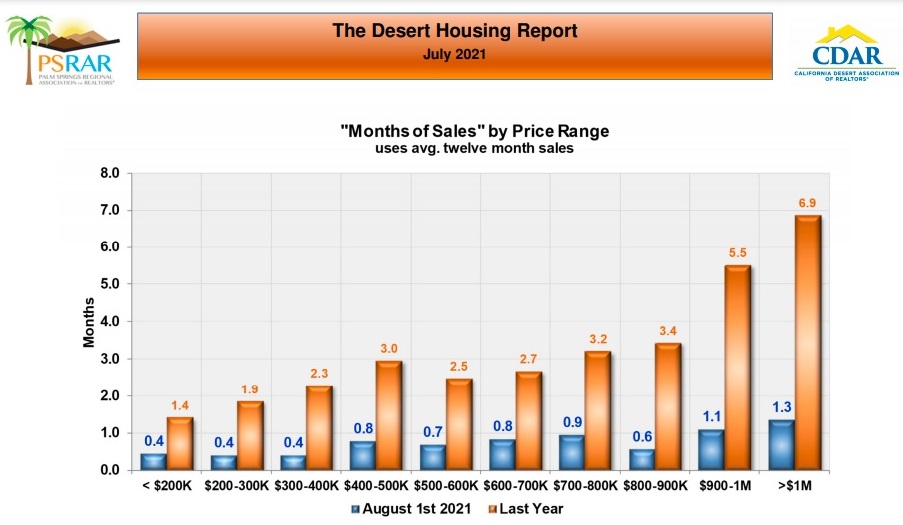 Months of Sales By Price Range: The months of sales ratio was below one month in every price range under $900,000 and the months of sales ratios were far below July 2020 levels in every price range.
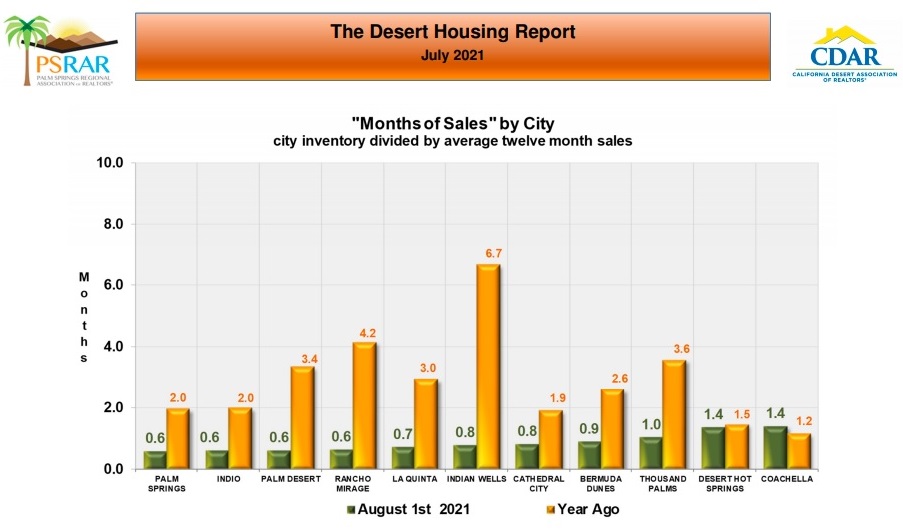 Months of Sales by City: Market Watch pointed out that record low month of sales ratios were reached in all of the Coachella Valley cities other than Coachella and Desert Hot Springs. However, Market Watch also noted that the months of sales ratios in Coachella and Desert Hot Springs were still near their historic lows. Market Watch took the opportunity to mention that the higher home price cities of Rancho Mirage and Indian Wells, which normally have higher than normal ratios due to their higher priced homes, have current ratios near those in the other nine cities in the region.
 Sale Price Discount from List: Lastly, the median value for sale price discount from list in July was again 0.0% (and has been the same for the last five months). Market Watch noted that in looking at the average sale price discount from list discount, it appeared that the average home in the Coachella Valley was selling for 1.7% above list price.
 The Legal Stuff
CalDRE# 01898254 | 01896117 | 01991628