
(Please click on the image above to view our YouTube shorts video)
Our local real estate market experts, Market Watch LLC, have just released their Desert Housing Report for July. Here are the highlights:
 COACHELLA VALLEY JULY HOME SALES RECOVERY: Market Watch explained that this data showed July Coachella Valley home sales relative to the historic norm based on July home sales in 2016, 2017, 2018 and 2019. For example, at the height of the pandemic in January 2021, Coachella Valley home sales were 59.5% above the norm. In January 2023, Coachella Valley home sales fell to 34.7% below the norm. After four months of improvement relative to the norm, Coachella Valley home sales stopped improving relative to the norm in July (23.1% below the July historic norm). Market Watch’s stated that their earlier prediction for normal Coachella Valley home sales by the end of the year (red dotted line) now appeared to be overly optimistic since it was based on their belief that inflation would fall to 3% and mortgage rates would fall to 5.5% by year-end. They felt that the recent actions by the Federal Reserve made this unlikely.
 COACHELLA VALLEY JULY DETACHED HOME MEDIAN PRICE: The median price of a detached home in the Coachella Valley at the end of July was $665,500 (down 6.3% from $710,000 in July 2022). Market Watch felt that this detached home median price decrease was primarily a seasonal decrease as the summer almost always brings some price weakness. Market Watch did not expect this to translate into anything more than a seasonal issue since the forces of supply and demand in the Coachella Valley seemed to be equally balanced (with home sale inventory contracting and home sales remaining at low levels).
 COACHELLA VALLEY JULY ATTACHED HOME MEDIAN PRICE: The median price of an attached home in the Coachella Valley at the end of July was $450,000 (down 6.2% from $479,500 in July 2022). Market Watch noted that this monthly decline, while abnormally large, was still seasonal. They predicted additional price weakness over the next two or three months. However, with the Coachella Valley’s supply and demand expected to remain in balance, they felt that this period of price weakness would pass.
 COACHELLA VALLEY JULY TWELVE MONTH CHANGE IN THE PRICE OF THE AVERAGE SIZE HOME BY CITY: In July, every Coachella Valley city, other than Desert Hot Springs, had a year-over-year decrease in the price of their average size detached home. These price decreases ranged from -4.3% for the 1,700 sq ft average size detached home in Coachella to -10.2% for the 2,500 sq ft average size detached home in Bermuda Dunes. In Desert Hot Springs, the price of the 1,600 sq ft average size detached home increased 2% year-over-year. In July, three Coachella Valley cities (Indian Wells, Desert Hot Springs and Rancho Mirage) had a year-over-year increase in the price of their average size attached homes, ranging from +1% for the 1,775 sq ft average size attached home in Rancho Mirage to +11% for the 1,950 sq ft average size attached home in Indian Wells. In July, the price of the average size attached home in the remaining Coachella Valley cities decreased year-over-year, ranging from -0.4% for the 1,750 sq ft average size attached home in La Quinta to -15.6% for the 1,450 sq ft average size attached home in Bermuda Dunes.
 COACHELLA VALLEY JULY MONTHLY HOME SALES (THREE MONTH TRAILING AVERAGE): In July, the three-month average of home sales in the Coachella Valley was 717 units (down 55 home sales or 7.1% from 772 home sales in June and down 74 home sales or 9.8% from 791 home sales in July 2022). Market Watch felt that some of this decrease was seasonal and noted that it was occurring equally in both detached and attached home sales.
 COACHELLA VALLEY JULY MONTHLY HOME SALES (TWELVE MONTH TRAILING AVERAGE): In July, the 12-month average of home sales in the Coachella Valley (which removes seasonality from the home sales data) was 582 home sales per month (down 279 home sales or 32.4% from 861 monthly home sales in July 2022). Market Watch predicted that home sales should begin to slowly increase in a month or two. However, they felt that Coachella Valley home sales would not fully recover until mortgage rates came down from 7.5% to around 5%.
 COACHELLA VALLEY JULY MONTHLY HOME SALES BY CITY: In July, monthly home sales decreased in every Coachella Valley city, other than La Quinta and Coachella. The largest percentage decreases in monthly home sales were in Bermuda Dunes (down 37.5%) and Palm Springs (down 18.5%). Monthly home sales increased year-over-year by 6.3% in La Quinta and remained the same in Coachella.
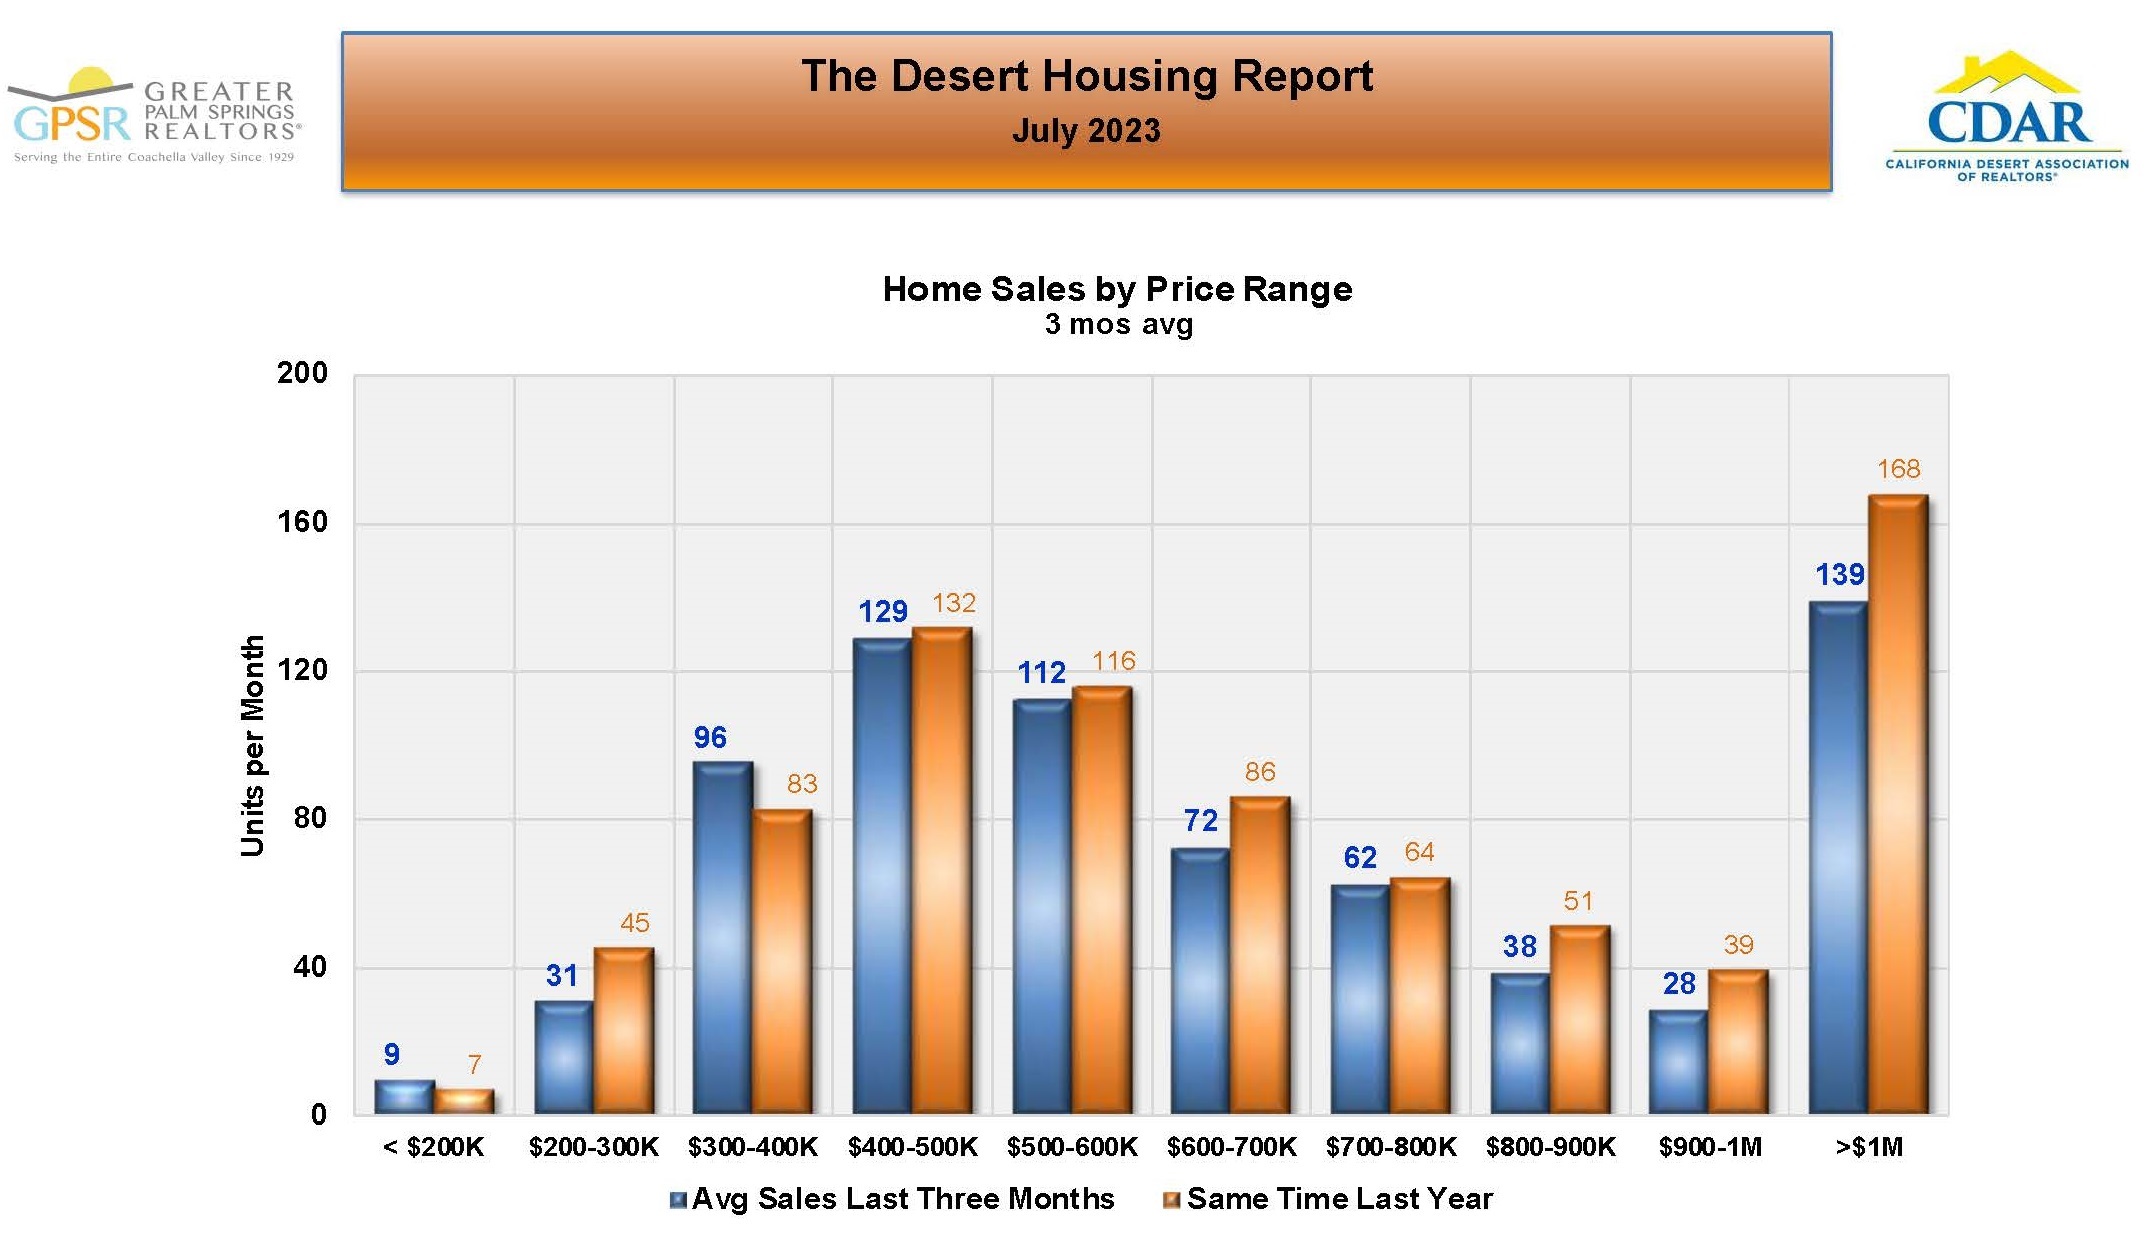 COACHELLA VALLEY JULY MONTHLY HOME SALES BY PRICE RANGES: Market Watch noted that monthly home sales in all price ranges were comparable to year ago home sales. Only sales of homes priced from $300k to $400k, which are primarily condominiums and attached homes, were higher than a year ago. Sales of million plus dollar homes were down 17.3% (about the same as last month).
 COACHELLA VALLEY AUGUST 1ST HOME SALE INVENTORY: On August 1st, the Coachella Valley home sale inventory was 1,629 homes (112 homes or 6.4% less than 1,741 homes on July 1st and almost the same as the 1,637 home sale inventory on August 1st, 2022). Market Watch explained that inventory has been declining very gradually over the last five months. While some of this is seasonal, they felt that the primary reason inventory isn’t growing is the low number of new listings. They predicted that in light of the seasonal pattern of Coachella Valley inventory, inventory should begin its seasonal increase starting next month.
 COACHELLA VALLEY AUGUST 1ST REGIONAL MONTHS OF SALE RATIO: On August 1st , the Coachella Valley’s months of sales ratio was 2.8 months (down from 3.2 months in June but up from 1.9 months on August 1st, 2022). Market Watch felt that a months of sale ratio of 2.8 months was representative of a balanced housing market, which they felt helps keep home prices stable.
 COACHELLA VALLEY AUGUST 1ST MONTHS OF SALES RATIO BY PRICE RANGES: On August 1st, the months of sales ratio was higher than year ago levels in every price range. Market Watch pointed out that the increase in the months of sale ratio as prices get higher is the normal pattern, as higher price homes usually take longer to find qualified homebuyers.
 COACHELLA VALLEY AUGUST 1ST MONTHS OF SALES RATIO BY CITY: On August 1st, seven Coachella Valley cities had months of sales ratios under three months (which Market Watch noted is in the middle of the range of ratios that indicate a balanced market). Market Watch commented on how close the months of sales ratios were in all Coachella Valley, which to them indicated that supply and demand in all the Coachella Valley housing markets are in balance.
 COACHELLA VALLEY JULY REGIONAL DAYS IN THE MARKET: Market Watch noted that in July the median selling time in the region continued to decrease. At the end of July, the median number of days in the market in the Coachella Valley was 39 days (compared to 24 days in July 2022 and the most recent high of 49 days in February of this year. Because of dwindling inventory, Market Watch predicted that the days in the market would gradually decrease due to dwindling inventory.
 COACHELLA VALLEY JULY DAYS IN THE MARKET BY CITY: In July, Coachella had the lowest median selling time for detached homes (17 days), followed by Cathedral City (33 days) and Desert Hot Springs (34 days). In July, Desert Hot Springs had the lowest median selling time for attached homes (29 days), followed by Palm Springs (32 days) and Indian wells (34 days).
 COACHELLA VALLEY JULY PERCENTAGE OF HOMES SELLING ABOVE LIST PRICE: In July, 17.9% of home sales averaged over the last three months sold above list price, compared to 48.3% in July 2022. Market Watch commented that July’s three month average was almost the same as June’s and indicated that about one in every six homes in the Coachella Valley sold above list price in June and July. Market Watch expected this percentage to increase if home sales were to stabilize and inventory were to continue to shrink.
 COACHELLA VALLEY JULY AVERAGE PRICE DISCOUNT BY CITY: For detached homes in the Coachella Valley in July, every city but Coachella had an average selling price discount, ranging from -0.3% in Cathedral City to -2.9% in Rancho Mirage and Indian Wells. Average selling price discounts for attached homes in the Coachella Valley in July ranged from -0.8% in Indio to -6.1% in Bermuda Dunes.

The Briggs Group / Coldwell Banker Realty | Laurie Briggs DRE 01896117 | Tim Briggs DRE 01898254 | Coldwell Banker Realty DRE 00616212