 (Please click on the image above to view our short YouTube video)
Local real estate market experts, Market Watch LLC have just released their June 2021 Desert Housing report. Some highlights:
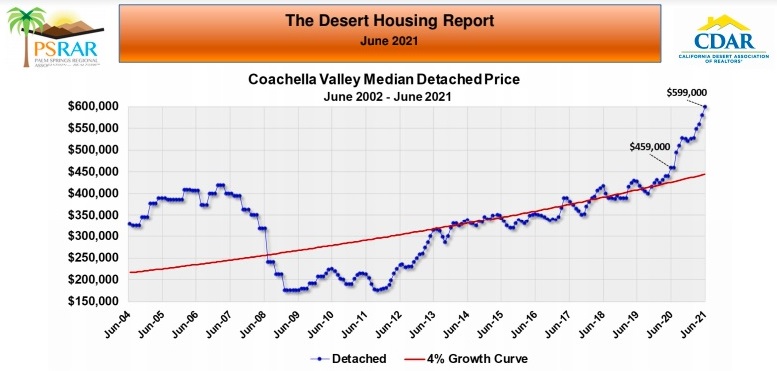 In June, the Coachella Valley detached home median price was $599,000 (up 30.5% from $459,000 one year ago).
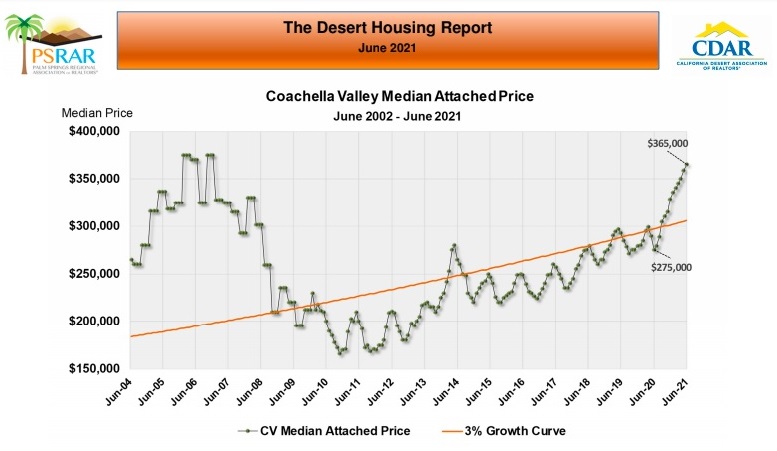 In June, the Coachella Valley attached home median price was $365,000 (an increase of 32.7% from $275,000 one year ago). Market Watch’s analysis pointed out the very distinct seasonal pattern in attached home prices, with prices traditionally reaching a peak in June before softening over the next four or five months. Market Watch expects a similar pattern to develop this year but much more muted because of so little housing inventory and such heavy demand.
 Detached home median price increases year-over-year ranged from 48% in Rancho Mirage to 9.1% in Coachella. Year over year, detached home median prices increased by over 30% in Rancho Mirage, Palm Springs, Indian Wells, Desert Hot Springs and Indio. Significantly, detached home median prices are now above the previous 2006-2007 highs in Palm Springs, Indian Wells, Desert Hot Springs, Indio, Palm Desert, La Quinta and Cathedral City. Attached home median price increases year-over-year ranged from 48.6% in La Quinta to 13.7% in Indio. Year-over-year, attached home median prices increased by more than 30% in La Quinta, Rancho Mirage and Indian Wells. Attached home median prices are still below the previous 2006-2007 high prices in all 7 Coachella Valley cities surveyed.
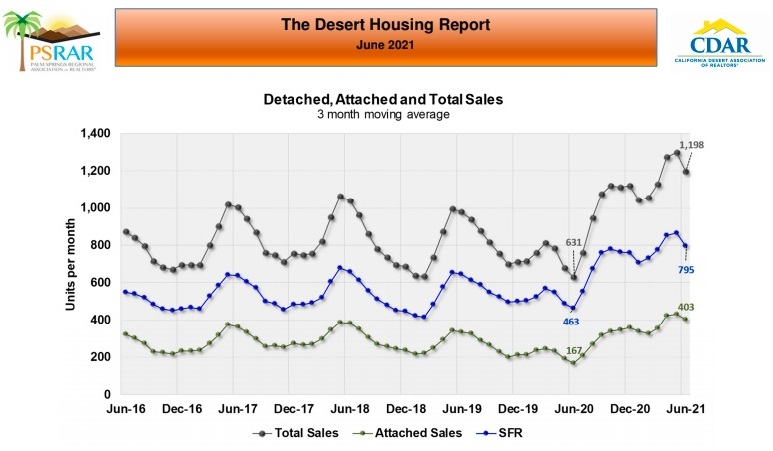 In June, the 3-month average of total home sales was 1,198 sales per month. While this is down from May’s 3-month average total home sales of 1,300 home sales per month, year-over-year June average total home sales were up almost 90% year-over-year. Market Watch felt that the decline in sales from May to June could be the start of the normal seasonal decline in sales in the June to November time frame.
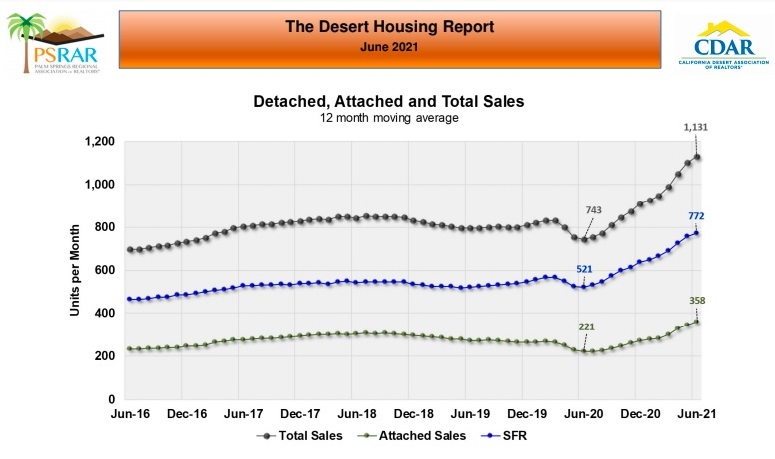 In June, the 12-month average of total homes sales was 1,131 home sales per month (up 52.2% from 743 home sales per month one year ago). Average monthly detached home sales in June were 772 home sales per month (up 48.2% from 521 home sales per month one year ago). Average monthly attached homes sales per month in June were 358 home sales per month (up 62.0% from 221 home sales per month one year ago).
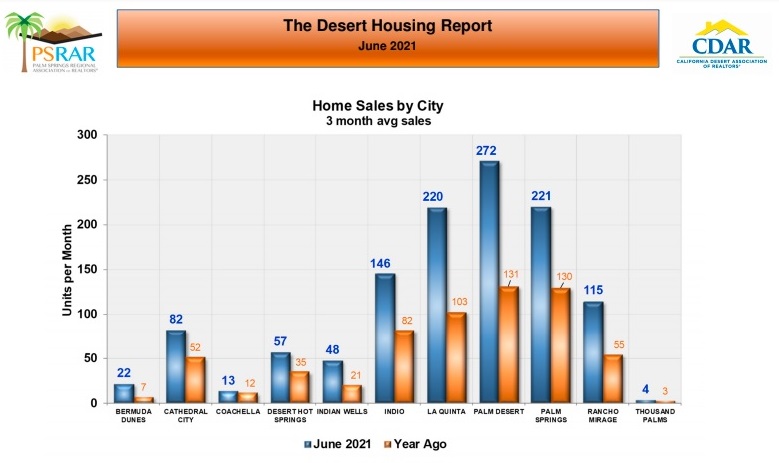 Average monthly home sales increased in every city in the Coachella Valley. The largest gains occurred in Bermuda Dunes (up 214.3% year-over-year), Indian Wells (up 129.0% year-over-year), La Quinta (up 113.6% year-over-year) and Palm Desert (up 107.6% year-over-year).

Market Watch’s analysis noted that sales of homes priced under $300,000 remain low because there are fewer and fewer home left in this price range due to home price increases. Sales of homes priced over $1 million averaged 187 home sales per month (up 240% from 55 home sales per month one year ago). Sales of homes priced between $900,000 and $1 million averaged 44 home sales per month (up 300% from 11 home sales per month one year ago).
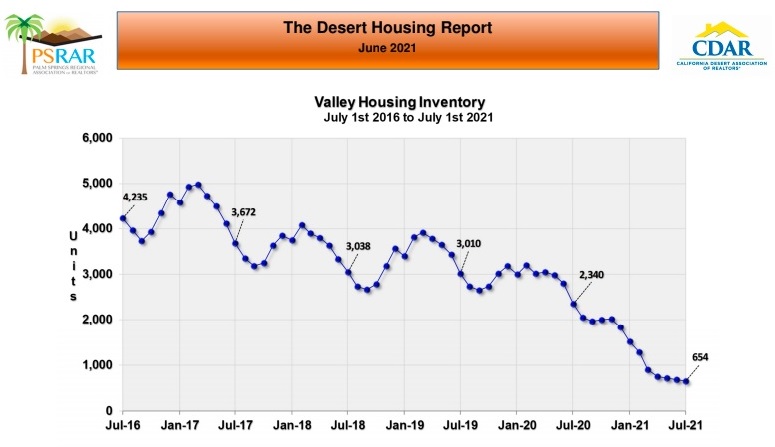
On July 1st, there were 654 homes for sale in the entire Coachella Valley (down 72.1% from 2,340 homes for sale on July 1st, 2020). Market Watch’s analysis stated that this lack of supply of homes coupled with surging home sales were responsible for increasing home prices. Market Watch went on to state that if inventory follows its tradition seasonal pattern, inventory might continue to decline, at least until widespread use of the COVID-19 vaccines results in increased inventory moving into 2022.
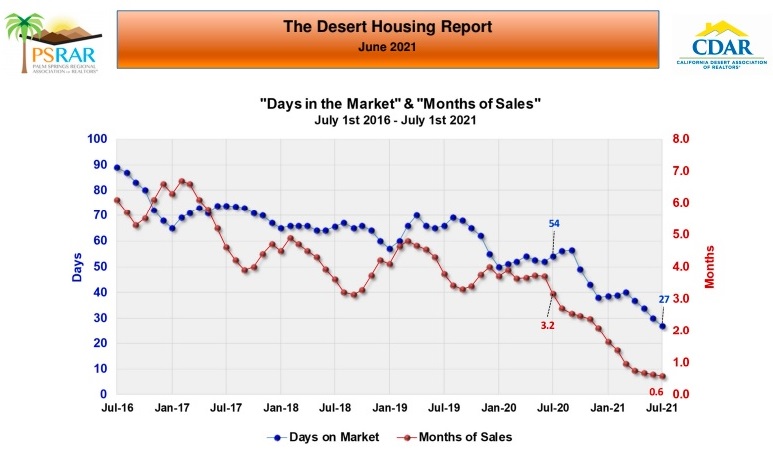
The month of sales ratio at the end of June was 0.6 months, the lowest ratio in history. At the current home sales rate, inventory would be completely absorbed in roughly two weeks (compared to 3.7 months one year ago). The median value for days in the market in the Coachella Valley was 27 days in June (compared to 54 days a year ago). Market Watch’s analysis stated that they expect this metric to continue to decrease, since housing demand continues to far exceed housing supply.
 Except for the $700,000-$800,000, $900,000-$1 million and the over $1 million price ranges, the months of sales ratio was at or below 0.6 of a month in all other price ranges. The months of sales ratio for homes priced over $1 million was 1.3 months in June, which Market Watch pointed out is the lowest ratio in history.
 On July 1st, the month of sales ratio in every major city of the Coachella Valley, other than Desert Hot Springs, was 9/10 of a month or lower. Market Watch’s analysis noted that even in Rancho Mirage and Indian Wells, which normally have the highest ratios in the region because of their higher priced homes, the months of sales ratios were 0.5 months and 0.7 months, respectively.
 Lastly, the median sale price discount from list in June was 0.0% (as it has been for the last 4 months). Market Watch’s analysis explained that since the median value is the middle value of all sales in the sample, in the current market more homes are selling at exactly their list price than above or below it, which causes the median number to be zero.

CalDRE# 01898254 | 01896117 | 01991628