Here are some of the highlights from June 2026 GPSR Desert Housing Report from Coachella Valley real estate market experts Market Watch LLC:
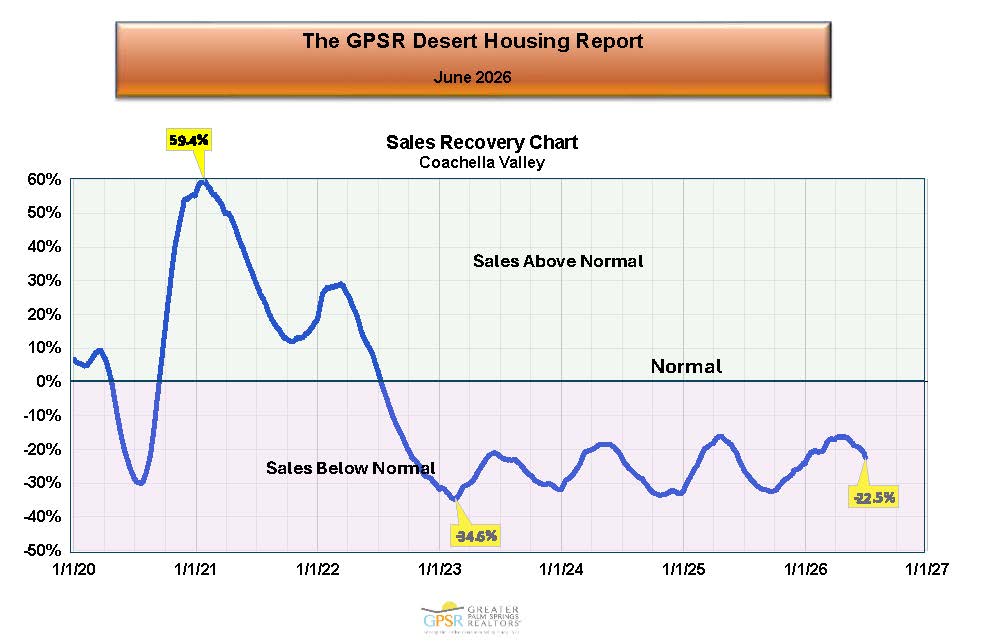 COACHELLA VALLEY JUNE HOME SALES RECOVERY
Home Sales Recovery data shows where current Coachella Valley home sales are as a percentage of historic norms, with norms being June average monthly home sales over the years 2016, 2017, 2018 and 2019. In June, Coachella Valley home sales were below June norm sales by 22.5% (down from 19.3% last month, showing Coachella Valley home sales slowing in June, but still a slight improvement from June 2025 where average monthly home sales were 26% below June norm sales).
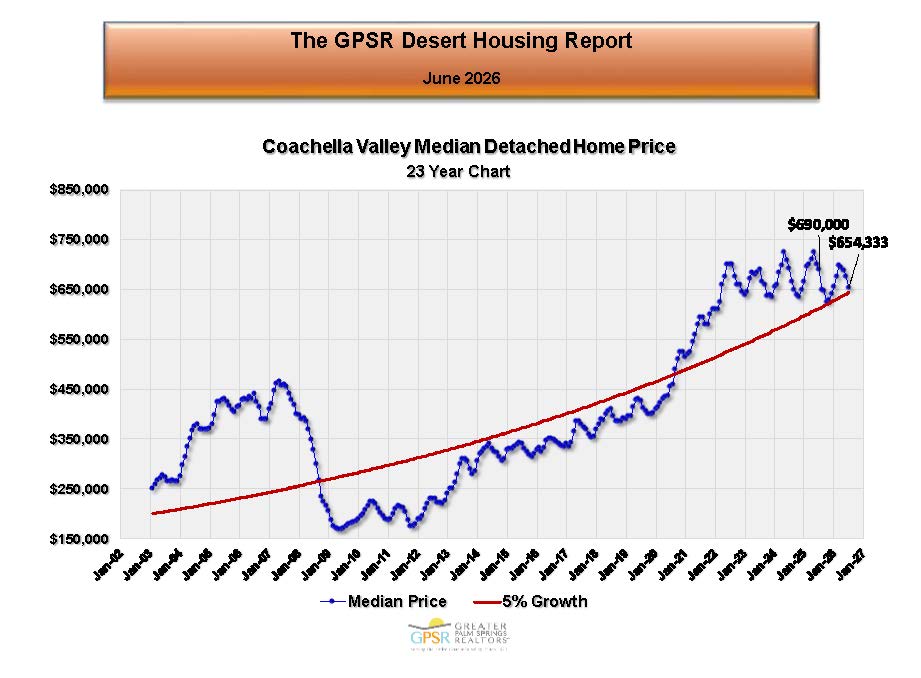 COACHELLA VALLEY JUNE DETACHED HOME MEDIAN PRICE
The median price of a detached home in the Coachella Valley in June was $654,333 (down 5.2% from $690,000 in June 2025). Market Watch commented on the seasonal pattern where the detached home median price in the Coachella Valley usually hits its seasonal low in Autumn and its high in Spring. They also mentioned that detached homes in the Coachella Valley have generally maintained the price gains that occurred during the pandemic.
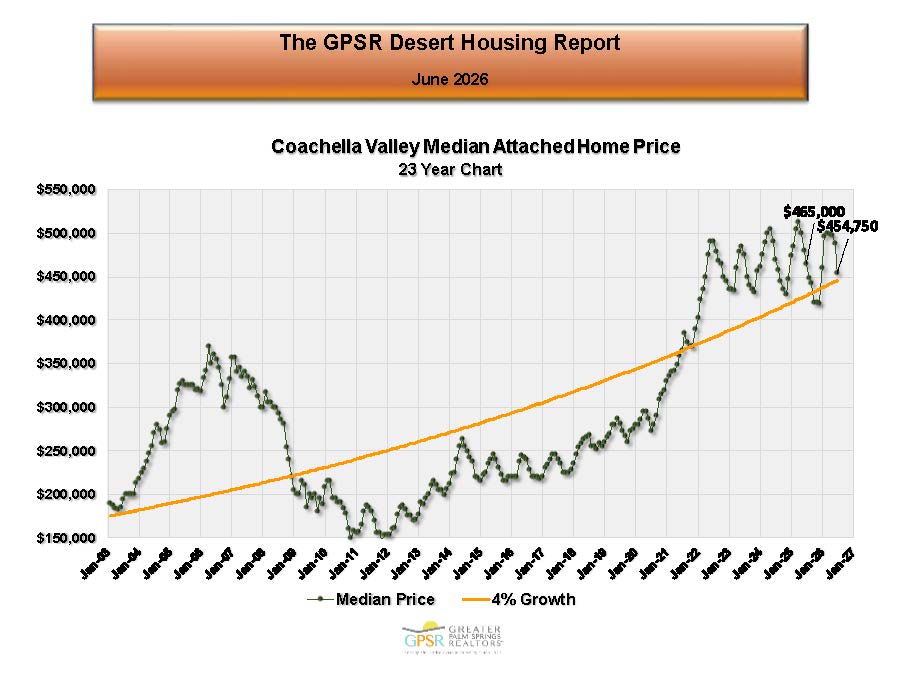 COACHELLA VALLEY JUNE ATTACHED HOME MEDIAN PRICE
The median price of an attached home in the Coachella Valley in June was $454,750 (down 2.2% from $465,000 in June 2025). Market Watch observed that attached home median prices followed the same seasonal pattern as was observed for detached homes, but with a much larger price variation from low to high.
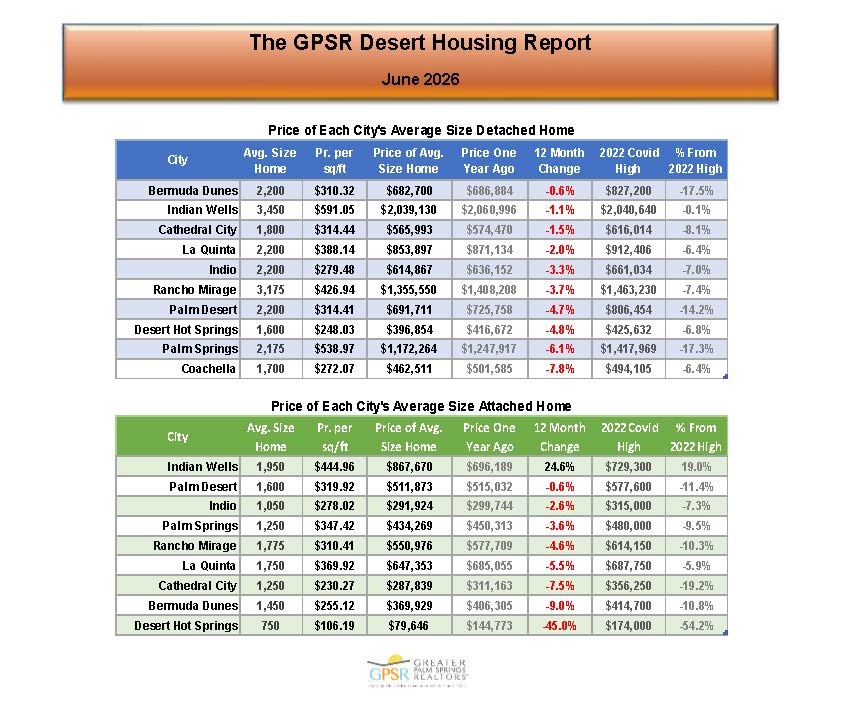 COACHELLA VALLEY JUNE YEAR-OVER-YEAR CHANGE IN THE PRICE OF THE AVERAGE SIZE HOME BY CITY
In June, the year-over-year changes in the price of the average size detached home in each Coachella Valley city ranged from a decrease of 0.6% for the 2,200 sq ft average size detached home in Bermuda Dunes (decreasing to $682,700 from $686,884 in June 2025) to a decrease of 7.8% for the 1,700 sq ft average size detached home in Coachella (decreasing to $462,511 from $501,585 in June 2025). The year-over-year changes in the price of the average size attached home in each Coachella Valley city ranged from an increase of 24.6% for the 1,950 sq ft average size attached home in Indian Wells (increasing to $867,670 from $696,189 in June 2025) to a decrease of 45% for the 750 sq ft average size attached home in Desert Hot Springs (decreasing to $79,646 from $144,773 in June 2025).
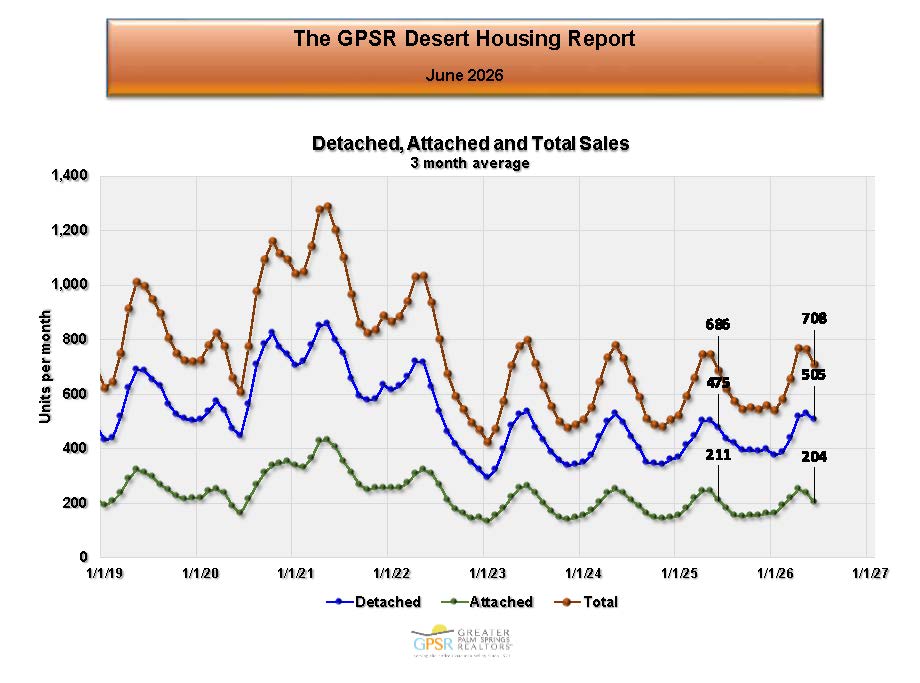 COACHELLA VALLEY JUNE AVERAGE MONTHLY HOME SALES (THREE MONTH AVERAGE)
Coachella Valley three-month average home sales in June were 708 homes (up 3.3% from 686 average monthly home sales in June 2025). Market Watch explained that because of the “seasonality” of Coachella Valley home sales, it had been difficult to determine where home sales stood on a historical basis. They explained that the Home Sales Recovery information outlined above helped to distinguish seasonal changes in home sales from real changes in home sales.
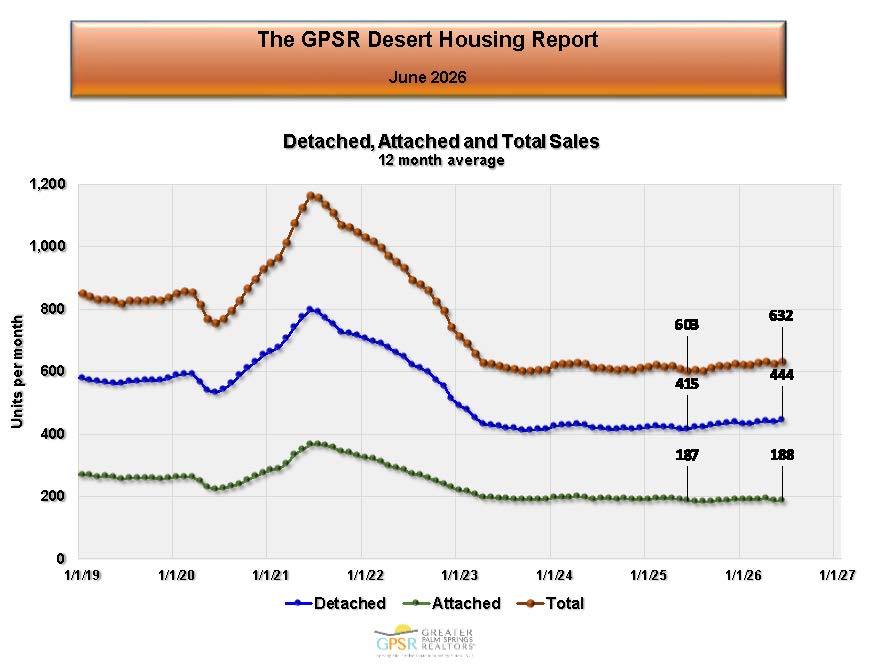 COACHELLA VALLEY JUNE AVERAGE MONTHLY HOME SALES (TWELVE MONTH AVERAGE)
Coachella Valley 12-month average monthly home sales in June (which removes the seasonality in Coachella Valley home sales data) were 632 homes per month (up 4.8% from 603 home average monthly sales per month in June 2025). Market Watch noted that while the housing market continues to need lower mortgage rates, the Federal Reserve Board has stopped lowering short-term rates until the effect of the administration’s new economic policies can be determined.
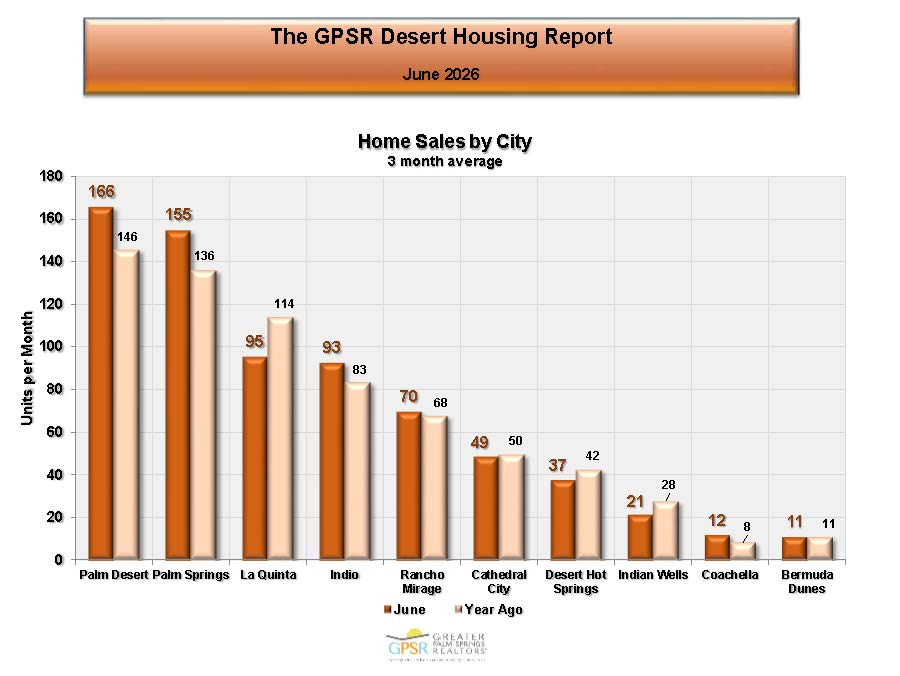 COACHELLA VALLEY JUNE MONTHLY HOME SALES BY CITY
In the Coachella Valley, Palm Desert had the highest average monthly home sales in June at 166 homes (up 12.2% from 148 average monthly home sales in June 2025), followed by Palm Springs with 155 average monthly home sales (up 14% from 136 average monthly home sales in June 2025) and then La Quinta with 95 average monthly home sales (down 16.7% from 114 average monthly home sales in June 2025). Coachella had the lowest average monthly home sales at 11 homes (the same as in June 2025).
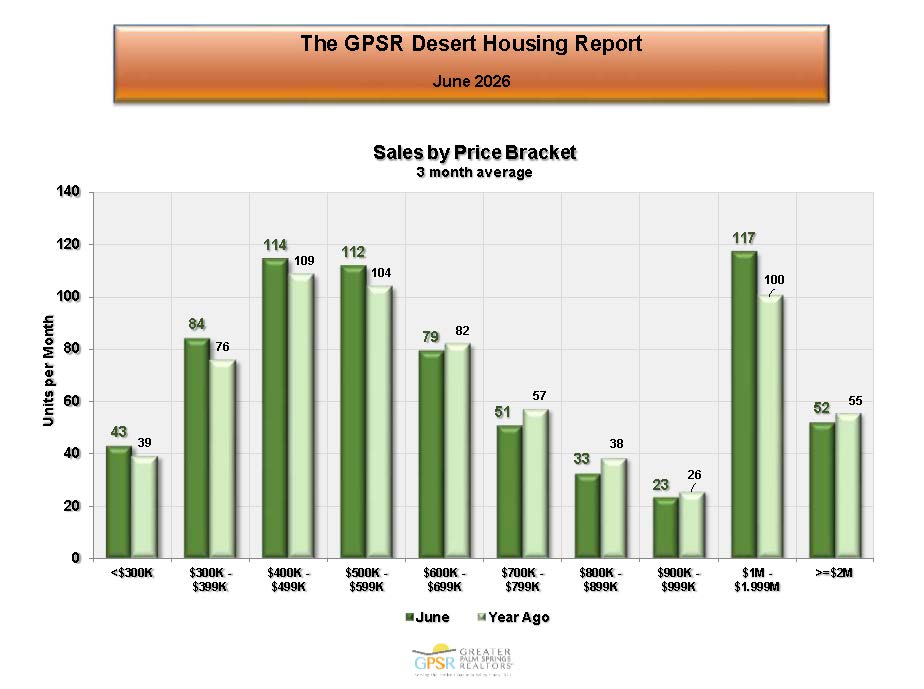 COACHELLA VALLEY JUNE MONTHLY HOME SALES BY PRICE RANGE
The highest average monthly home sales in the Coachella Valley in June were 117 homes for homes priced between $1M and $1.999M (up 17% from 100 average monthly home sales in June 2025). The lowest average monthly home sales of 23 homes was for homes priced between $900K and $999K (down 11.5% from average monthly home sales of 26 homes in June 2025).
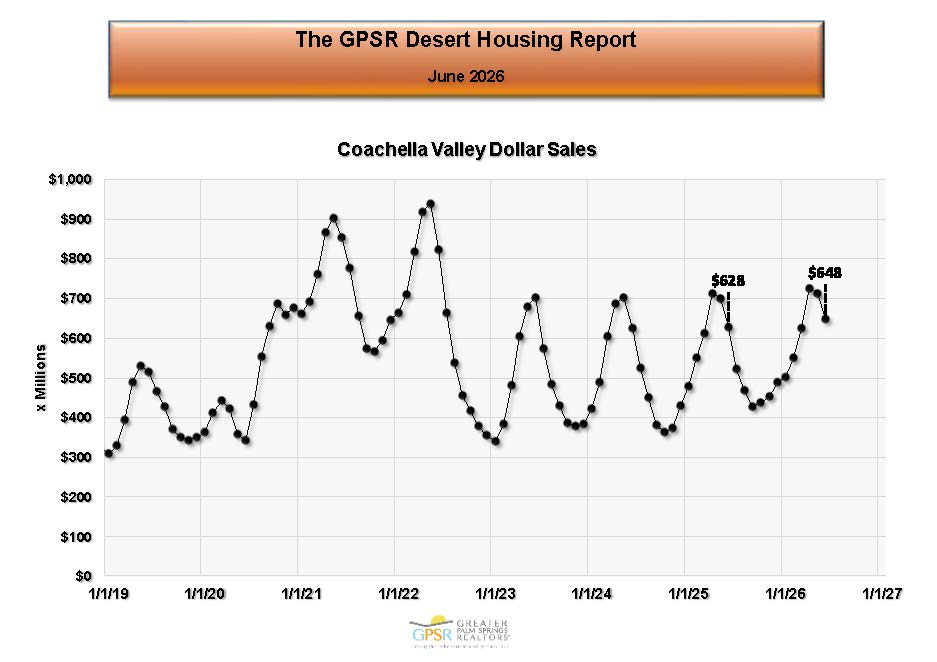 COACHELLA VALLEY JUNE MONTHLY HOME SALES IN DOLLARS
Coachella Valley home sales in June were $648 million (up 3.2% from average monthly home sales of $628 million in June 2025 but down 8.5% from average monthly home sales of $708 million last month).
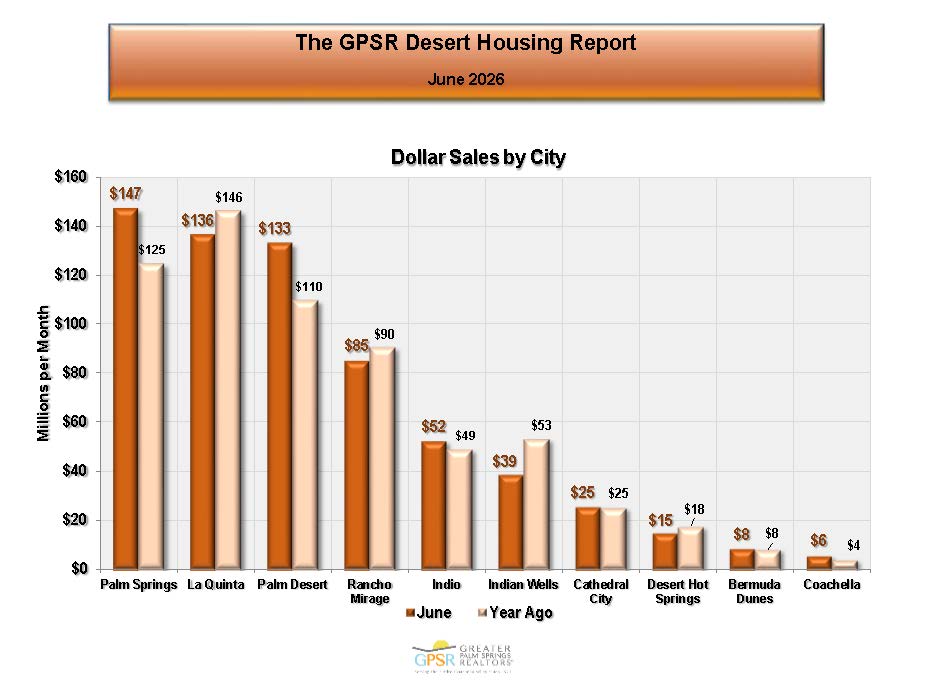 COACHELLA VALLEY JUNE MONTHLY HOME SALES IN DOLLARS BY CITY
In the Coachella Valley in June, the highest average monthly home sales in dollars were in Palm Springs at $147 million (up 17.6% from average monthly home sales of $125 million in June 2025). This was followed by La Quinta with average monthly home sales of $136 million (down 6.8% from average monthly home sales of $146 million in June 2025) and Palm Desert with average monthly home sales of $133 million (up 20.9% from average monthly homes of $110 million in June 2025). The Coachella Valley’s lowest average monthly home sales in dollars were in Coachella with average monthly home sales of $6 million (up 50% from average monthly home sales of $4 million in June 2025).
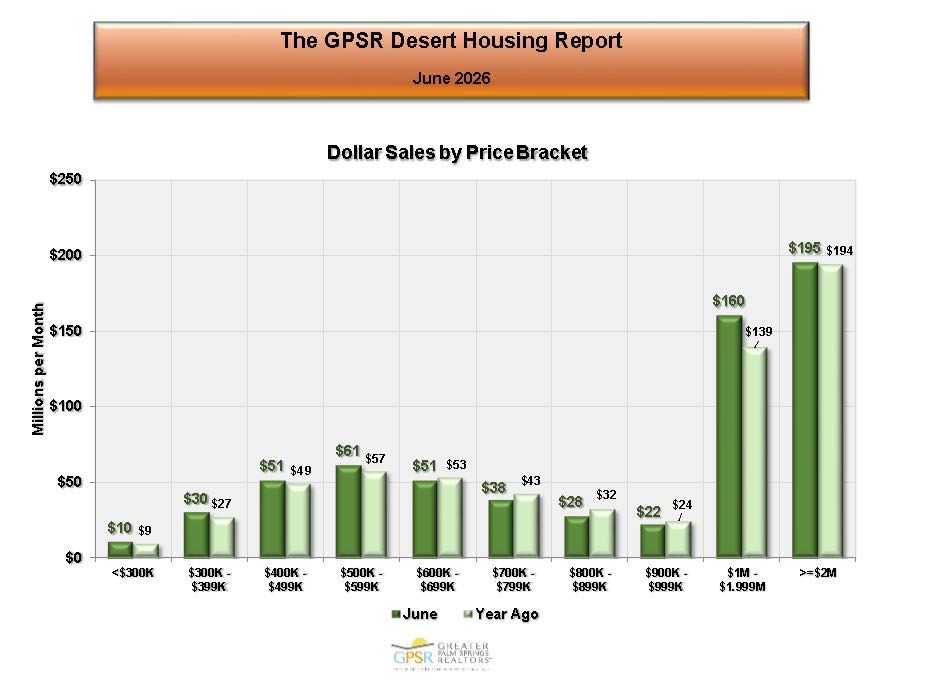 COACHELLA VALLEY JUNE MONTHLY HOME SALES IN DOLLARS BY PRICE RANGE
In the Coachella Valley in May, the highest average monthly home sales were $195 million for homes priced over $2 million (up 0.5% from average monthly home sales of $194 million in June 2025). This was followed by average monthly home sales of $160 million for homes priced between $1 million and $1.999 million (up 15.1% from average monthly home sales of $139 million in June 2025). The lowest average monthly home sales were $10 million for homes priced under $300K (up slightly from $9 million in June 2025). Market Watch noted that the total dollar sales for homes priced over $1 million accounted for 54.9% of all home sales in dollars in the Coachella Valley.
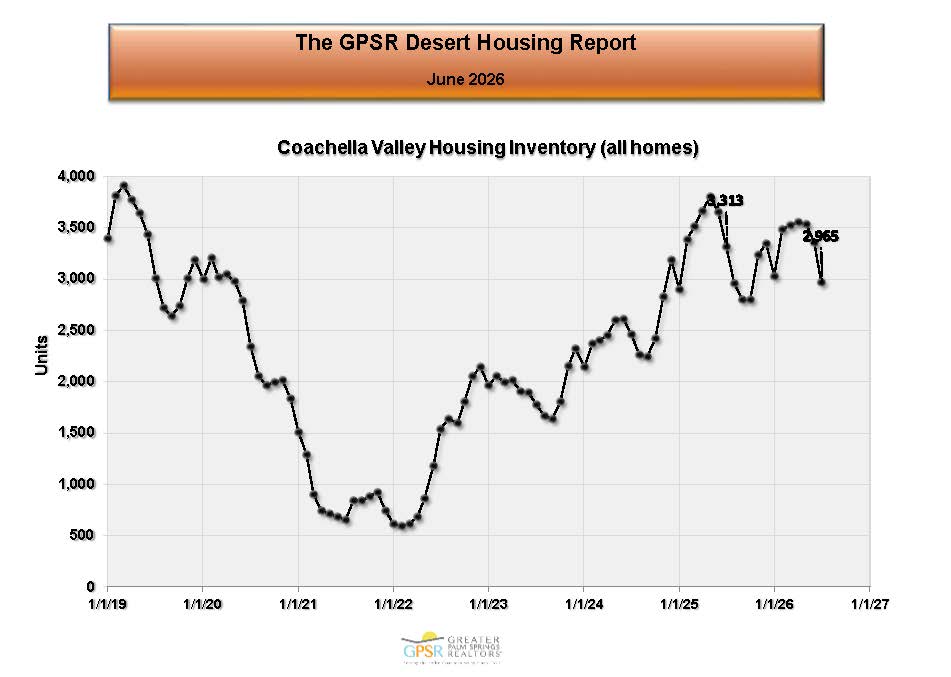 COACHELLA VALLEY JULY 1ST HOME SALE INVENTORY
On July 1st, the combined inventory of detached and attached homes in the Coachella Valley was 2,965 homes (down 10.5% from 3,313 homes on July 1st, 2025 and down 11.7% from 3,358 homes on June 1st of this year). Market Watch noted that inventory has improved from pandemic lows to pre-pandemic inventory levels. They added that housing inventory in the Coachella Valley is very seasonal, with a high inventory level in March/April and a low inventory level in late Summer.
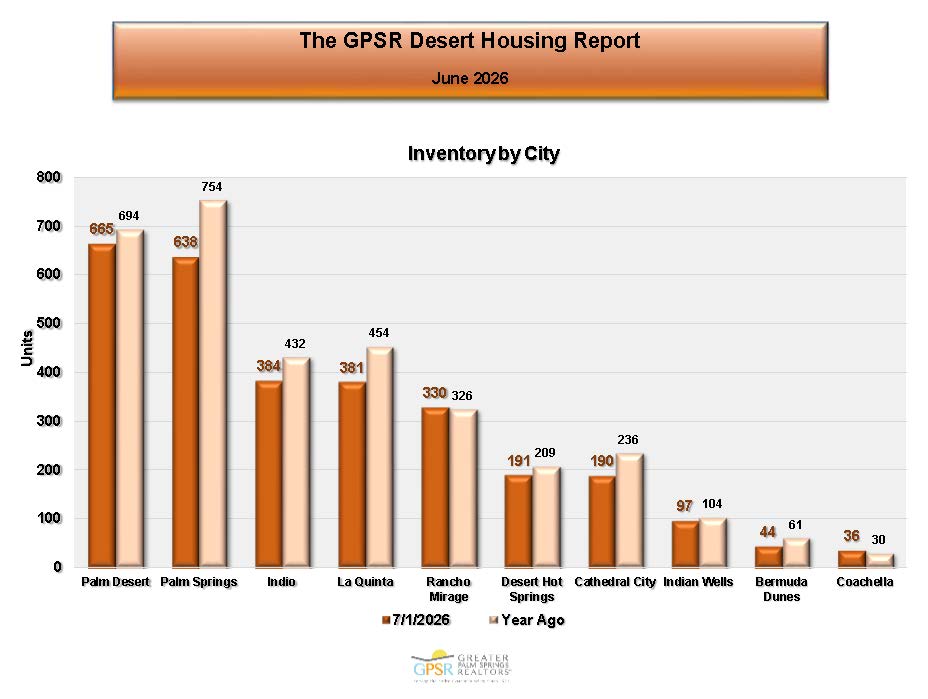 COACHELLA VALLEY JULY 1ST HOME SALE INVENTORY BY CITY
The Coachella Valley city with the highest inventory level on July 1st was Palm Desert with 665 homes for sale (down 4.2% from 694 homes for sale on July 1st, 2025), followed by Palm Springs with 638 homes for sale (down 15.4% from 754 homes for sale on July 1st, 2025). The Coachella Valley city with the lowest inventory level on July 1st was Coachella with 36 homes for sale (up 20% from 30 homes for sale on July 1st, 2025). Market Watch noted that this information could help agents determine what cities have homeowners with the greatest selling interest and how the selling interest compares to last year.
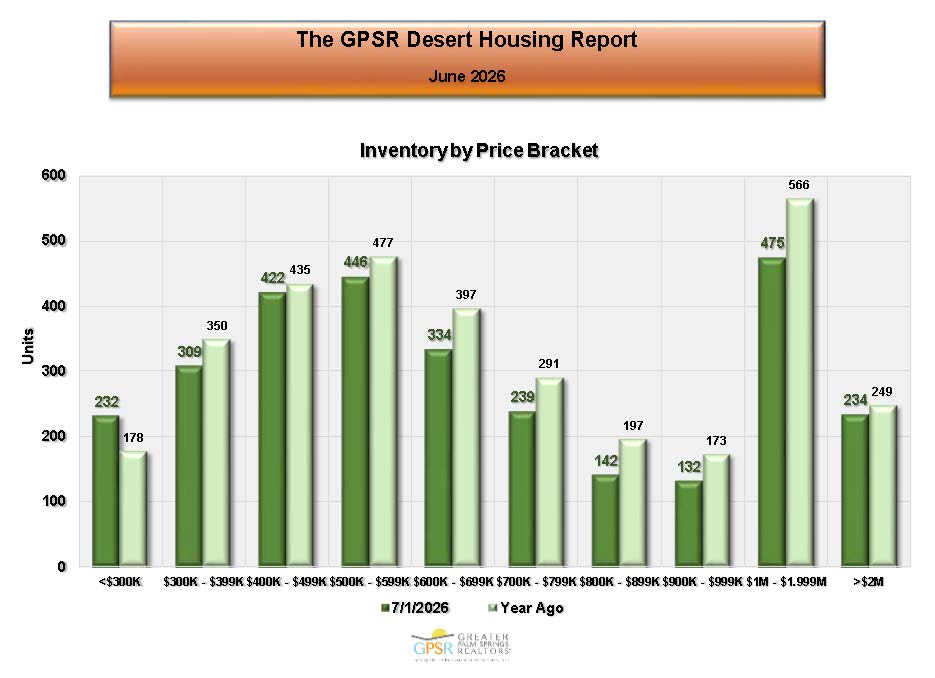 COACHELLA VALLEY JULY 1ST HOME SALE INVENTORY BY PRICE RANGE
The highest inventory level in the Coachella Valley on July 1st was 475 homes for sale for homes priced between $1 million and $1.999 million (down 16.1% from 566 homes for sale on July 1st, 2025), followed by 446 homes for sale for homes priced between $500K and $599K (down 6.5% from 477 homes for sale on July 1st, 2025). The lowest inventory level in the Coachella Valley on July 1st was 132 homes for sale for homes priced between $900 and $999K (down 23.7% from 173 homes for sale on July 1st, 2025). Market Watch noted that this information could help locate what price ranges might be responsible for the growth or contraction of inventory.
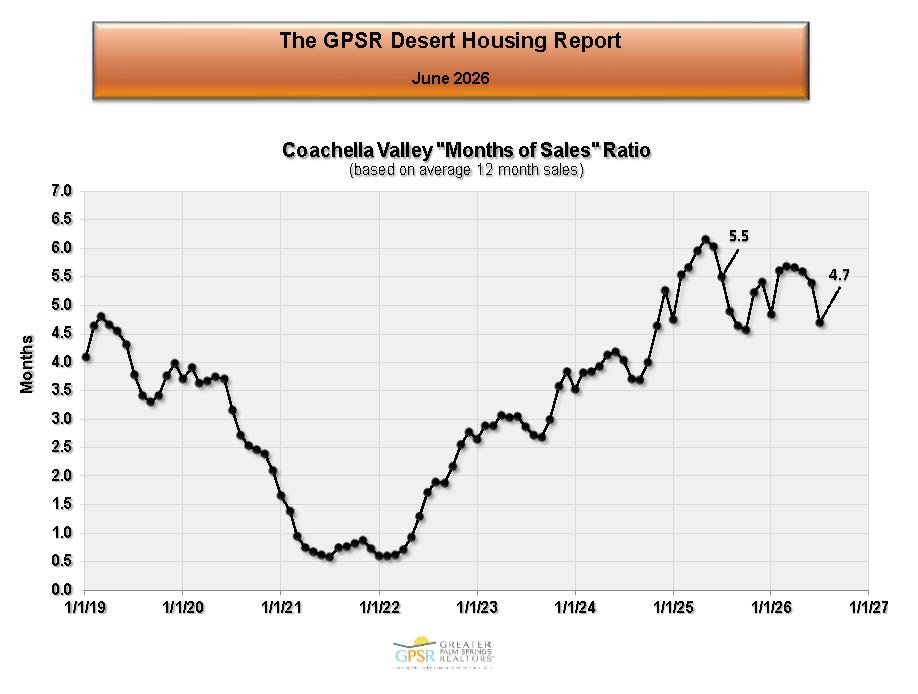 COACHELLA VALLEY JULY 1ST MONTHS OF SALES RATIO
On July 1st, the Coachella Valley’s months of sales ratio was 4.7 months (down from 5.5 months on July 1st, 2025 and 5.4 months on June 1st of this year). Market Watch commented that the month of sales ratio was a fundamental ratio, measuring supply and demand. They added that it is now above pre-pandemic levels. Market Watch pointed out that increased inventory coupled with lower sales has resulted in supply beginning to exceed demand. However, Market Watch felt that this should not cause a problem for home prices unless it began to extend average selling times.
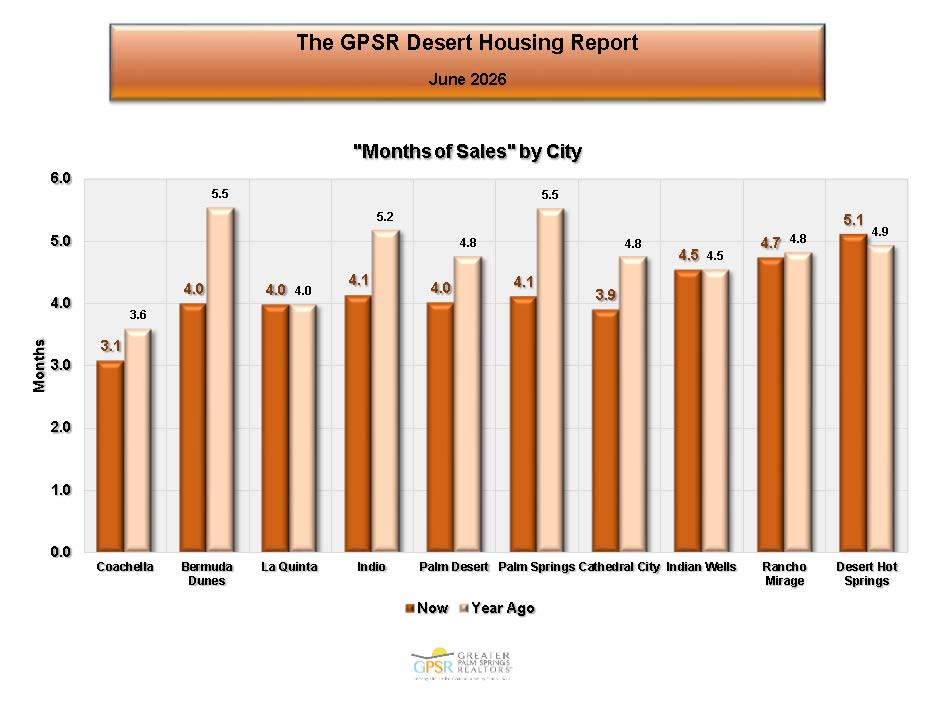 COACHELLA VALLEY JULY 1ST MONTHS OF SALES RATIO BY CITY
The highest months of sales ratio in the Coachella Valley on July 1st was 5.1 months in Desert Hot Springs (up from 4.9 months on July 1st, 2025), followed by Rancho Mirage at 4.7 months (down from 4.8 months on July 1st, 2025). The lowest months of sales ratio on July 1st was in Coachella at 3.1 months (down from 3.6 months on July 1st, 2025). Market Watch cautioned that since the months of sales ratio is the supply and demand equation for housing, this information showed that the Coachella Valley housing market was becoming supply heavy.
 COACHELLA VALLEY JULY 1ST MONTHS OF SALES RATIO BY PRICE RANGE
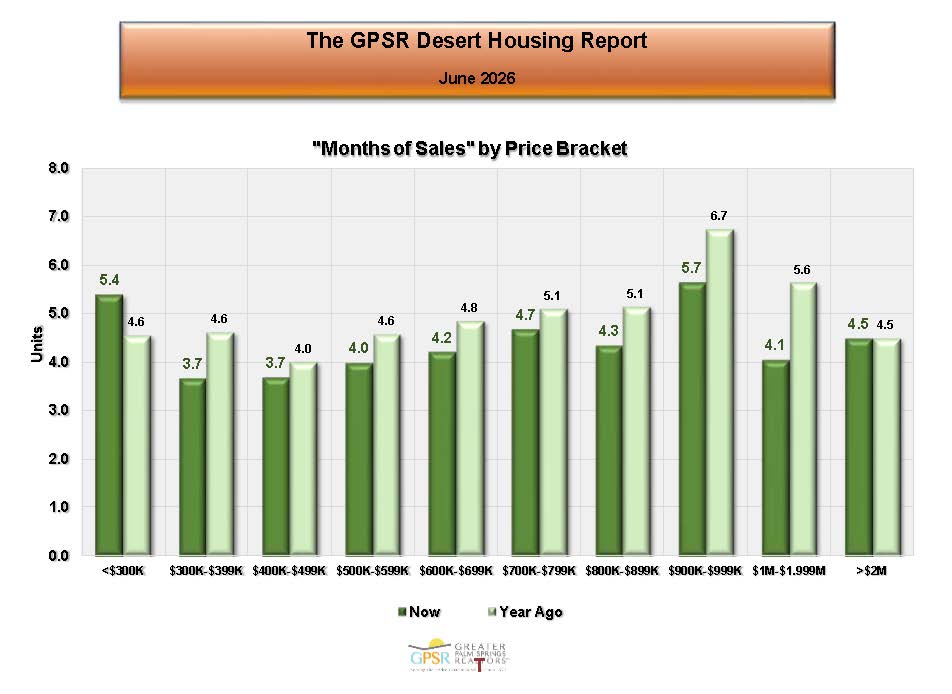
The highest months of sales ratio in the Coachella Valley on July 1st was 5.7 months for homes priced between $900K and $999K (down from 6.7 months on July 1st, 2025), followed by 5.4 months for homes priced under $300K (up from 4.6 months on July 1st, 2025). The lowest months of sales ratio on July 1st was 3.7 months for both homes priced between $300K and $399K (down from 4.6 months on July 1st, 2025) and for homes priced between $400K and $499K (down from 4.0 months on July 1st, 2025). Market Watch noted that based on this supply versus demand information, while Coachella Valley home prices have been affected somewhat, this should not intensify unless selling times begin to lengthen.
 COACHELLA VALLEY JUNE DAYS IN THE MARKET
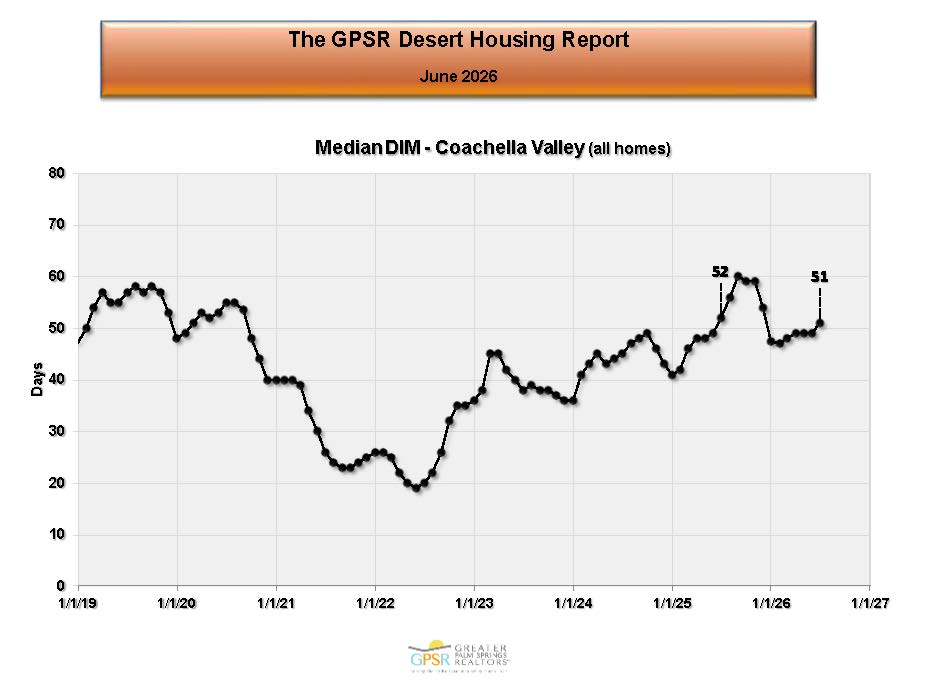
At the end of June, the median number of days in the Coachella Valley was 51 days (down from 52 days at the end of June 2025). Market Watch commented that the median selling time in the Coachella Valley has been stable and running between 40 and 60 days for over three years.
 COACHELLA VALLEY JUNE DAYS IN THE MARKET BY CITY
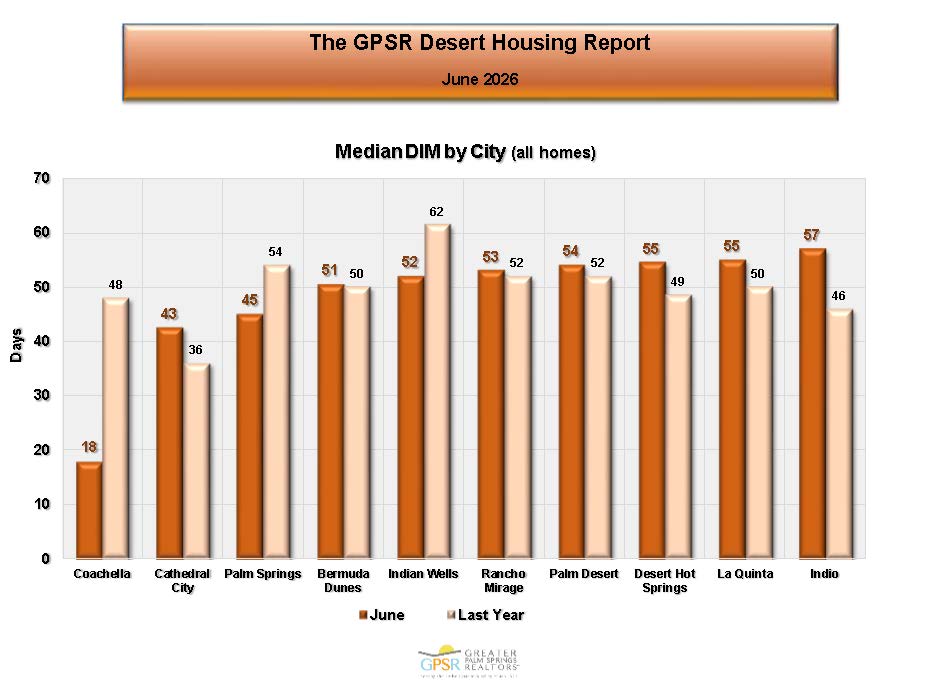
In the Coachella Valley in May, Coachella had the shortest median selling time at 18 days (down from 48 days in June 2025). This was followed by Cathedral City at 43 days (up from 36 days in June 2025). Indio had the longest median selling time at 56 days (up from 47 days in June 2025).
 COACHELLA VALLEY JUNE DAYS IN THE MARKET BY PRICE RANGE
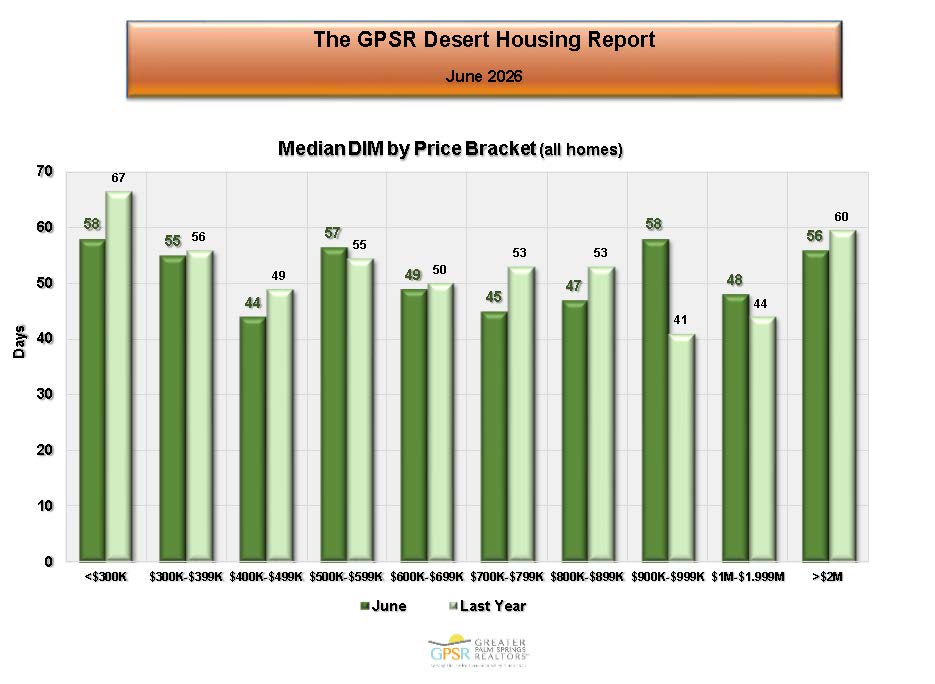
In the Coachella Valley, the shortest median selling time in June was 44 days for homes priced between $400K and $499K (down from 49 days in June 2025). The longest median selling time was 58 days for both homes priced under $300K (down from 67 days in June 2025) and for homes priced between $900K and $999K (up from 41 days in June 2025). Market Watch noted that selling times usually increase with higher priced homes. They felt it was positive that this trend didn’t apply in the current Coachella Valley market.
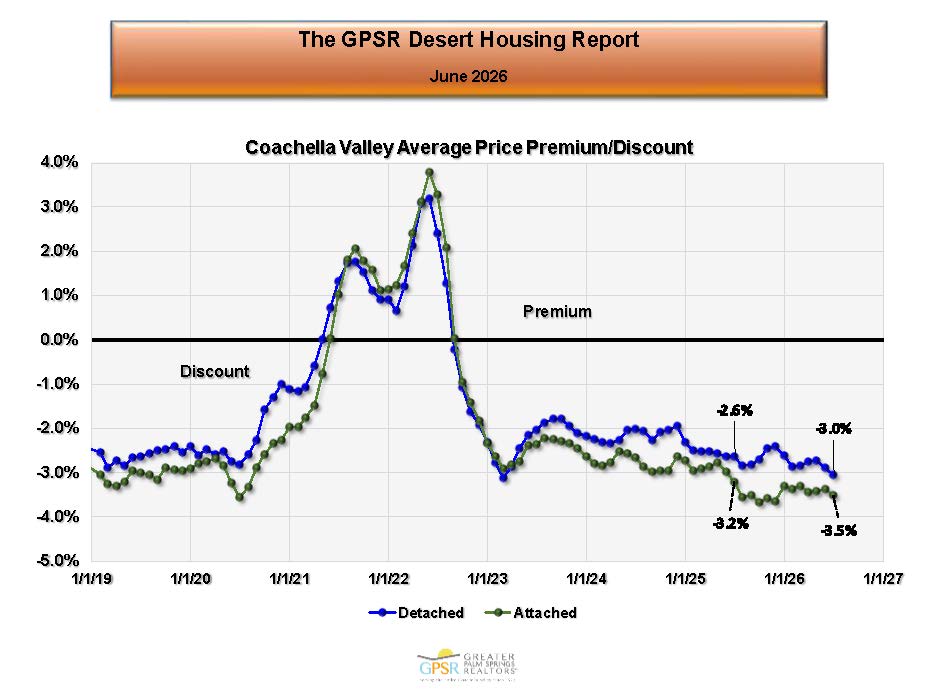 COACHELLA VALLEY JUNE AVERAGE PRICE PREMIUM/DISCOUNT FROM LIST PRICE
In June, detached homes in the Coachella Valley were selling at an average discount of -3% from list price (compared to an average discount of 2.6% in June 2025). In June, attached homes in the Coachella Valley were selling at an average discount of 3.5% from list price (compared to an average discount of 3.2% in June 2025). Market Watch explained that these average discounts from list price were back to pre-covid norms.
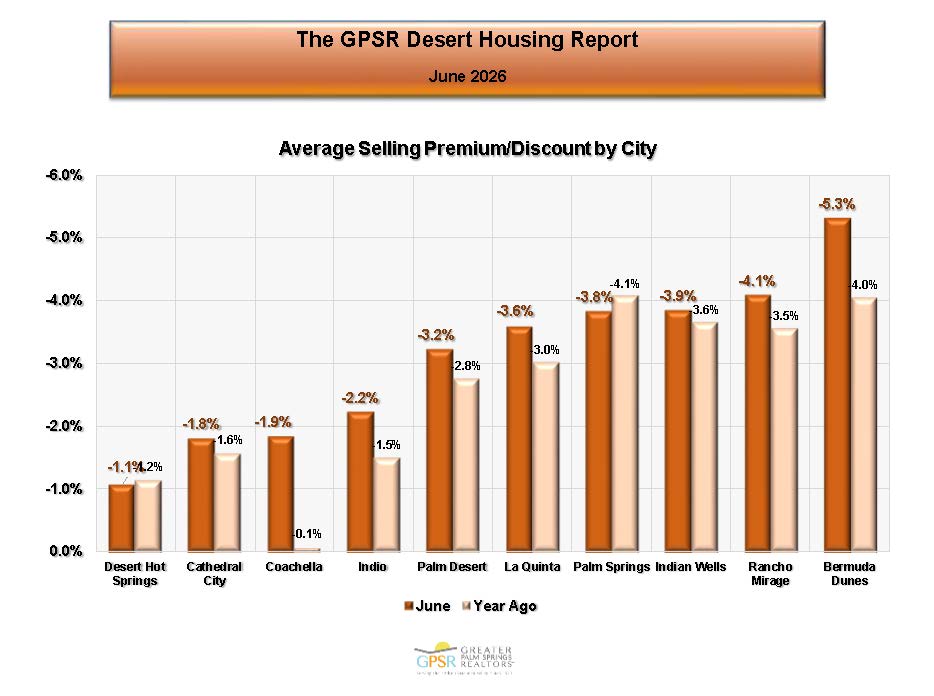 COACHELLA VALLEY JUNE AVERAGE PRICE PREMIUM/DISCOUNT FROM LIST PRICE BY CITY
In the Coachella Valley, Desert Hot Springs had the lowest average discount from list price in June at 1.1% (compared to an average discount of 1.2% in June 2025). Bermuda Dunes had the highest average discount from list price at 5.3% (compared to an average discount of 4.0% in June 2025).
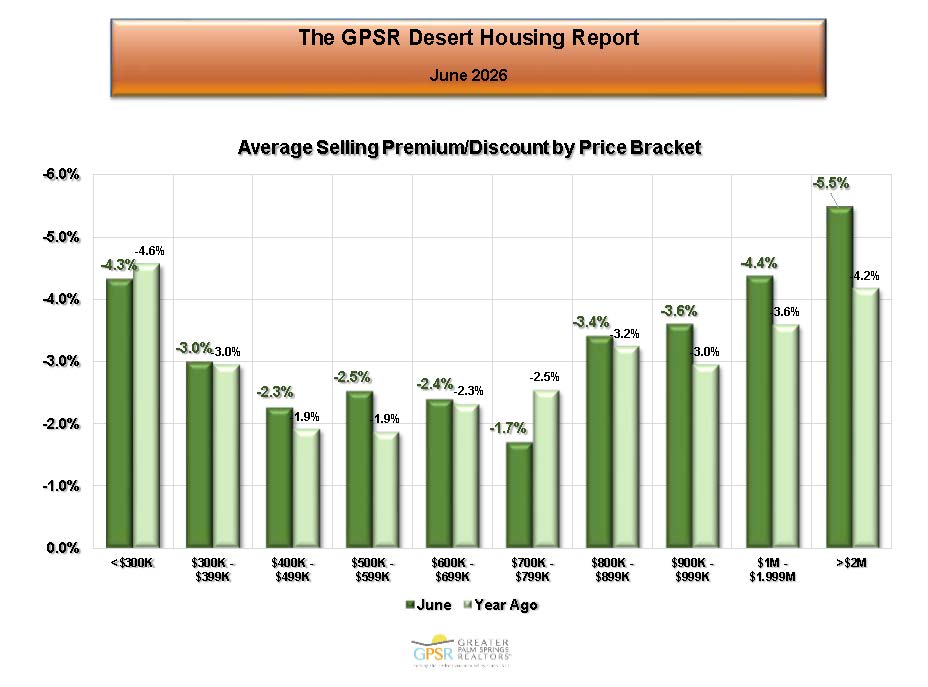 COACHELLA VALLEY JUNE AVERAGE PRICE PREMIUM/DISCOUNT FROM LIST PRICE BY PRICE RANGE
In the Coachella Valley, the lowest average discount from list price in June was 1.7% for homes priced between $700K and $799K (compared to an average discount of 2.5% in June 2025). The highest average discount from list price in June was 5.5% for homes priced over $2 million (compared to an average discount of 4.2% in June 2025). Market Watch pointed out that price discounts usually increase with higher priced homes. However, in the Coachella Valley the lowest discounts in June were in the middle price ranges.
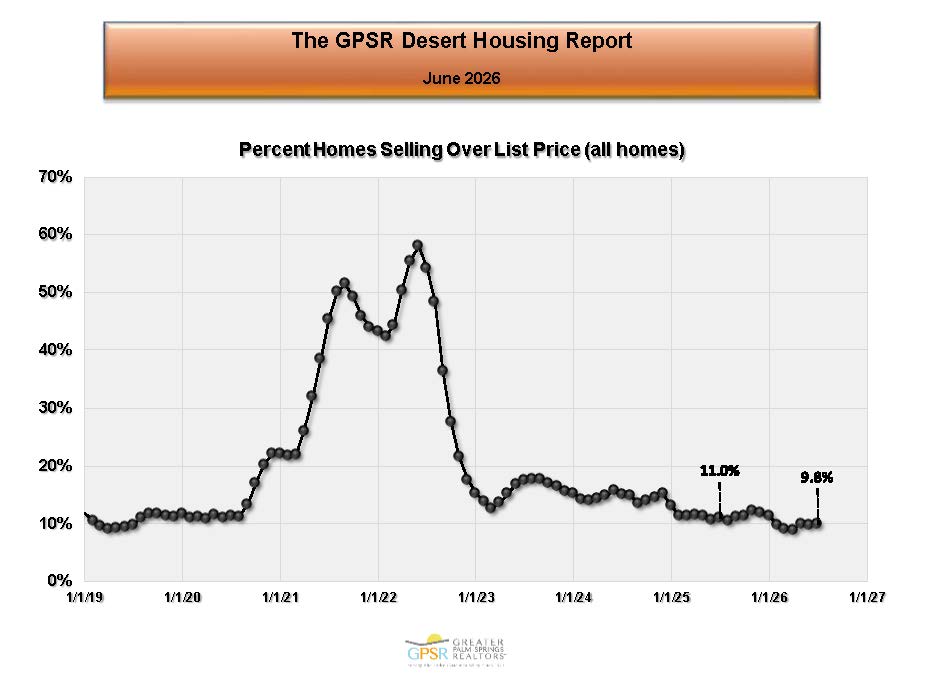 COACHELLA VALLEY JUNE PERCENTAGE OF HOMES SELLING ABOVE LIST PRICE
In the Coachella Valley in June, the percentage of homes selling over list price was 9.8% (dropping from 11.0% in June 2025). Market Watch did note that the percentage of homes selling above list price was back to pre-pandemic levels.
THE BRIGGS GROUP | COLDWELL BANKER | Laurie Briggs - DRE# 01896117 | Tim Briggs - DRE# 01898254 | Coldwell Banker Realty - DRE# 00616212