
(Please click on the image above to view our short YouTube video)
Greater Palm Springs real estate market experts, Market Watch LLC, have just released their November 2019 Desert Housing Report, which takes a look at the state of the Coachella Valley’s residential real estate market in November. Some of the highlights:

The Coachella Valley median detached home price was $415,000 in November (an increase of 5.0% from the $395,000 median detached home price in November 2018). Market Watch pointed out that this is the highest November median detached home price ever.

The Coachella Valley median attached home price was $275,000 in November (an increase of 3.7% from the $265,000 median attached home price in November 2018). Market Watch pointed out the seasonal pattern in median attached home prices, with lows reached in September followed by rising prices until around May. Market Watch expects this trend to continue, with the median attached home price surpassing $3000,000 sometime in the coming spring.

Median detached home prices continued to rise in six of nine cities (Cathedral City, Indio, Desert Hot Springs, Palm Springs, Rancho Mirage and Palm Desert), ranging from +8.6% in Cathedral City to +1.5% in Palm Desert. Three cities (Coachella, La Quinta and Indian Wells) experienced decreases in their median detached home prices, ranging from -6.1% in Coachella to -13.4% in Indian Wells. Palm Springs is the only city where the median detached home price is above the 2006-2007 previous high median detached home price (by +8.3%). Median Attached home prices rose in three 3 cities (Cathedral City, Palm Springs and Indian Wells), ranging from +3.6% in Indian Wells to +10.6% in Cathedral City. Median attached home prices decreased in 4 cities (Palm Desert, Rancho Mirage, Indio and Desert Hot Springs), ranging from -0.9% in Palm Desert to -38.7% in Desert Hot Springs. Market Watch pointed out that median attached home prices are significantly below the 2006-2007 previous high median attached home price (ranging from -23.7% below the 2006/2007 previous high in Palm Springs to -67% below the 2006-2007 previous high in Desert Hot Springs).
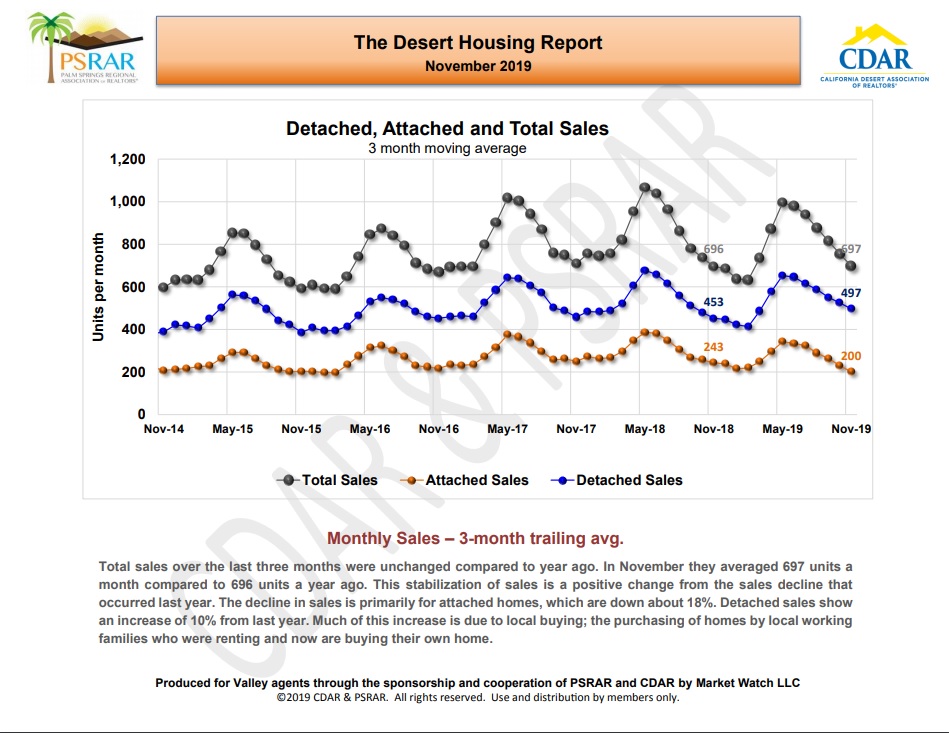
Total home sales over the last three months were basically unchanged from a year ago, averaging 697 units a month vs 696 units per month in November 2018. Market Watch noted that this stabilization of sales was a positive change from the slight home sales decline that occurred last year. Sales of detached homes increased by roughly 10% to 497 homes per month from 453 homes per month in November 2018. Sales of attached homes fell roughly 18% to 200 homes per month from 243 homes per month in November 2018.

In looking at home sales by city, six cities had higher three-month average sales (Coachella, Desert Hot Springs, Indian Wells, Indio, Rancho Mirage and Thousand Palms). Home sales increased by 26% year-over-year in Indian Wells, 13% in Desert Hot Springs and 10% in Rancho Mirage. Three cities had lower sales (Bermuda Dunes, Palm Desert and Palm Springs). Sales in Palm Springs were down 10% from a year ago while sales in Palm Desert were down 4% year-over-year.

Looking at sales by price range, sales in price ranges below $300,000 continued to decline and sales in the price ranges between $400,000 and $600,000 had the largest percentage increase in sales. Market Watch noted that sales of homes over $1,000,000 increased by 45%.
 The Coachella Valley housing inventory for both detached and attached homes stood at 3,187 units on December 1st. This inventory level is far below previous inventory levels on December 1st since far as 2014. Market Watch felt that this was a strong indicator of higher prices.
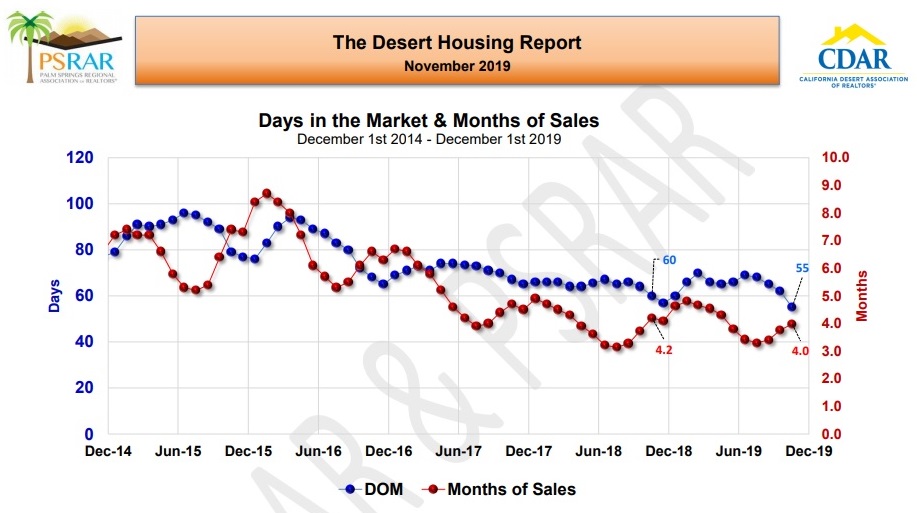
While inventory is lower than one year ago, the sales rate is also slightly less, so the months of sales (a measure of how long it would take to sell the entire current housing inventory at the current home sales rate) at 4 months is roughly the same as it was on December 1st 2018 (4.2 months). Market Watch noted that both of these ratios were very low on a historical basis. The median number of days in the market was 55 days, the lowest number of days in the market in the last 5 years. Market Watch noted that both of these point to a very healthy housing market.
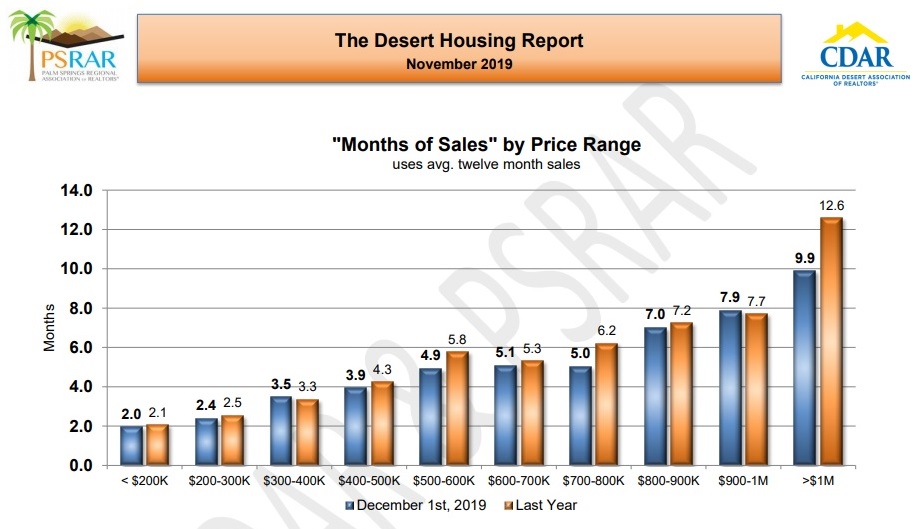
In looking at months of sales in different price ranges, Market Watch felt that comparative values on a year-over-year basis showed a housing market that was healthy in all price ranges. They noted the improvement in the ratio of months of sales for homes priced over $1,000,000 (a decrease form 12.6 months to 9.9 months).

Market Watch noted that the months of sales by city showed that the housing market is healthy in all cities in the Coachella Valley.

Lastly, the November Sale Price Discount From List was -1.9% (the same as November of last year). The chart shows a consistent yearly improvement in the metric over the last five years, with the current reading being the lowest in 5 years. This metric means that the average home offered at $400,000 sold for $392,400.
 CalDRE# 01898254 | 01896117 | 02043759