 (Please click on the bove image to view our YouTube Shorts video)
Local housing market experts, Market Watch LLC, have just released their November 2022 Desert Housing Report. Some highlights:
 NOVEMBER COACHELLA VALLEY DETACHED HOME MEDIAN PRICE: The Coachella Valley detached home median price in November was $649,000 (up 5.5% from a detached home median price of $615,000 in November 2021 but also down 3.9% from a median price of $675,000 in October). Market Watch commented that this month-to-month decline in detached home median price was a little unusual since these prices typically begin to rise in November. Further, they highlighted that while the November detached home median price was down 8.6% from the detached home median price high of $710,000 in July of this year, it was important not to follow the many alarming comments being made.
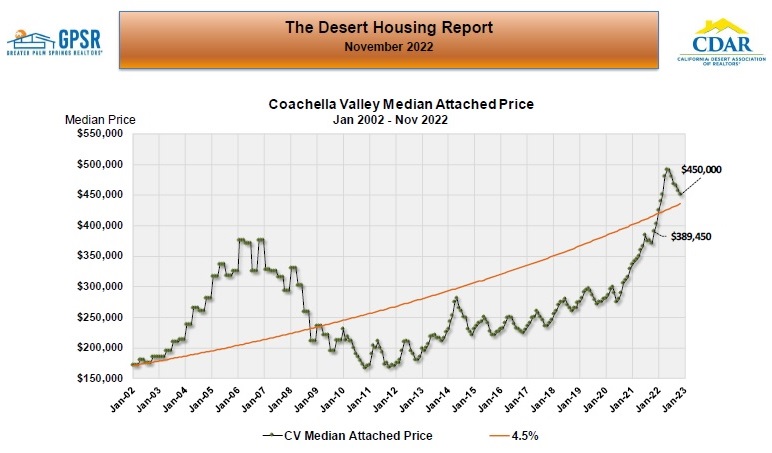 NOVEMBER COACHELLA VALLEY ATTACHED HOME MEDIAN PRICE: The Coachella Valley attached home median price in November was $450,000 (up 15.5% from an attached home median price of $389,450 in November 2021 but also down 1.7% from an attached home median price of $456,250 in October). Market Watch revealed that seasonal attached home median price corrections of 10% to 15% often occur during the summer. Further they stated that the attached home median price was down 8.2% from the attached home median price high of $490,000 in June of this year. Based on historical patterns, Market Watch expects the Coachella Valley attached home median price to fall to roughly $435,000.
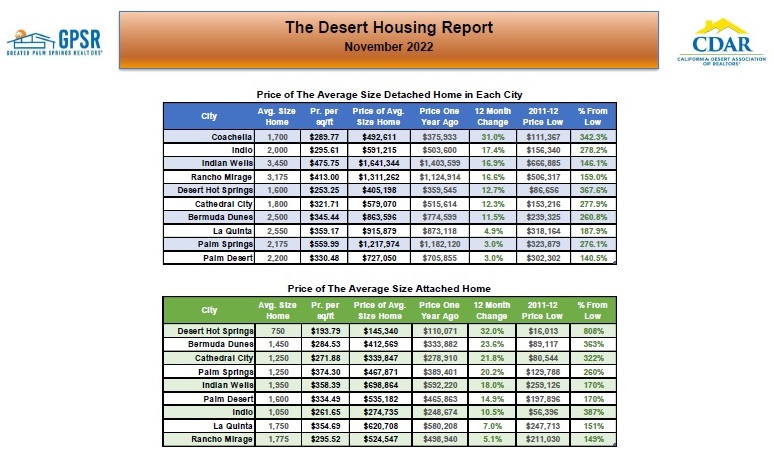 NOVEMBER TWELVE MONTH CHANGE IN THE PRICE OF AN AVERAGE SIZE HOME BY CITY: Market Watch noted that detached home median price increases year-over-year are slowing, with only Coachella (with a year-over-year increase of 31%) being the only Coachella Valley city with a detached home median price increase of above 20%. Market Watch noted that both Palm Desert and Palm Springs had the lowest increase in detached home median price year-over-year at 3%. Attached home median price increases year-over-year ranged from a high of 32% in Desert Hot Springs to 5.1% in Rancho Mirage.
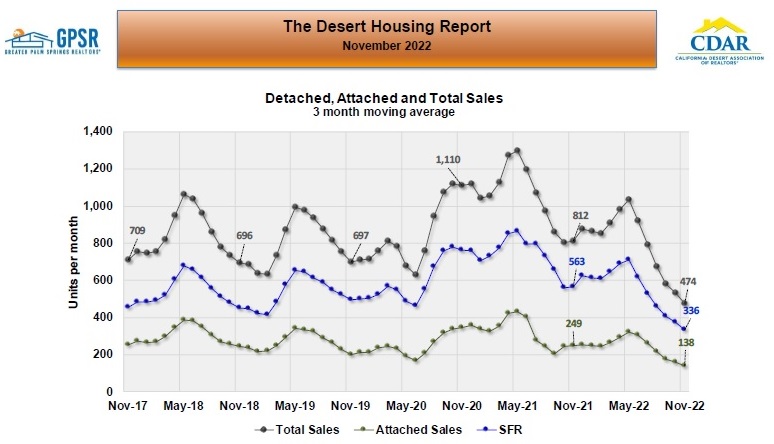 NOVEMBER MONTHLY HOME SALES (3 MONTH TRAILING AVERAGE): Monthly Coachella Valley home sales continued to decline in November to 474 home sales per month (down 41.6% from 812 homes sales per month in November 2021). Market Watch noted that in the three years before the pandemic, November home sales averaged 700 home sales per month (with November home sales down 32.3% from this average). Market Watch felt that with mortgage rates continuing at their current level, it does not appear sales will turn around anytime soon.
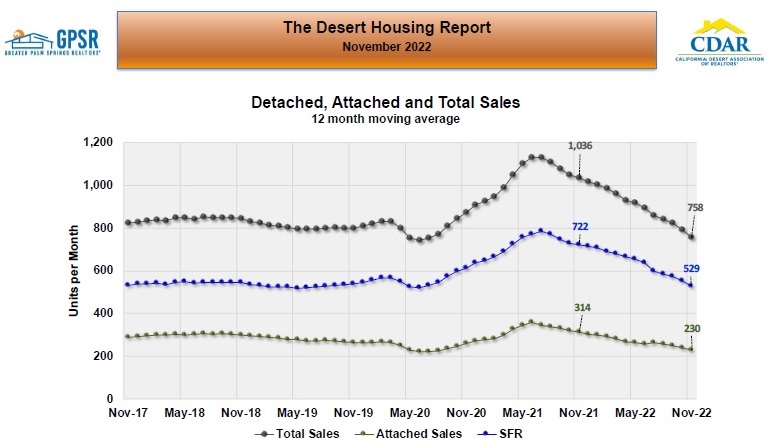 NOVEMBER MONTHLY HOME SALES (12-MONTH TRAILING AVERAGE): Based on a 12-month trailing average of monthly home sales, home sales in November were 758 home sales per month (down 27% from an average of 1,036 home sales per month in November 2021). Market Watch noted that this is the 16th consecutive month of a decline in the 12-month trailing average of monthly home sales, with monthly average home sales now below the pre-pandemic averages. Market Watch stated that these long-term sales numbers, which lag short term sales, will continue to decline.
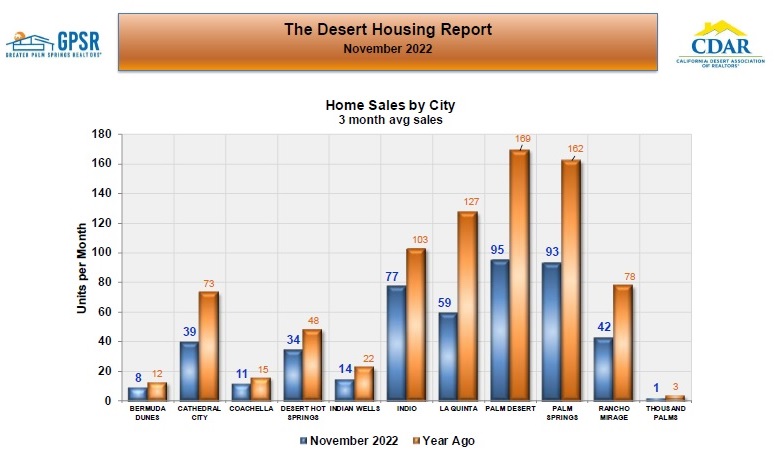 NOVEMBER MONTHLY HOME SALES BY CITY: Every Coachella Valley city had lower home sales in November compared to one year ago. The largest percentage home sales declines were in the cities of La Quinta (down 53.5% year-over-year), followed by Cathedral City (down at 46.6% year-over-year), Rancho Mirage (down 46.1% year-over-year), Palm Desert (down at 43.8% year-over-year) and Palm Springs (down 42.6% year-over-year). Indio had the lowest year-over-year home sales decline at 25.2%.
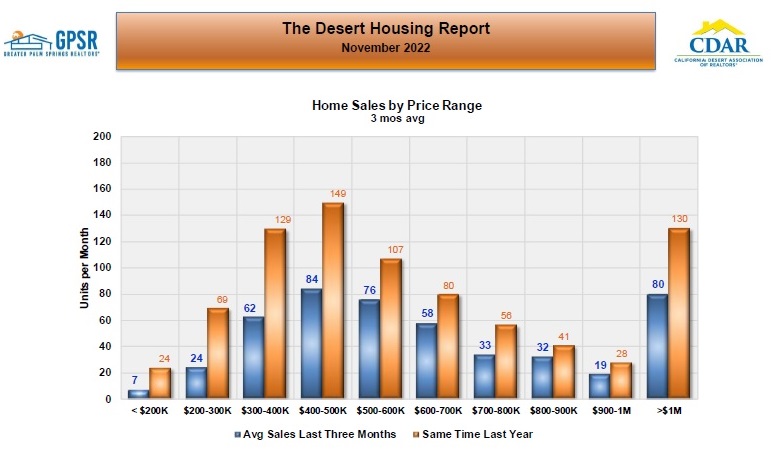 NOVEMBER MONTHLY HOME SALES BY PRICE RANGE: Market Watch noted that while every price range showed a home sales decline in November, the largest monthly sales declines were in homes priced under $500,000. For example, monthly sales of homes priced between $200,000 and $300,000 declined year-over-year by 65.2% in November. For homes priced between $300,000 and $400k, monthly home sales declined year-over-year by 51.9% in November. On the other hand, monthly sales of homes priced over $800,000 did better in November, with monthly home sales for homes priced between $800,000 and $900,000 only declining by 22% year-over-year. Monthly sales of homes priced over $1,000,000 in November were only down 38.5% year-over-year.
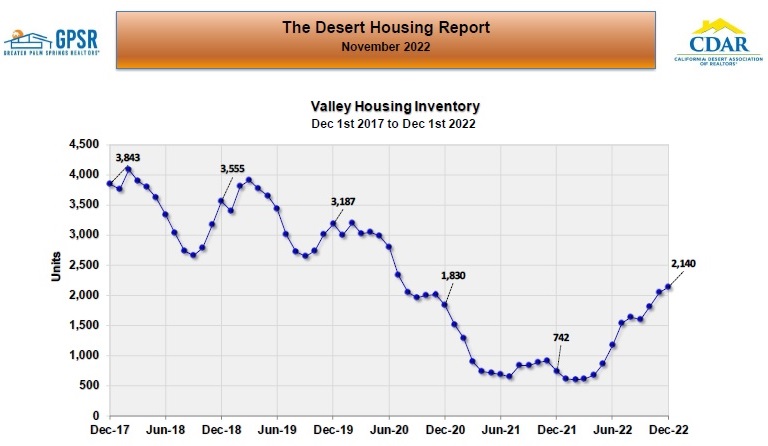 DECEMBER 1ST COACHELLA VALLEY HOME INVENTORY: On December 1st, Coachella Valley home inventory stood at 2,140 homes (up 92 homes or 4.5% from 2,048 homes on November 1st and up 1,398 homes or 188.4% from 742 homes on December 1st, 2021). Market Watch stated that this increase in home inventory was opposite to most other California regions, where inventory generally declined in November. They went on to explain that some of this inventory gain in the Coachella Valley was seasonal. They stated that if this pattern were to continue, total Coachella Valley home inventory would probably reach 2,500 homes by February.
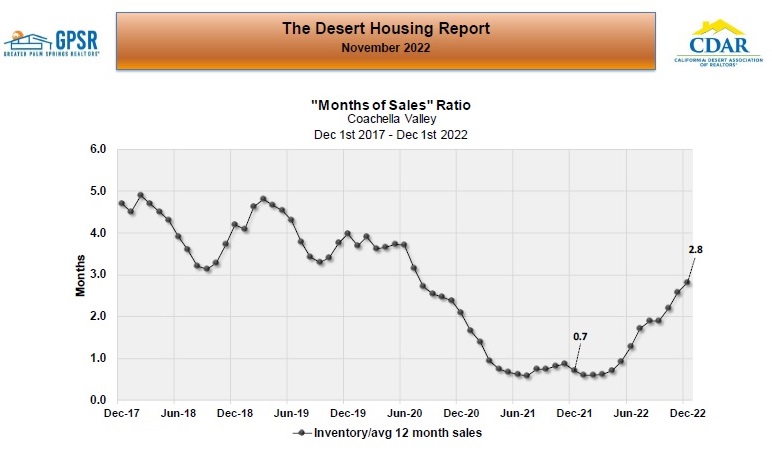 DECEMBER 1ST COACHELLA VALLEY REGIONAL MONTHS OF SALES RATIO: On December 1st, the Coachella Valley’s months of sales ratio was 2.8 months (up from 2.6 months in October and up from 0.7 months on December 1st, 2021). Market Watch explained that the December 1st months of sales ratio of 2.8 months was below the historical normal 4.0 months and implied that the balance of supply and demand still somewhat favored sellers. They further explained that even though home inventories have been rising and home sales falling, the changes were still not enough yet to bring the months of sales ratio back to normal levels.
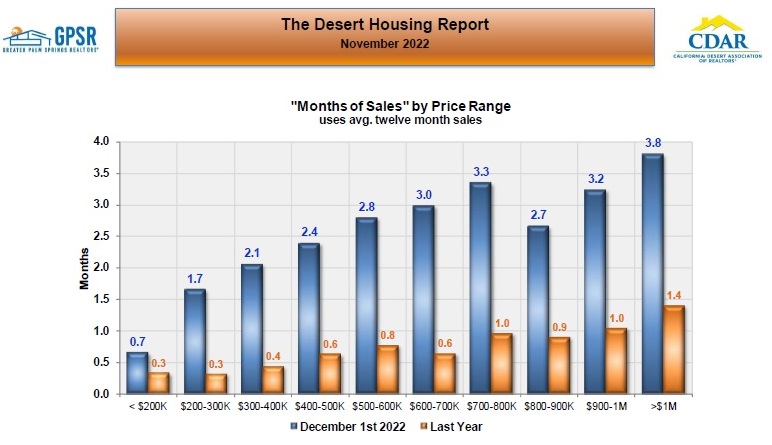 DECEMBER 1ST MONTHS OF SALES RATIO BY PRICE RANGE: Months of sales ratios on December 1st were higher than year ago levels in every price range. But market Watch cautioned that these months of sales ratios were still below historical norms. They also noted that the months of sales ratios show the normal pattern of higher ratios for higher priced homes than for lower priced homes (with the months of sales ratios for homes priced under $600,000 being under 3 months on December 1st and with the months of sales ratios for homes priced over $600,000, other than for homes priced between $800,000 and $900,000, at 3 months or higher).
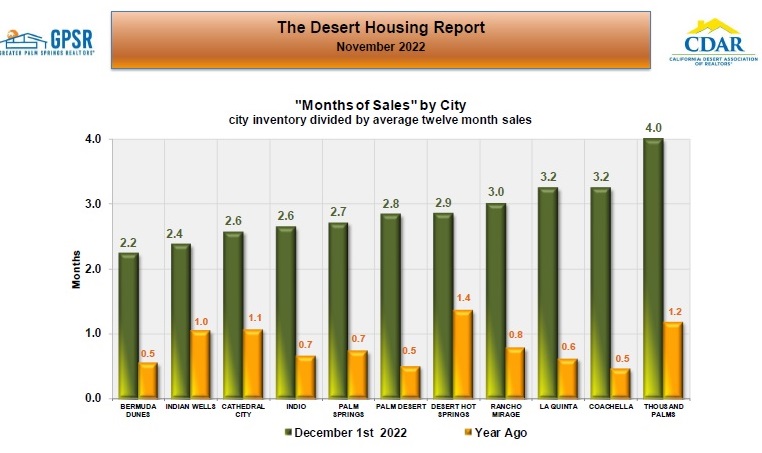 DECEMBER 1ST MONTHS OF SALES RATIO BY CITY: Months of sales ratios increased year-over-year in every Coachella Valley city. The months of sales ratios on December 1st ranged from 2.2 months in Bermuda Dunes (up from 0.5 months on December 1st 2021) to 4 months in Thousand Palms (up from 1.2 months on December 1st, 2021).
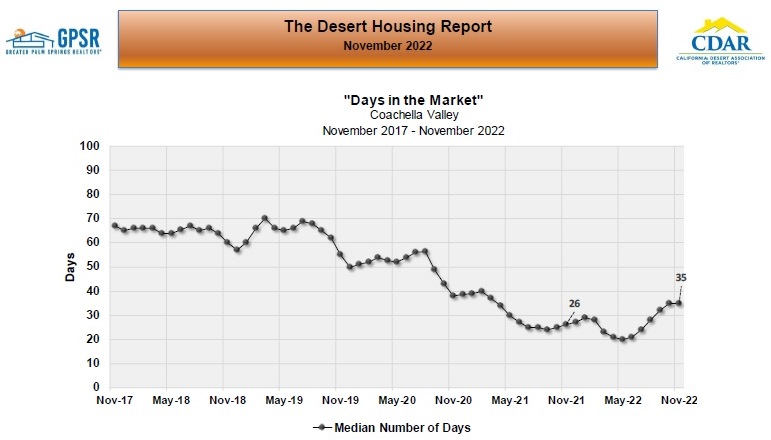 NOVEMBER COACHELLA VALLEY DAYS IN THE MARKET: At the end of November, the median number of days in the market for the entire Coachella Valley was 35 days (the same as October and nine days more than at the same time last year). Market Watch felt that we’ve seen the low in this metric and believe it will be back to 50 or 60 days relatively soon.
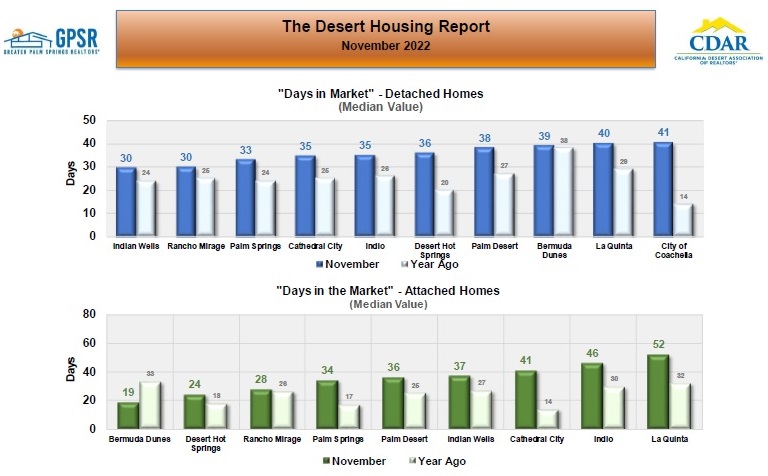 NOVEMBER DAYS IN THE MARKET BY HOME TYPE AND CITY: At the end of November, Indian Wells and Rancho Mirage had the shortest median selling time for detached homes at 30 days, followed by Palm Springs at 33 days. Coachella had the longest median selling time for a detached home at 41 days. For attached homes, Bermuda Dunes has the shortest median selling time at 19 days and La Quinta had the longest median selling time at 52 days.
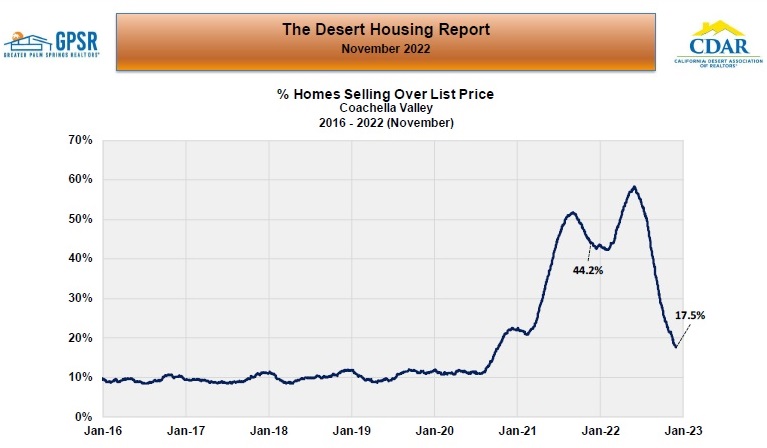 NOVEMBER PERCENTAGE OF HOMES SELLING ABOVE LIST PRICE: The percentage of homes in the Coachella Valley selling above list price over the last 3 months continued to decline in November to 17.5% (down from 21.6% in October and down from 44.2% one year ago). Market Watch noted that the market is rapidly approaching the historic norm for this metric of around 10%.
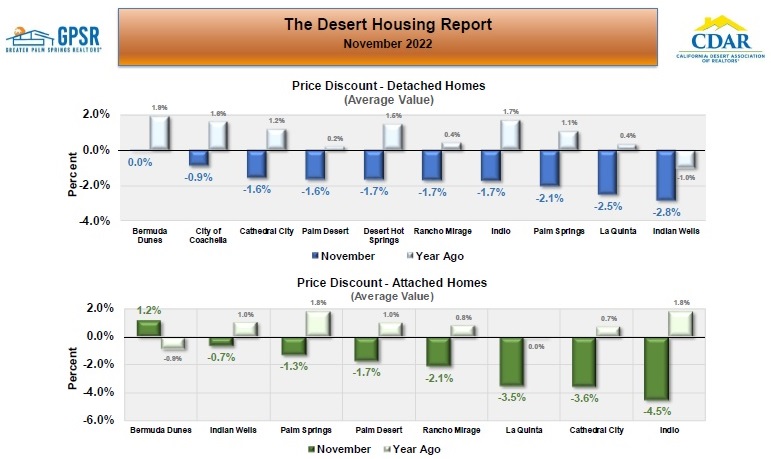 AVERAGE PRICE DISCOUNTS FROM LIST PRICE BY CITY: Detached homes were not selling for an average selling premium in any Coachella Valley city in November. Price discounts ranged from 0% in Bermuda Dunes to -2.8% in Indian Wells. Attached homes sold for an average selling Premium (of 1.2%) in Bermuda Dunes in November. Attached homes sold for an average discount in all other Coachella Valley cities, ranging from a discount of -0.7% in Indian Wells to -4.5% in Indio.
 This data was produced for Coachella Valley agents through the sponsorship and cooperation of GPSR and CDAR by Market Watch LLC.
The Briggs Group | COMPASS | Laurie Briggs DRE# 01896117 | Tim Briggs DRE# 01898254 | Compass DRE# 01991628